Progress 8 explained: what it means and why it matters for your child
Every August, school league tables are published and parents find themselves trying to decode a number that's rarely clearly explained.
One such number is each school's 'Progress 8 score' which appears alongside school names with little explanation of what it means or why it matters.
In plain English, a Progress 8 score answers one of the most important questions in education: did the school help their students improve - and if so, by how much?
What Progress 8 measures
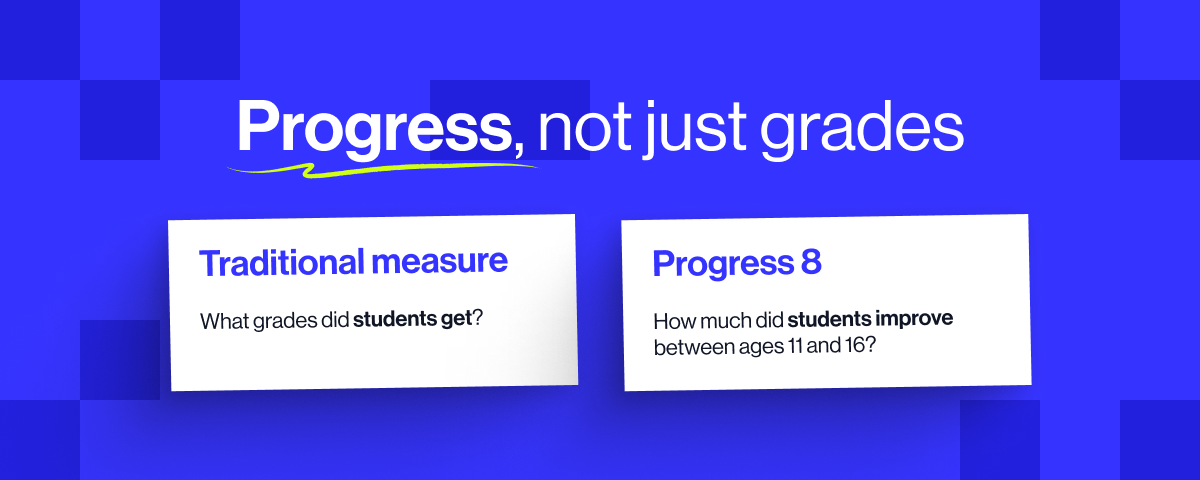 Most school performance measures ask "what grades did students get?" The problem with that is that schools in areas with more academically prepared intakes will always look better, not because they're better schools, but because they're recruiting children who are already ahead.
Progress 8 was designed to fix that. Introduced by the Department for Education in 2016, it doesn't look solely at what grades a student achieved at 16. Instead it looks at how much they improved between age 11 and 16, compared to other students who started at the same point.
The idea is that a school which takes a class of children who did OK at 11 and gets them to outstanding GCSE grades is doing something very different from a school that takes already high-achieving children and gets them to those same grades. Progress 8 tries to see the difference.
Step one: the Key Stage 2 score at age 11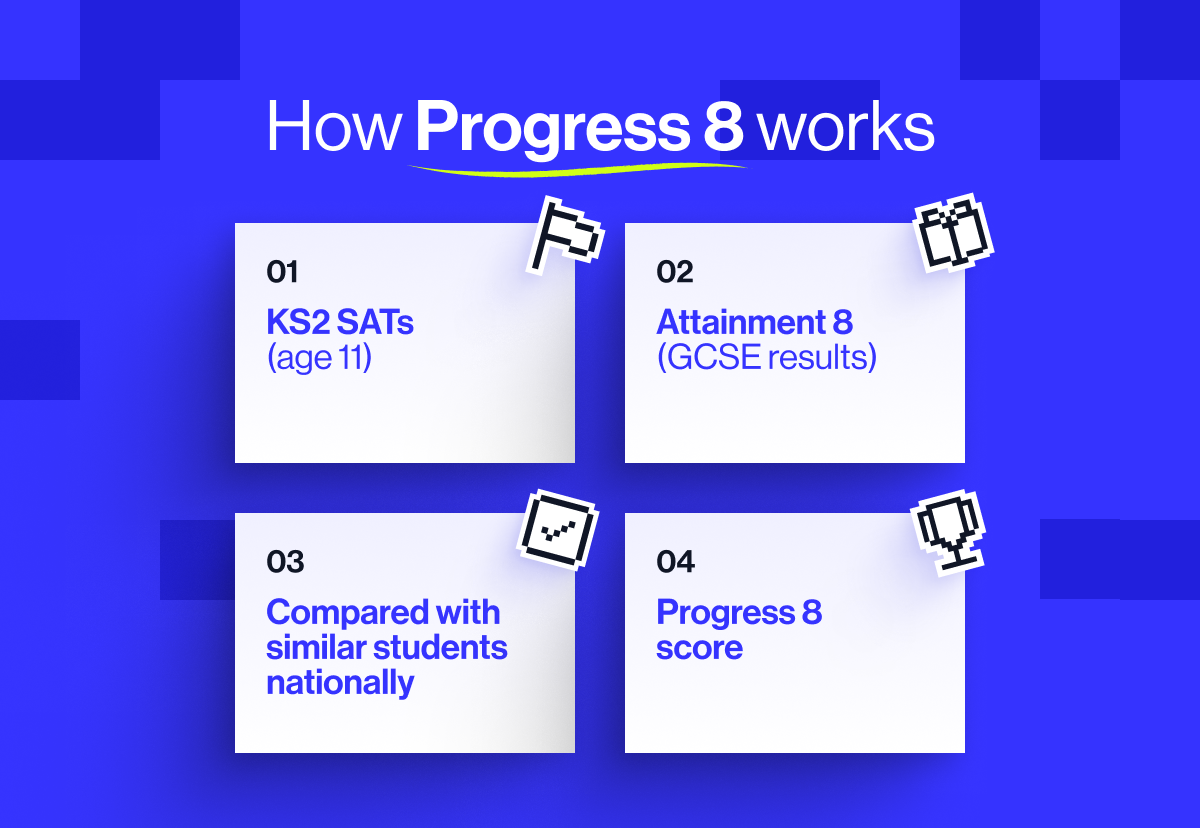
At the end of Year 6, students sit national tests in English and Maths - known as the KS2 SATs. Their marks are converted into a scaled score, from 80 to 120 where 100 always represents the national average for that year.
It's worth pausing on that last point. A scaled score of 100 doesn't mean a student got 100% of the questions right - it means they landed at the national midpoint. Half the country scored higher, half scored lower. A student can get 41 out of 60 on a paper and still score exactly 100, if that raw mark sits at the national median.
This KS2 score becomes the baseline and the entire Progress 8 calculation is built from this starting point.
Step two: Attainment 8 scoring - turning GCSE grades into a number
Progress 8 doesn't look at all of a student's GCSEs, it looks at eight specific subjects, organised into slots:
-
English Language (counts double)
-
Maths (counts double)
-
Three EBacc subjects - these include Sciences, History, Geography, Modern Foreign Languages and Computer Science
-
Three others - which can be any other approved GCSE or vocational qualification
English and Maths each count double so you're effectively adding up 10 values and dividing by 10, to calculate the student's 'Attainment 8' score.
Also, because English and Maths count double, doing well in those two subjects has the biggest single impact on a student's Attainment 8. This is part of why ensuring students have the best possible GCSE Maths and English support is so valuable - it doesn't just earn two grades, it earns four of the 10 score points.
Step three: comparing to similar students nationwide
Here's where it gets clever. Once a student's Attainment 8 is calculated, it's compared to the national average Attainment 8 for every student in the country who had the same KS2 score. This is the "expected" Attainment 8.
The DfE calculates these expected values by looking at what students with each KS2 score actually went on to achieve at GCSE across the country - drawing on the results of hundreds of thousands of students to set a consistent benchmark.
So, a student's Progress 8 score is simply: Attainment 8 achieved − Attainment 8 expected = Progress 8 score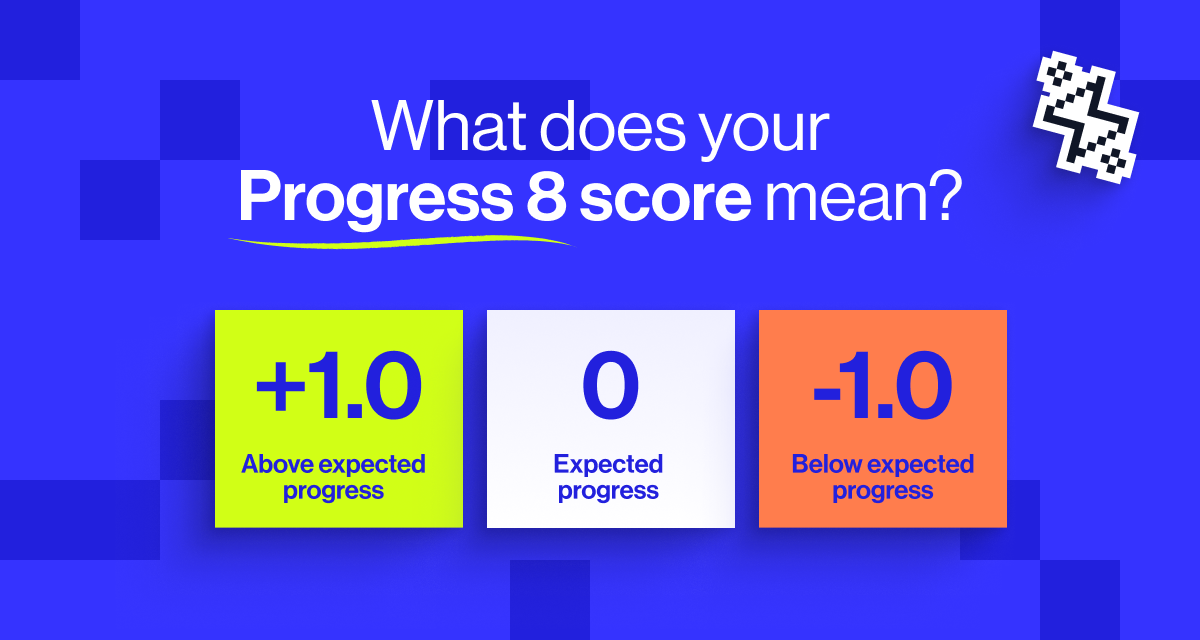
A score of zero means a student made exactly as much progress as similar students across the UK. A positive score means they exceeded expectations, while a negative score means they fell short.
A school's overall Progress 8 is the average of its individual student's scores. And, because every single child's score counts the same, there's no incentive for schools to focus effort only on borderline cases.
What a good Progress 8 score looks like in practice
To make this concrete, here are two example students from the same school who both achieved a Key Stage 2 score of 112 - putting them in the top 10% of students nationally, but crucially starting their GCSEs at the same point.
Example student 1
-
English Language: 9
-
Maths: 9
-
Physics: 8
-
Chemistry: 8
-
History: 8
-
French: 7
-
Music: 8
-
English Literature: 8
→ Attainment 8: 8.3
→ Expected: 6.3
→ Progress 8:+2.01
Example student 2
-
English Language: 3
-
Maths: 3
-
Physics: 3
-
Chemistry: 4
-
History: 3
-
French: 3
-
Music: 4
-
English Literature: 2
→ Attainment 8: 3.1
→ Expected: 6.3
→ Progress 8: −3.19
Both students had the same high starting point at age 11. Student 1 built on it; student 2 fell well short of what was expected - and that's reflected in their Progress 8 scores.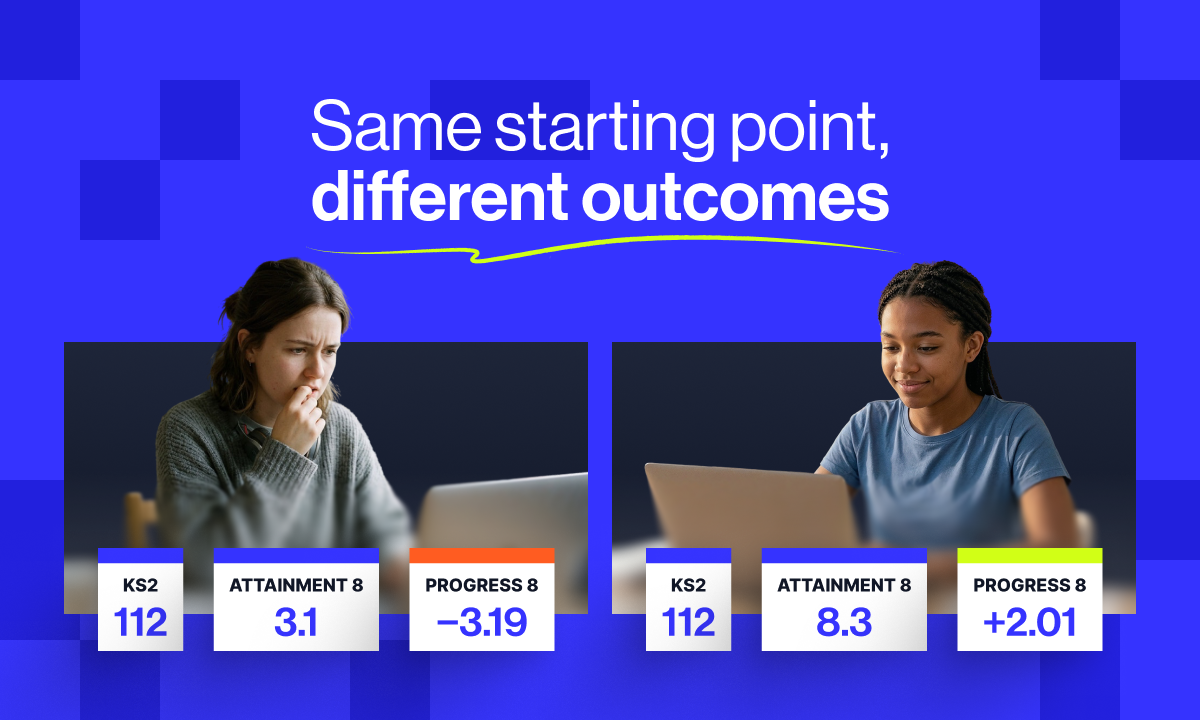
Why Progress 8 is an improvement on what came before
Before Progress 8, the headline measure was the percentage of students achieving five or more GCSEs at grades A*-C, including English and Maths.
This created a rational - but damaging - incentive: put your energy into students hovering just below the C/D borderline, because getting them over the line moved the school's headline figure. From a strategic point of view, those students well above the threshold, or those so far below it they were unlikely to reach it, were irrelevant.
Research from FFT Education Datalab - one of the UK's leading independent education data organisations - found that after Progress 8 replaced the old threshold measure, students who'd previously sat near the C/D boundary made relatively less progress, while students both above and below that boundary made more.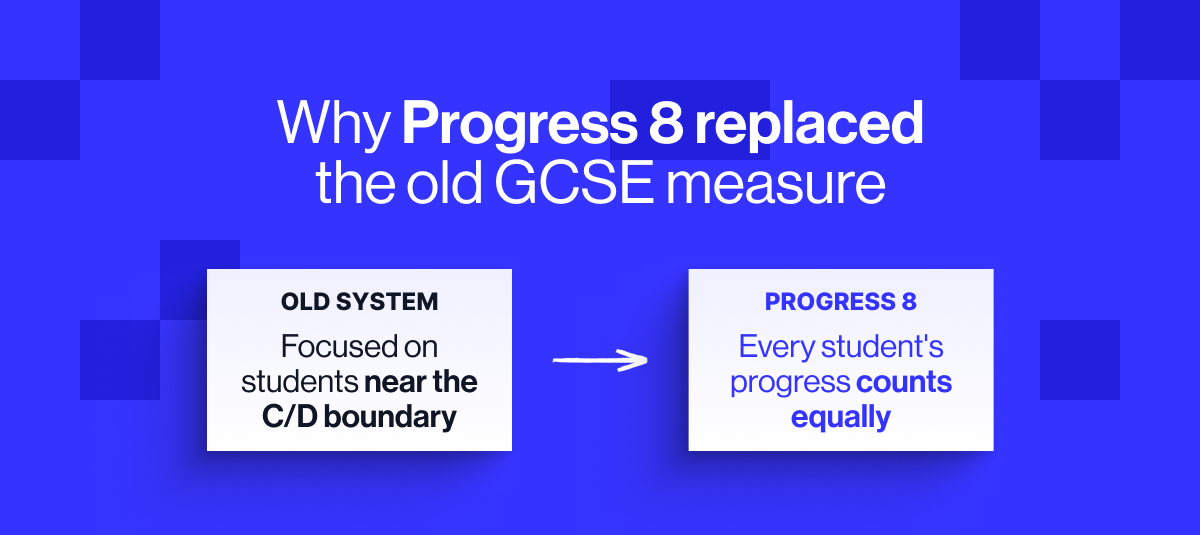
What Progress 8 doesn't tell you
Progress 8 is a more honest measure than most, but it's not a perfect one.
It only adjusts for one thing - Key Stage 2 (KS2) prior attainment. It doesn't adjust for deprivation, family instability, the proportion of students with SEND needs, or English as an additional language. Schools serving the most disadvantaged cohorts tend to score lower on Progress 8 even after accounting for prior attainment, because the disadvantages those students carry into Year 7 aren't fully captured by a KS2 score.
A positive Progress 8 score is not automatically a sign of great teaching, because it may partly reflect a cohort with advantages that don't show up in their KS2 SATs. And a negative score is not automatically a sign of failure, because it may reflect a school doing genuinely excellent work with a highly complex intake.
The national average Progress 8 score is always exactly 0 - by design. The expected values are calculated from national results, so the scores always centre on zero for mainstream schools. This means a school can improve every year in absolute terms and still stand still in Progress 8, if other schools improve at the same rate.
It's also worth knowing that Progress 8 scores are not currently published for the 2024–25 or 2025–26 school years. Students sitting GCSEs in those years missed their KS2 SATs during the Covid-19 pandemic, meaning there is no baseline to calculate from. The most recent published Progress 8 data is from 2023-24.
What Progress 8 means for your family
Progress 8 shifts the question from "what did your child achieve?" to "how much did they improve?" That's a more meaningful question, but it also places real weight on the quality of teaching your child receives, and whether it's matched to their level.
A child arriving in Year 7 with a KS2 score of 96 faces different expectations than one arriving with 112, but both are expected to make strong progress from their own starting point. If the teaching they receive doesn't stretch them relative to that starting point, it will show.
At MyEdSpace, our handpicked teachers teach live GCSE Maths and English lessons (plus Biology, Chemistry and Physics) specifically designed to build the skills students need to earn higher GCSE grades, and in turn higher Attainment 8 scores.
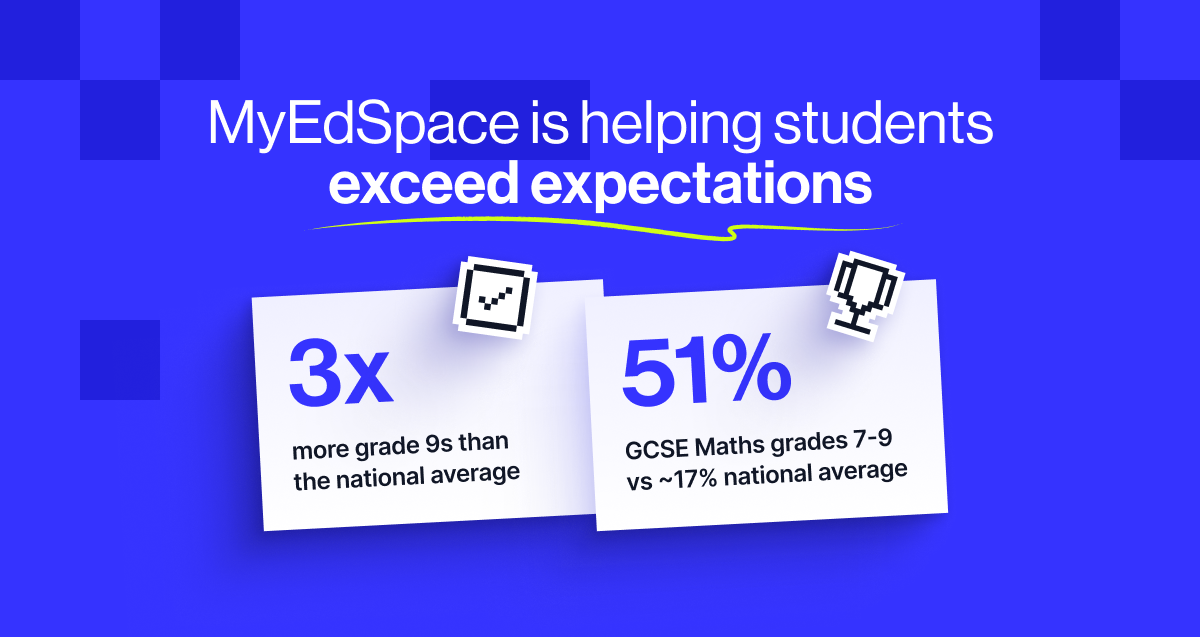
For example, in 2025, three times more MyEdSpace students achieved GCSE grade 9 than the national average. Meanwhile, 51% of our GCSE Maths students achieved grades 7–9, compared to a national average of around 17%.