Chemical Equilibria
Lajoy Tucker
Teacher

Definition
Reversible reactions are reactions in which the products can reform the reactants.
The forward reaction describes reactants being converted to products . The reverse reaction describes products being converted back to reactants .
A dynamic equilibrium is established in a closed system when:
The forward and reverse reactions occur at the same rate.
The concentrations of reactants and products remain constant.
Graph to show the rate of the forward and reverse reactions over time

No answer provided.
Features of Dynamic Equilibrium
The macroscopic properties (e.g. concentration, pressure) appear unchanging.
Molecular-level processes continue in both directions.
No net change in amounts of products/reactants once equilibrium is reached.
Position of Equilibrium
For a system in dynamic equilibrium, there is no net change in the concentrations of reactants and products but this does not mean that the concentrations of reactants and products are equal.
The position of equilibrium indicates which side is favoured:
More products → "lies to the right"
More reactants → "lies to the left"
Graphs to show the concentrations of reactants and products over time.

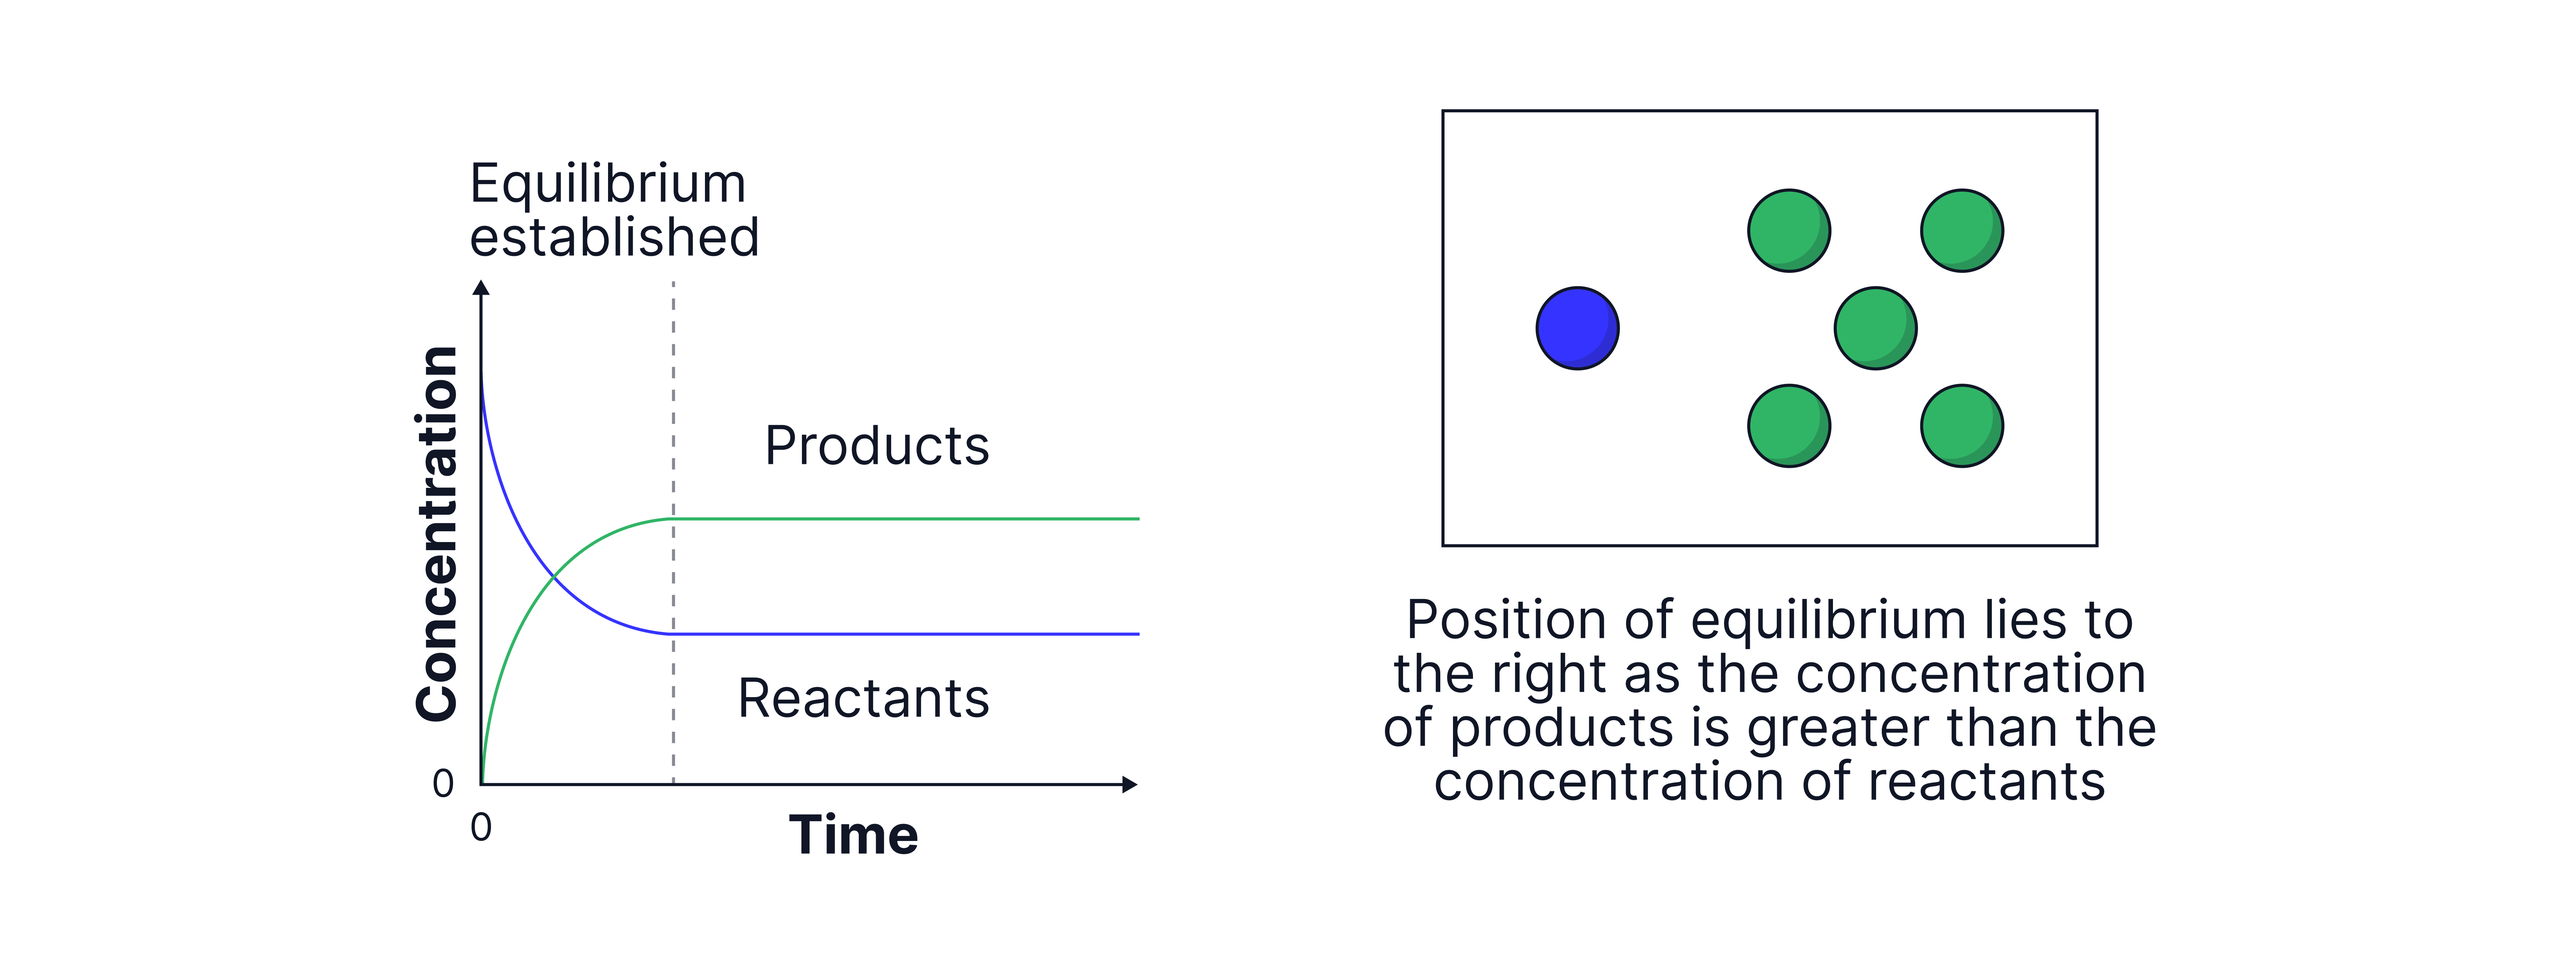
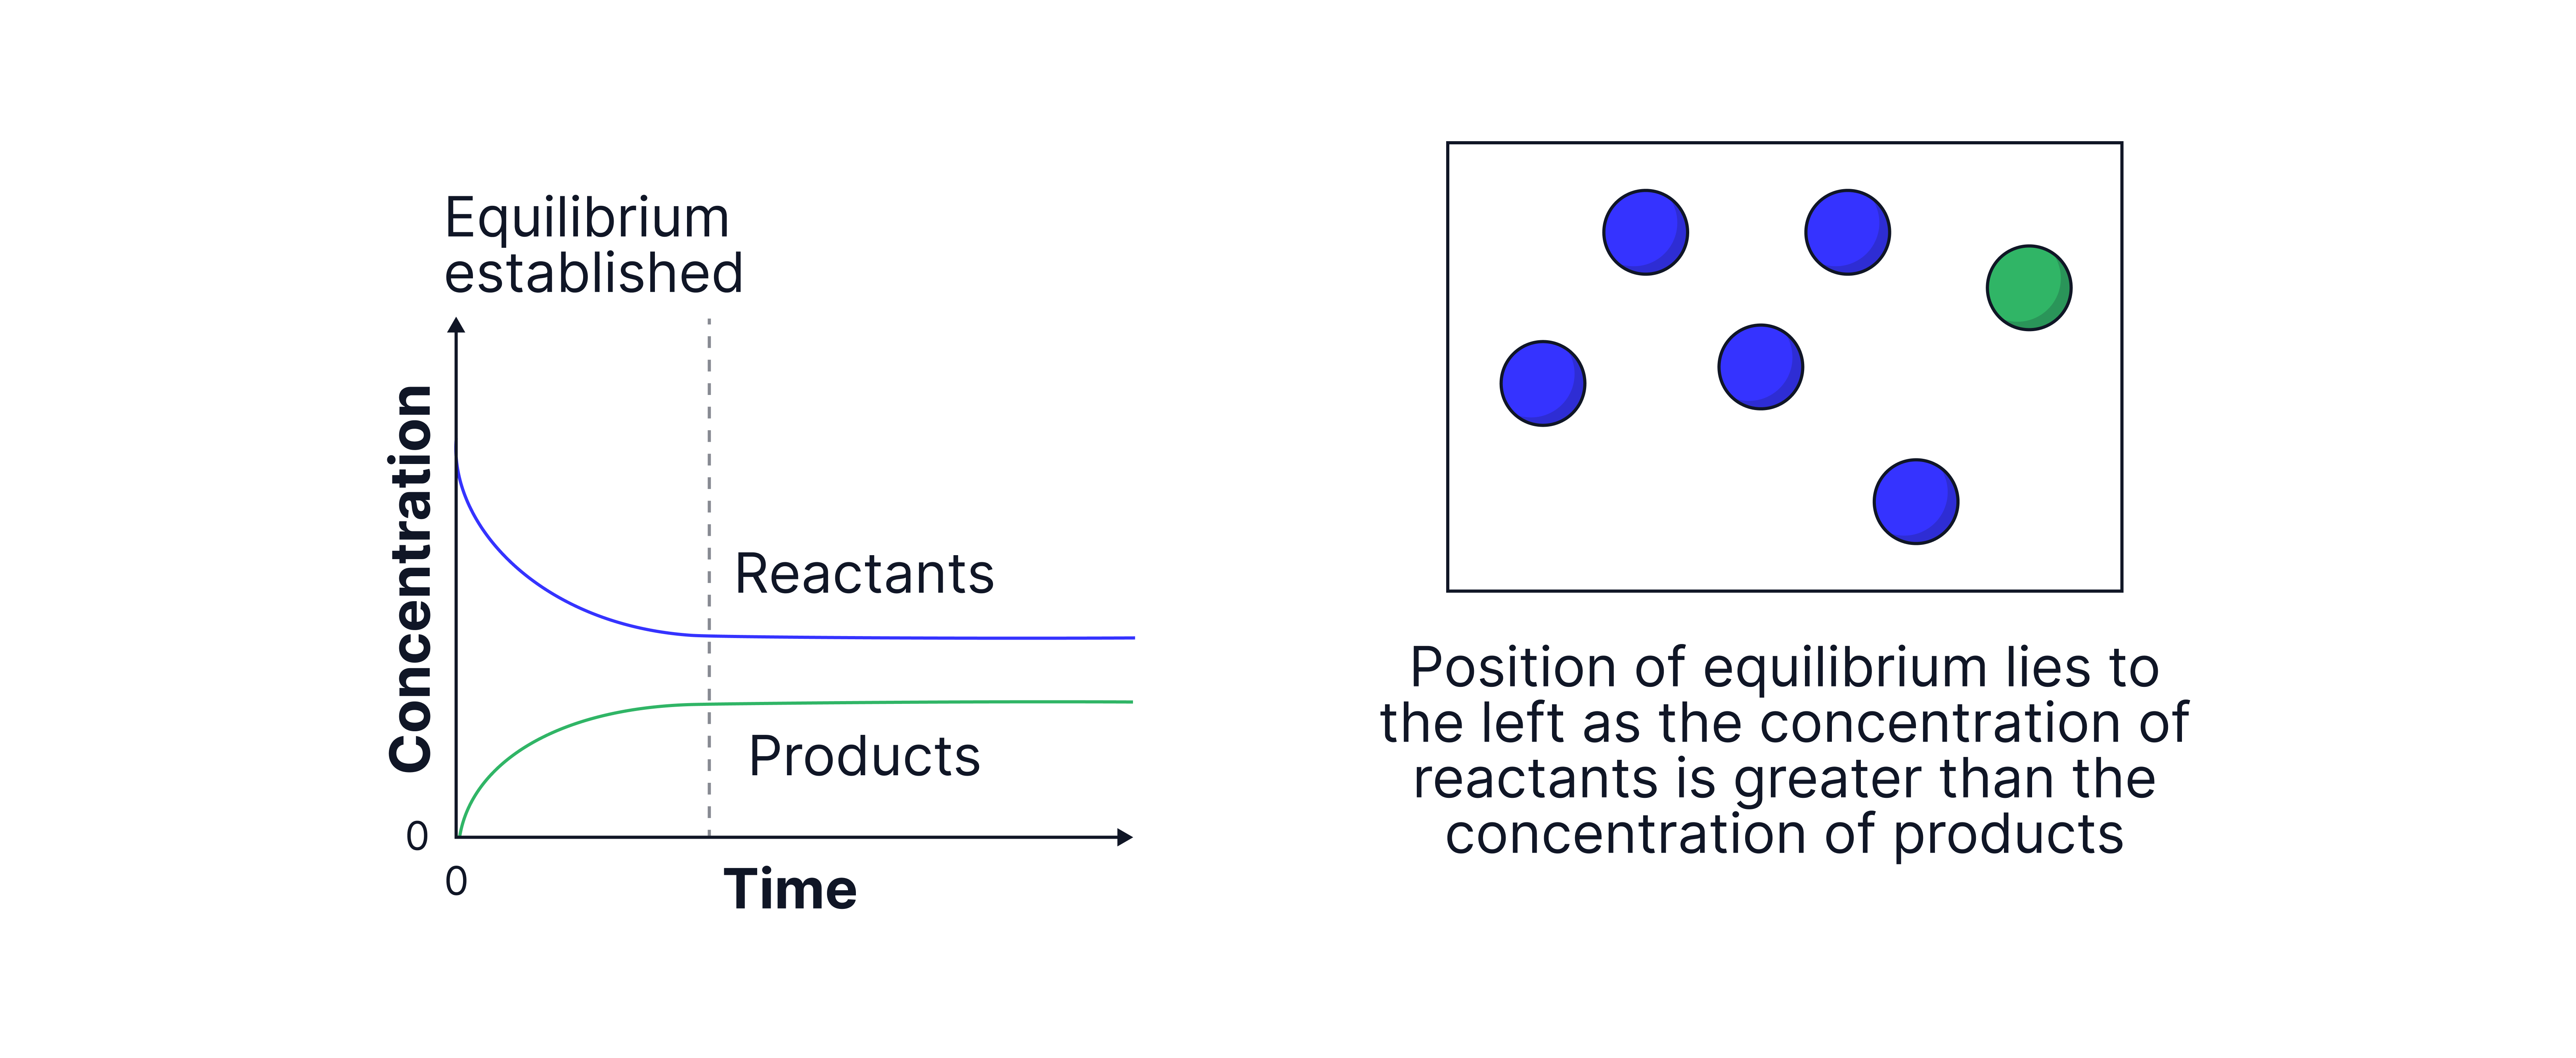
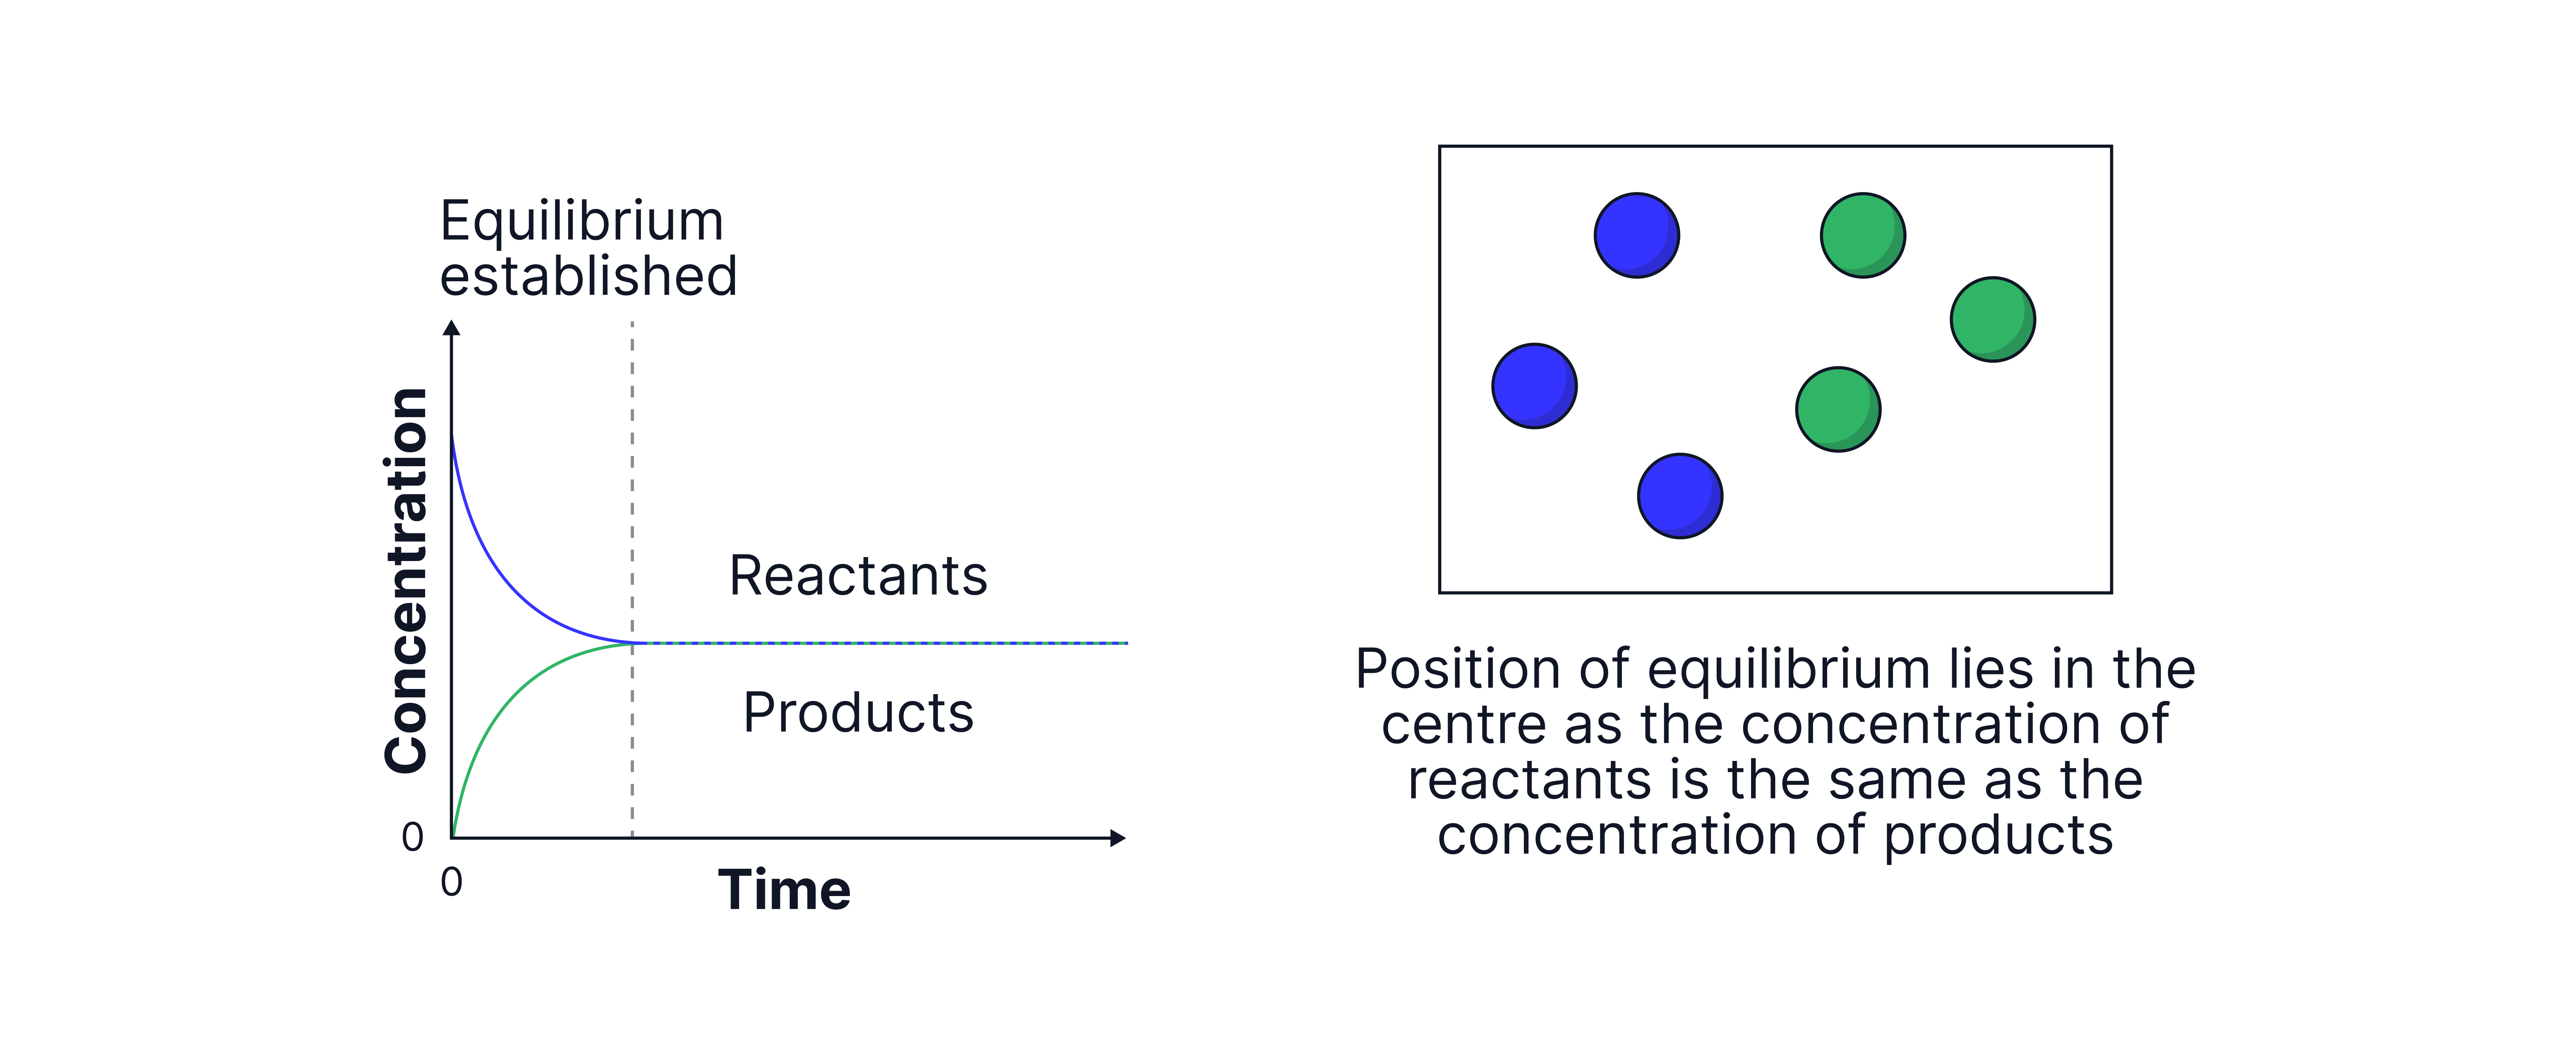
No answer provided.
Question
On the graph below for the reaction between nitrogen and hydrogen,
State the time at which the reaction reaches dynamic equilibrium.
Justify your choice
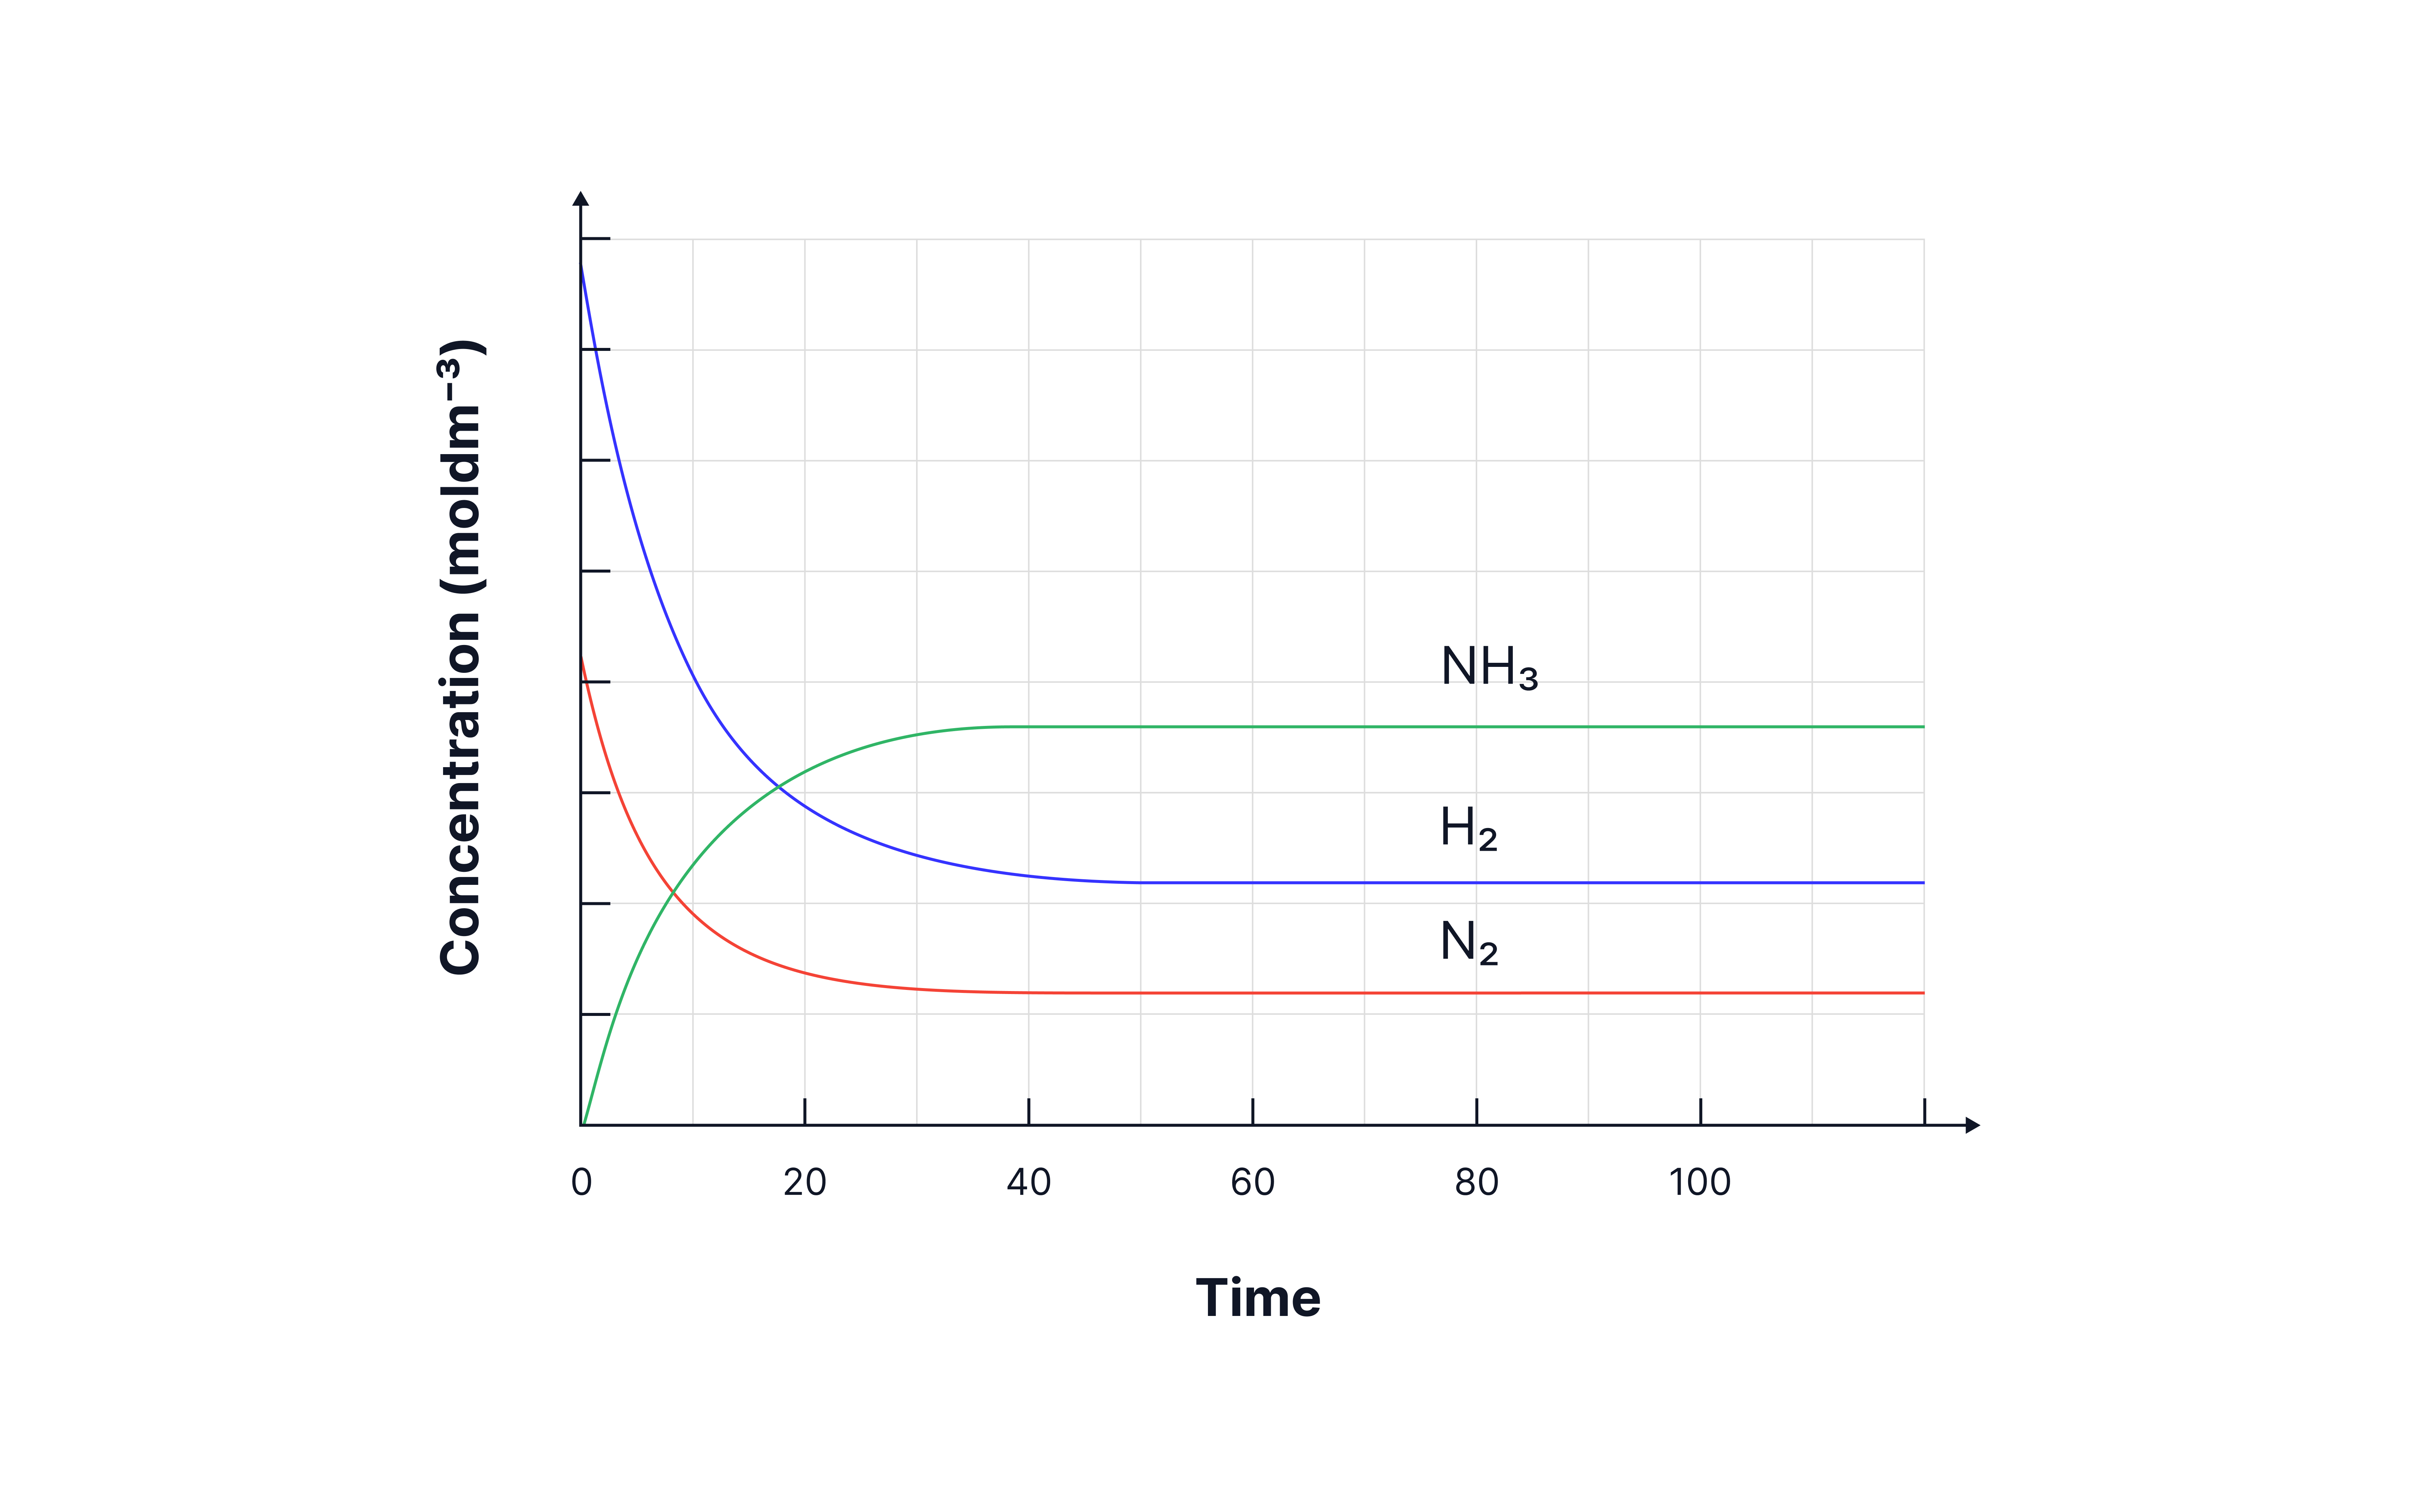
(Approximately) 40 seconds.
There is no net change in the concentrations of the reactants and products (concentrations remain constant).