Continuous Monitoring Methods
Lajoy Tucker
Teacher

Contents
Introduction to Continuous Monitoring Methods
The rate of reaction describes how quickly the concentration of a substance changes over time.
Definition:
The rate of a chemical reaction is the change in concentration of a reactant or product per unit time.
Standard unit:
Continuous monitoring methods are used in experiments to measure the concentration of a reactant or product over time. Data is collected throughout the reaction at regular intervals which allows for the determination of reaction rates and reaction order.
The quantity measured over time depends on the identities of reactants and products. These methods are covered in more detail in the ‘Monitoring Reaction Rates’ note
The following quantities can be measured at regular time intervals
Volume of gas:
A gas syringe is used to collect gas produced throughout a reaction. The graduations on the gas syringe show you how much gas has been produced over time.
e.g.
Decrease in mass:
Used when a gas escapes from an open system (no stopper on the beaker). The reaction can be done on a mass balance to measure mass constantly, or placed onto the balance periodically to measure mass at certain points during the reaction.
e.g.
Continuous Monitoring of Rates Explainer Video
Colorimetry:
For coloured solutions, the absorbance is directly proportional to its concentration. This can be measured using a colorimeter.
e.g.
Colorimetry can also be used where a precipitate is formed. As the cloudiness (turbidity) increases, the absorbance also increases.
pH:
pH can be monitored when a reaction involves a change in or concentration. This can be done quantitatively, using a pH probe/meter.
e.g.
(Decrease in pH as used up)
Electrical conductivity:
Commonly used in ionic reactions where ion concentration changes. Conductivity decreases as the ion concentration does.
e.g.
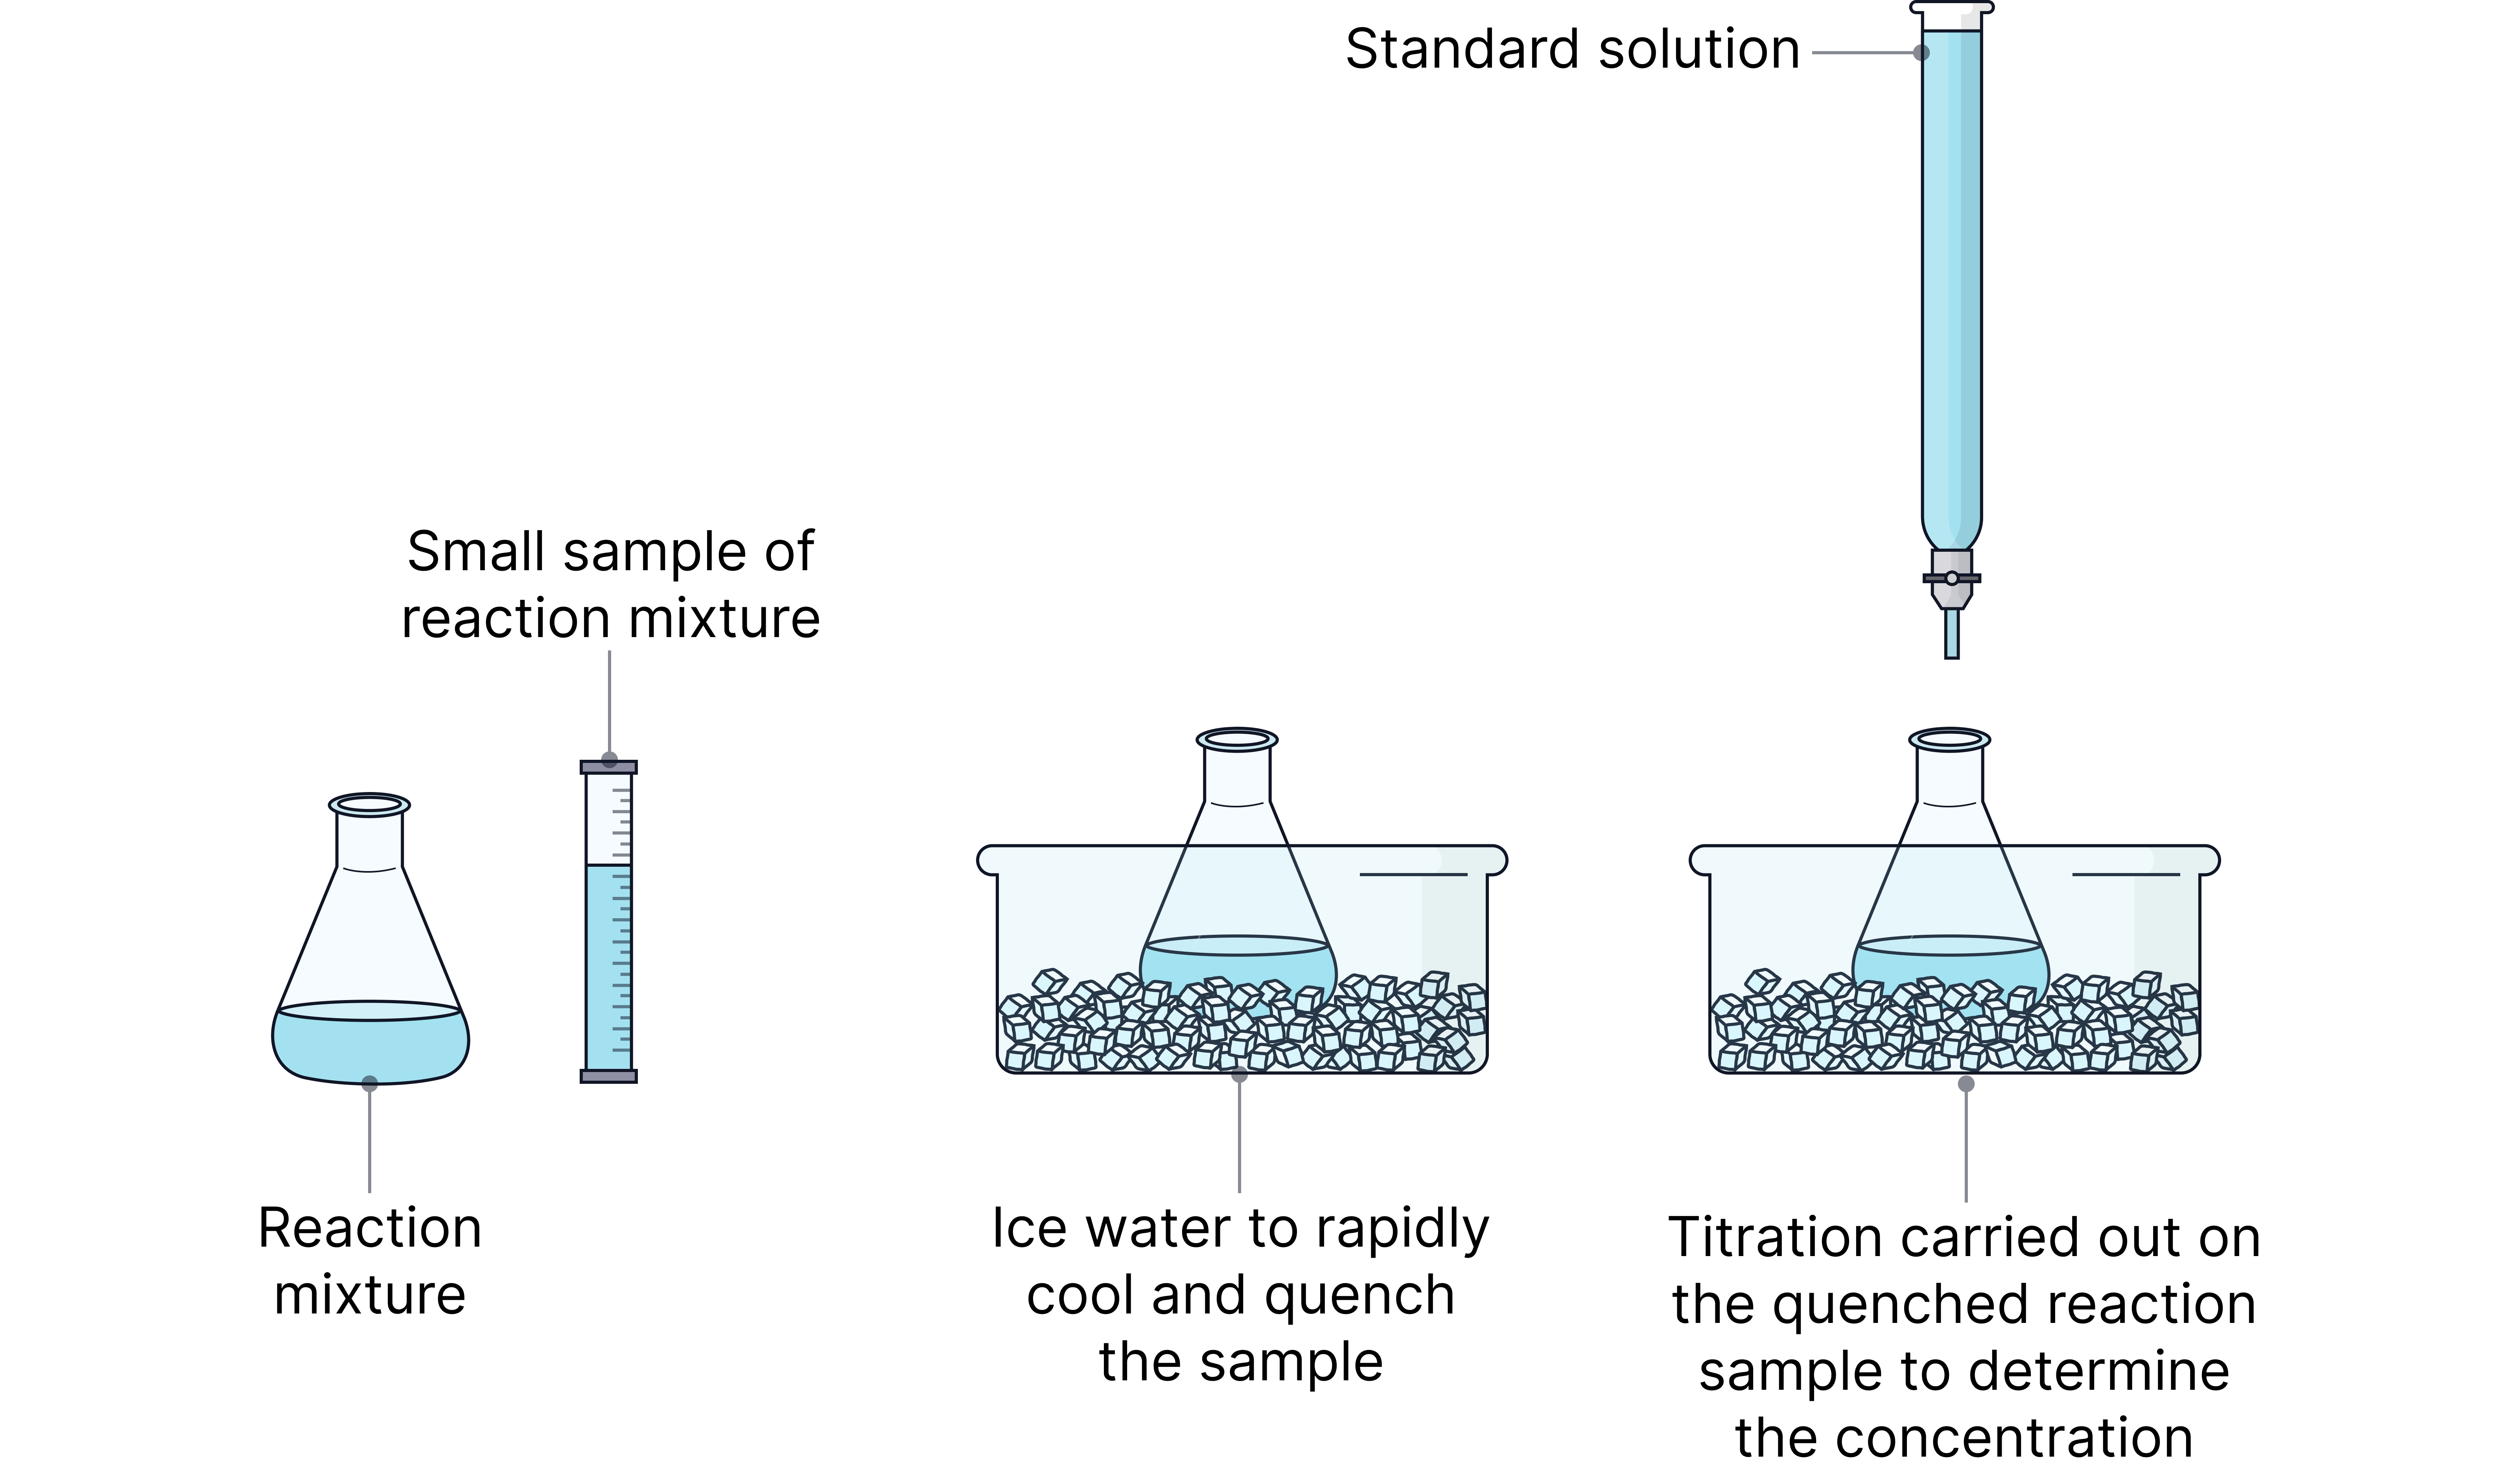
Titrimetric method (Concentration over time)
The concentration of a reactant or product at regular time intervals can be monitored directly by carrying out titrations.
At regular intervals, a small sample of the reaction mixture is removed from the reaction vessel and quenched.
Quenching stops the reaction from progressing (or at least significantly slows it down) allowing the concentration at the desired time to be determined by titration.
A reaction is quenched by:
Rapid cooling - decreasing the temperature slows the reaction significantly.
Dilution - significantly decreasing the concentration decrease the frequency of successful collisions.
Adding a reagent that reacts with a catalyst (e.g. add sodium carbonate if there is an acid catalyst) – removing the catalyst significantly slows the reaction down.
Determining reaction orders
Concentration-time graphs
A + B C
To determine the order with respect to [A], the concentration of B in the experiment must be in a large excess so that its concentrations does not change significantly while the reaction progresses.
This makes the order effectively zero with respect to [B] and any effect on the rate will be due to the concentration of A only.
A concentration-time graph can then suggest the order.
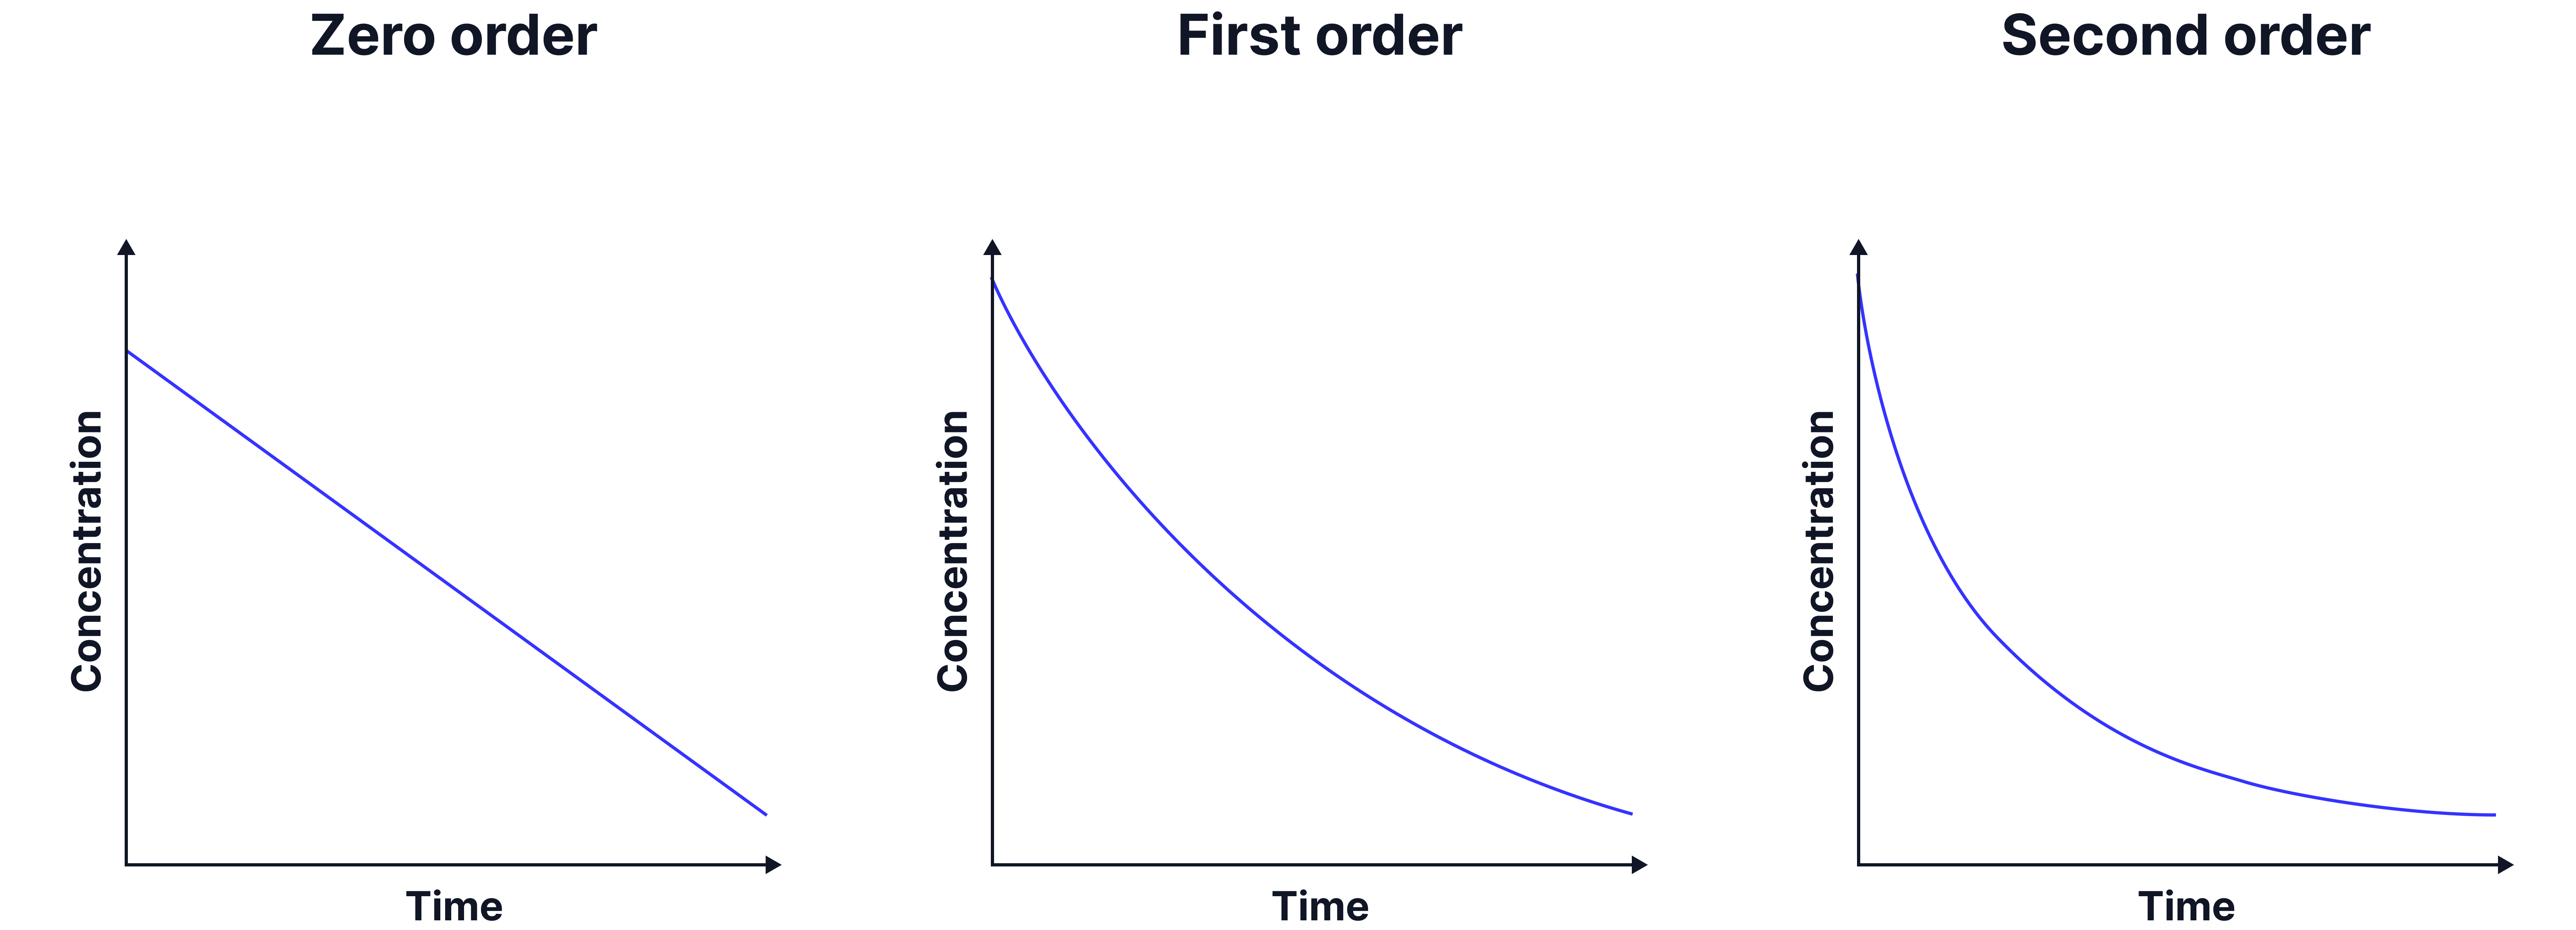
If zero order, a line with a constant negative gradient is the result as the rate is independent of the concentration of the species.
The AQA specification does not expect analysis of first order vs second order concentration-time graphs, therefore the next method is typically more appropriate.
Initial rates (tangents)
To determine the order with respect to a particular species, the experiments can be repeated using different concentrations of this species while keeping all other concentrations constant.
The initial rates at each concentration can be determined by drawing tangents at t = 0 and calculating the gradients.
The relationship between initial rate and concentration indicates the order.
e.g. Determine the order with respect to in the reaction below
Monitor volume of gas over time at three different concentrations of HCl

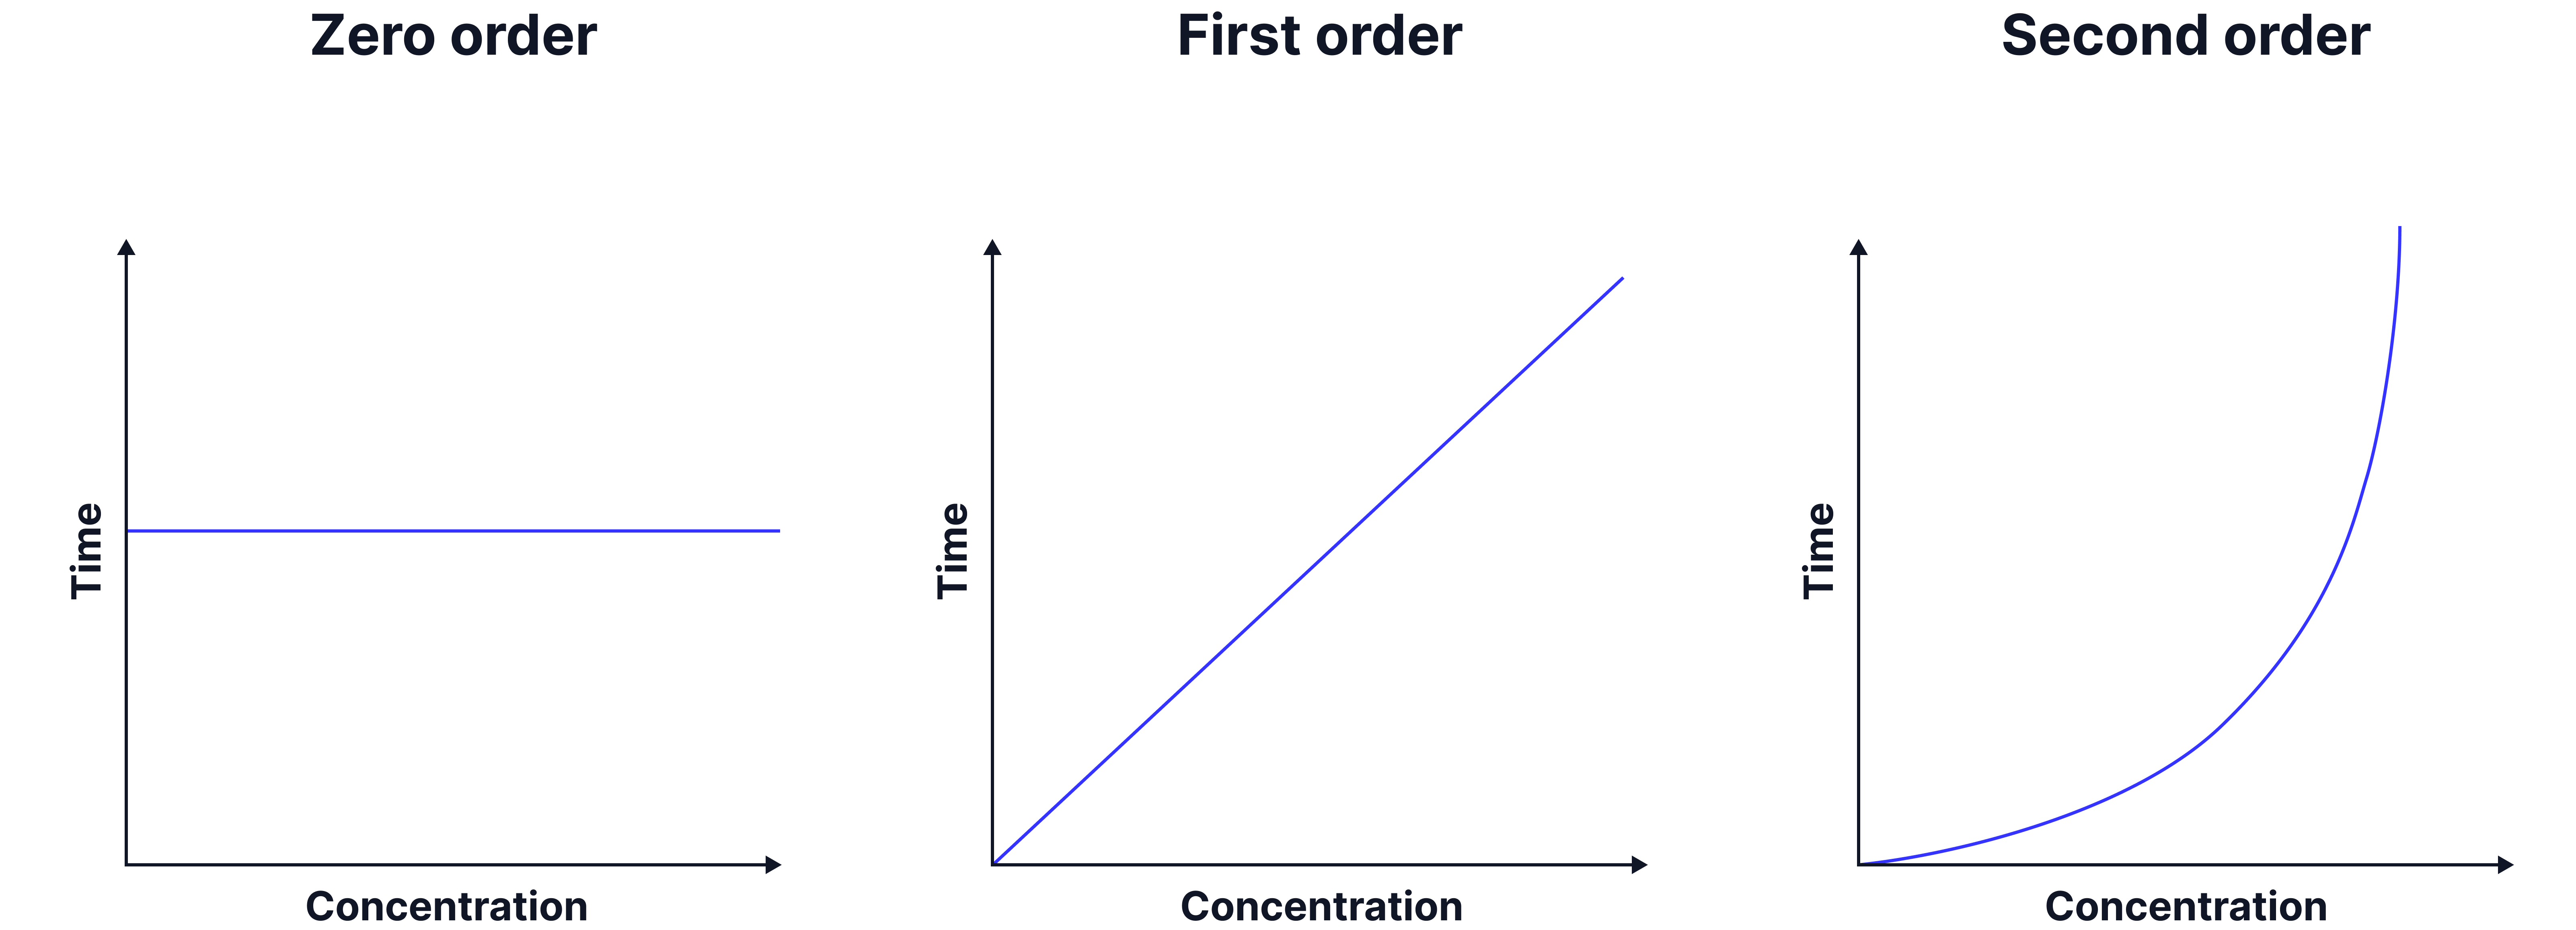
A second graph of initial rate (y) against concentration (x) can then be plotted to determine the order
The shape of the graph indicates the order.
Practice Questions
Question 1
The reaction between sodium thiosulfate and hydrochloric acid produces a yellow precipitate of sulfur. Which continuous monitoring method is most appropriate?
a) Gas syringe
b) Mass loss
c) Colorimetry
d) Conductivity
Answer
c) Colorimetry (as the solution turns cloudy over time).
Question 2
A student monitors the rate of reaction between hydrogen peroxide and potassium iodide. They measure the absorbance of the solution every 10 seconds.
Outline how the students could determine the order of the reaction with respect to hydrogen peroxide.
Answer
Repeat with different concentrations of hydrogen peroxide
Keeping the concentration of potassium iodide constant
Plot graphs of absorbance (y) against time (x) for each concentration of hydrogen peroxide
Draw tangents at t=0 for each curve and calculate their gradients to determine the initial rate at each concentration
Plot a second graph of initial rate (y) against concentration of hydrogen peroxide (y)
Deduce order from the shape of the graph.