Initial Rates Method - Clock Reactions
Dr. Davinder Bhachu
Teacher

Contents
Introduction to the Initial Rates Method
The initial rates method is used to determine the order of reaction with respect to a reactant.
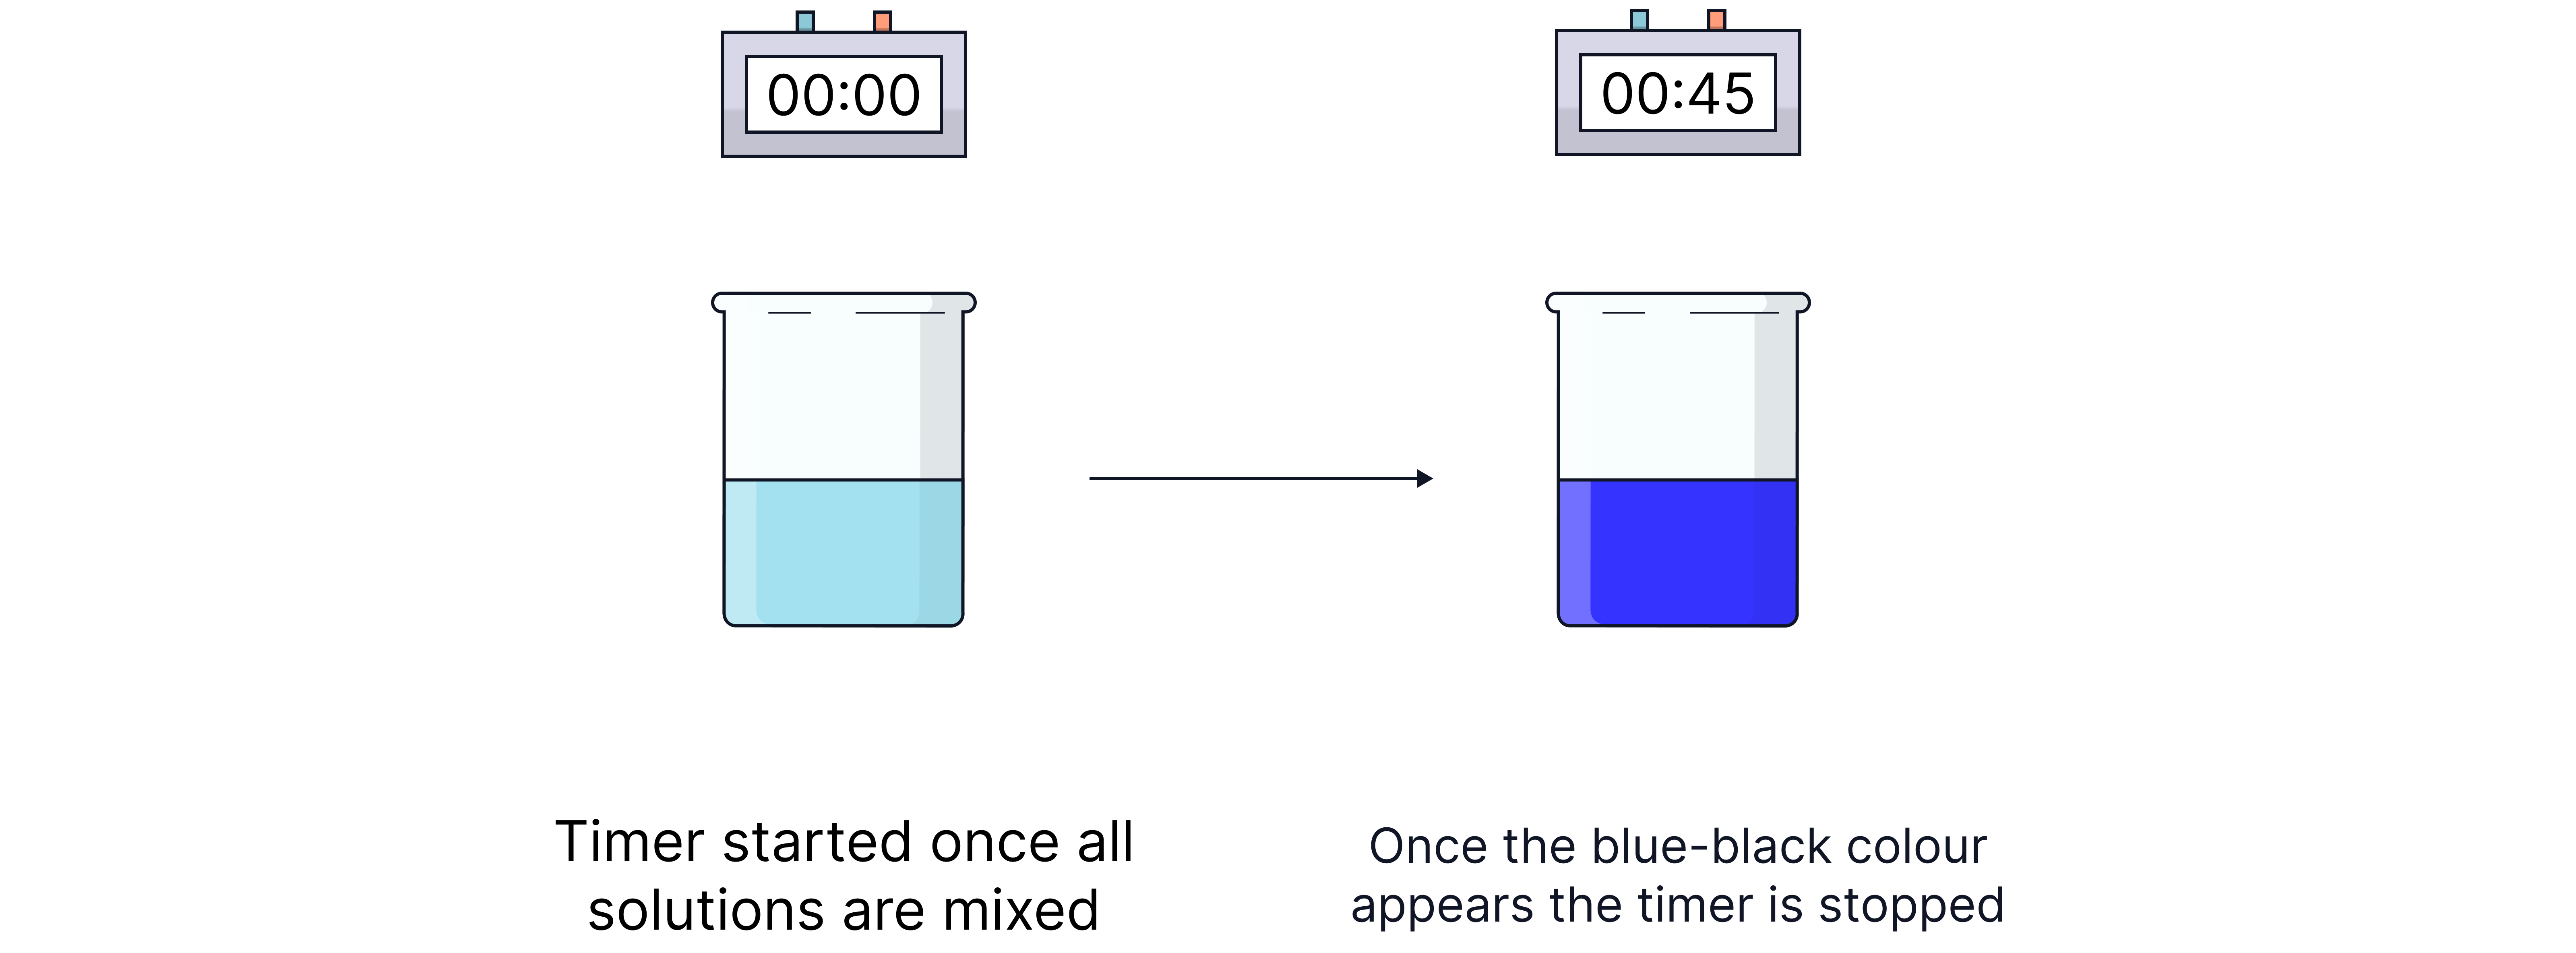
The clock reaction is a practical way to measure the initial rate by timing how long it takes for a sudden visible change to occur.
The iodine clock reaction is commonly used, where a fixed amount of thiosulfate and starch are added to a reaction mixture.
When all the thiosulfate is consumed, iodine () reacts with starch to form a blue-black complex, indicating the reaction has reached a specific point.
Iodine Clock Reaction - Key Reactions
Step 1: Formation of Iodine
Hydrogen peroxide reacts with iodide ions:
Step 2: Reaction with Sodium Thiosulfate
Initially, iodine is reduced back to iodide by sodium thiosulfate: This delays the colour change.
Step 3: Starch Complex Formation
Once the thiosulfate is exhausted, free reacts with starch, forming a blue-black complex.
Determining Reaction Order Using the Initial Rates Method
To determine the order with respect to the concentration of a specific species, the experiment is carried out multiple times using different concentrations of that species while keeping the concentrations of all others constant.
Practical details are covered in the RP7 – Iodine clock note.
To find the order with respect to
1. Measure fixed volumes of hydrogen peroxide, sulfuric acid, potassium iodide, sodium thiosulfate into separate containers
2. Combine all solutions and a few drops of starch, adding the hydrogen peroxide last. Start the timer.
3. Measure the time (t) for the appearance of the blue-black colour
4. The reaction is repeated with different concentrations of iodide while keeping other reactant volumes and concentrations constant.
5. The initial rate is approximated as 1/t
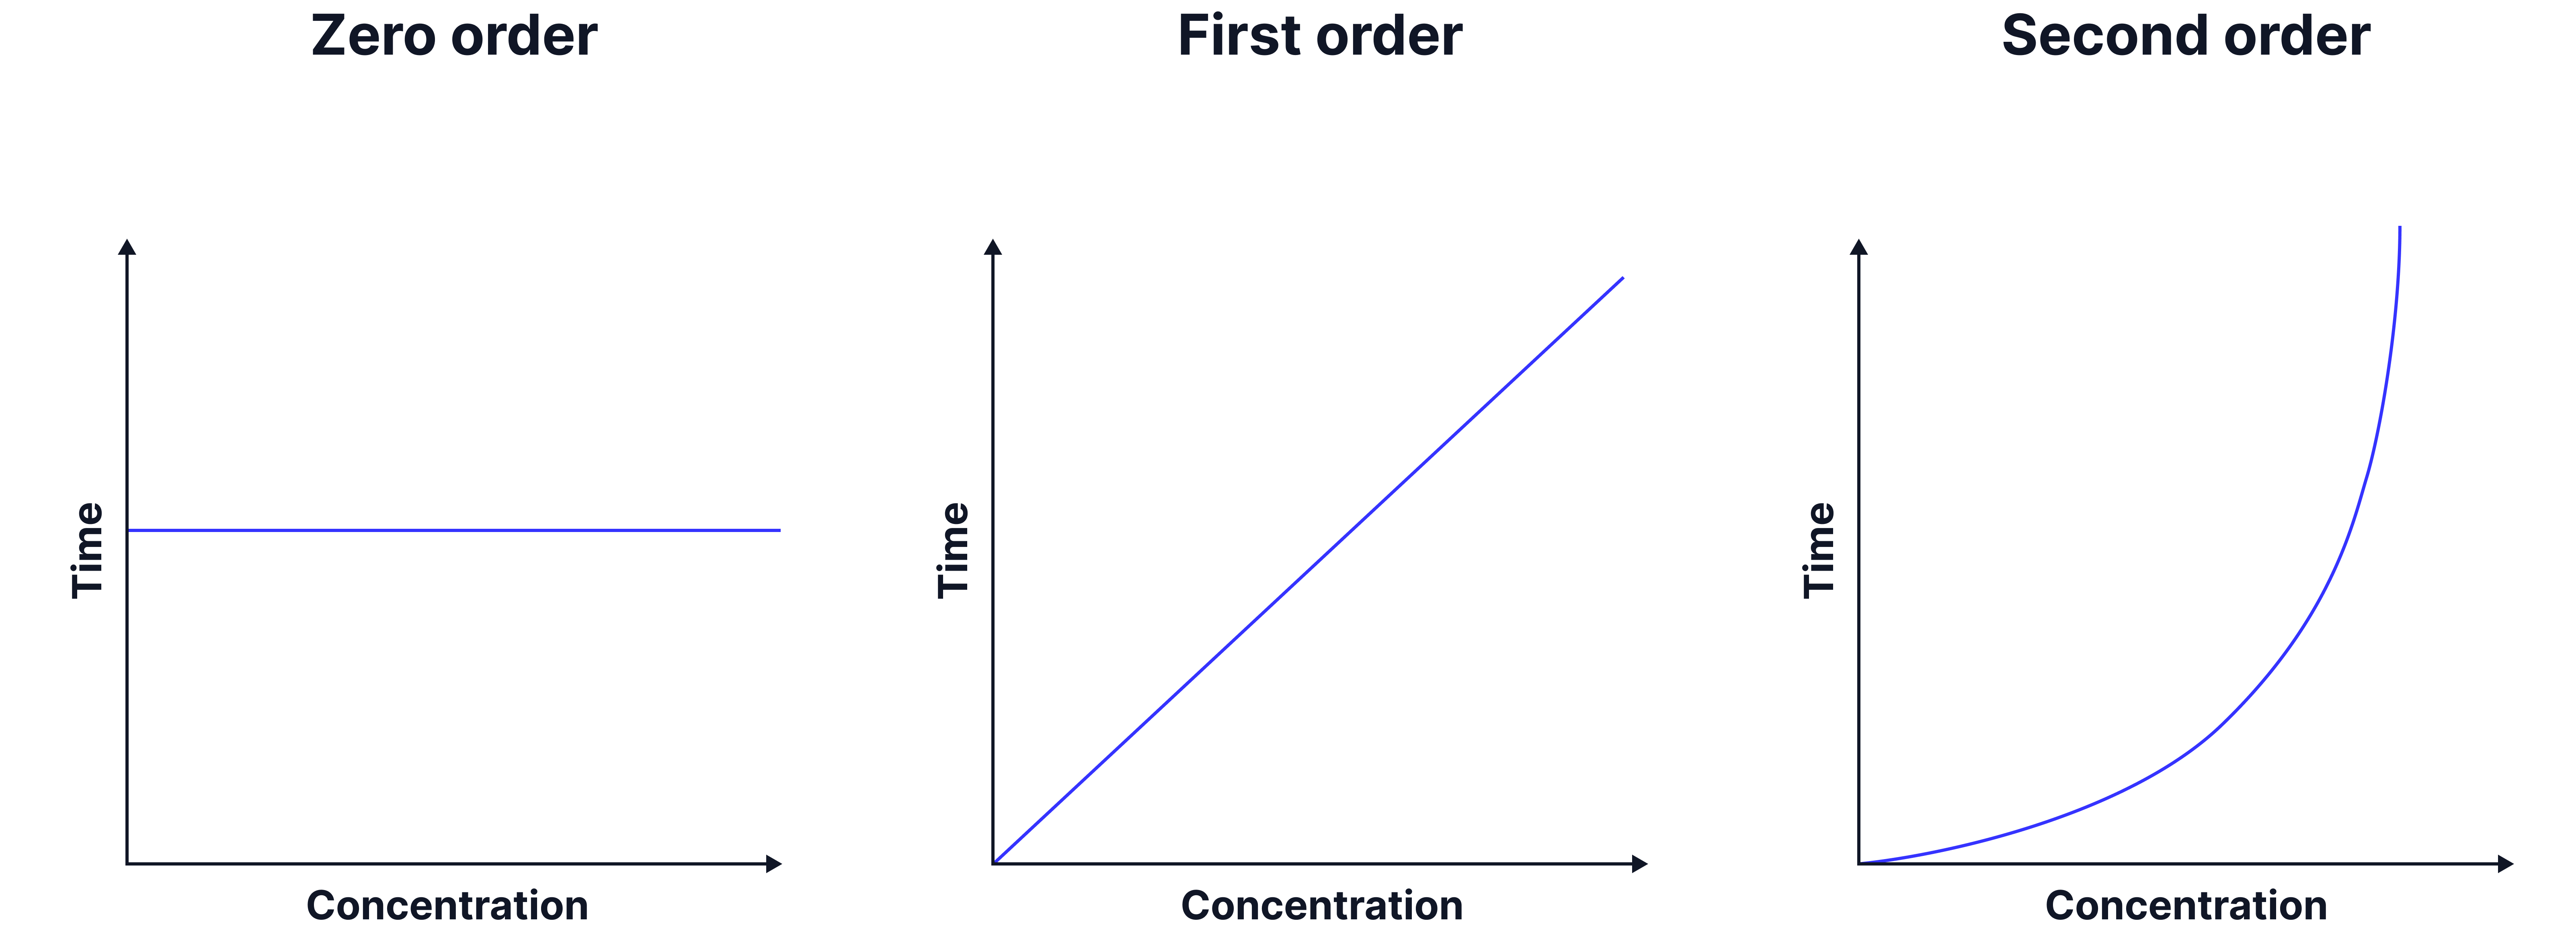
6. A graph of 1/t vs. [I⁻] is plotted to determine the order with respect to I⁻.
Horizontal line → Zero order
Straight line through the origin → First order
Curve of form → Second order
Example Data & Calculation
Example Data for Varying Concentrations
Experiment |
| Time for Color Change | |
![Graph of iodide concentration versus initial rate (1/t) showing a straight-line relationship through the origin, indicating first-order dependence on [I⁻].](https://cdn.myedspace.co.uk/images/60045e71-e66b-47b3-8ded-5af643c5d485.png)
Determining the Order of Reaction
The shape of the graph above (straight line through the origin) indicates a first order relationship.
The order could also be determined directly from the data, when [I⁻] doubles , 1/t doubles .
Since the initial rate is proportional to [I⁻], the reaction is first order with respect to I⁻.
Initial Rates Clock Reactions Questions
Key Tips and Reminders
The iodine clock reaction is a useful method for determining reaction order via initial rates.
By analysing how 1/t changes with concentration, we can establish the reaction order efficiently.
Exam Tip: Ensure that temperature and volumes of other reactants remain constant to get accurate results!
No answer provided.