Infrared Spectroscopy
Lajoy Tucker
Teacher

Contents
Introduction to Electromagnetic Radiation and Molecular Interactions
Atoms, molecules and ions can absorb or emit electromagnetic radiation of specific frequencies, which can be used to identify chemical species:
|
Radiation Type |
Energy Effect |
Spectroscopy Type |
A-Level Coverage |
|
Radio waves |
Nuclear spin changes |
NMR spectroscopy |
✓ Studied |
|
Microwaves |
Molecular rotation |
Microwave spectroscopy |
✗ Not studied |
|
Infrared |
Bond vibrations |
IR spectroscopy |
✓ Studied |
|
UV/Visible |
Electronic transitions |
UV/Vis spectroscopy |
✗ Not studied |
Fundamental Principles of IR Spectroscopy
What Causes IR Absorption?
Bond vibrations occur when IR radiation provides energy to make chemical bonds:
Stretch: Bonds extend and contract along their axis.
Bend: Bond angles change (less important for A-level).
Why Different Bonds Absorb at Different Frequencies?
The absorption frequency depends on:
Bond strength: Stronger bonds vibrate at higher frequencies.
Atomic mass: Lighter atoms vibrate at higher frequencies.
Key relationship: Strong, light bonds (like O-H, N-H) absorb at high wavenumbers (~3000-3500 cm⁻¹). Heavy, weaker bonds (like C-C) absorb at lower wavenumbers (~1000-1500 cm⁻¹)
The IR Spectrum
X-axis: Wavenumber (cm⁻¹) - ranging from 4000 to 400 cm⁻¹
Y-axis: Transmittance (%) - shows how much light passes through
Peaks point downward: Where transmittance drops, absorption occurs
Analysis range: 4000-400 cm⁻¹, but we focus on 4000-1500 cm⁻¹


Spectrum Regions
Functional Group Region (4000-1500 cm⁻¹)
Used to identify functional groups
Most characteristic absorptions occur here
Focus of A-level analysis
Fingerprint Region (1500-400 cm⁻¹)
Unique for every compound (like a fingerprint)
Complex pattern of C-C, C-O, and bending vibrations
Used to distinguish between isomers
Not analysed in detail at A-level
Key Functional Group Absorptions
Functional Group | Bond Type | Wavenumber Range (cm⁻¹) | Peak Description | Key Features |
Alcohol | O-H | 3200-3550 | Broad, strong | Hydrogen bonding causes broadening |
Carboxylic Acid | O-H | 2500-3300 | Very broad, strong | Overlaps with C-H region |
C=O | ~1700 | Sharp, strong | Lower than ketone due to resonance | |
Ketone | C=O | 1705-1725 | Sharp, strong | No resonance, higher frequency |
Aldehyde | C=O | 1720-1740 | Sharp, strong | Slightly higher than ketone |
C-H | 2720-2820 | Weak | Two peaks characteristic | |
Ester | C=O | 1735-1750 | Sharp, strong | Higher than ketone/aldehyde |
Primary Amine | N-H | 3300-3500 | Sharp, medium | Two peaks (asymmetric/symmetric) |
Secondary Amine | N-H | 3300-3500 | Sharp, medium | One peak only |
Amide | N-H | 3300-3500 | Medium | Often with C=O at ~1650 |
C=O | 1630-1680 | Strong | Lower due to resonance | |
Nitrile | C≡N | 2200-2260 | Sharp, variable | Triple bond characteristic |
Alkene | C=C | 1620-1680 | Sharp, variable | Often weak intensity |
Aromatic | C=C | 1450-1600 | Sharp, medium | Multiple peaks |
Alkane | C-H | 2850-3100 | Multiple, medium | Saturated C-H stretches |
No answer provided.
Worked Examples
Example 1: Determine the structure (from given options) from the IR spectrum
Given options: Propanoic acid, butanone, 2-methylbut-2-ene, 1-hydroxypropanone, butan-2-ol
Analysis:
1. Very broad O-H stretch (2500-3300 cm⁻¹): Indicates carboxylic acid.
2. Sharp C=O at ~1700 cm⁻¹: Confirms carbonyl group.
3. Combination: Only propanoic acid has both features.
Answer:
Propanoic acid.
Example 2: Determine the structure (from given options) from the IR spectrum
Given options: Propanoic acid, butanone, 2-methylbut-2-ene, 1-hydroxypropanone, butan-2-ol
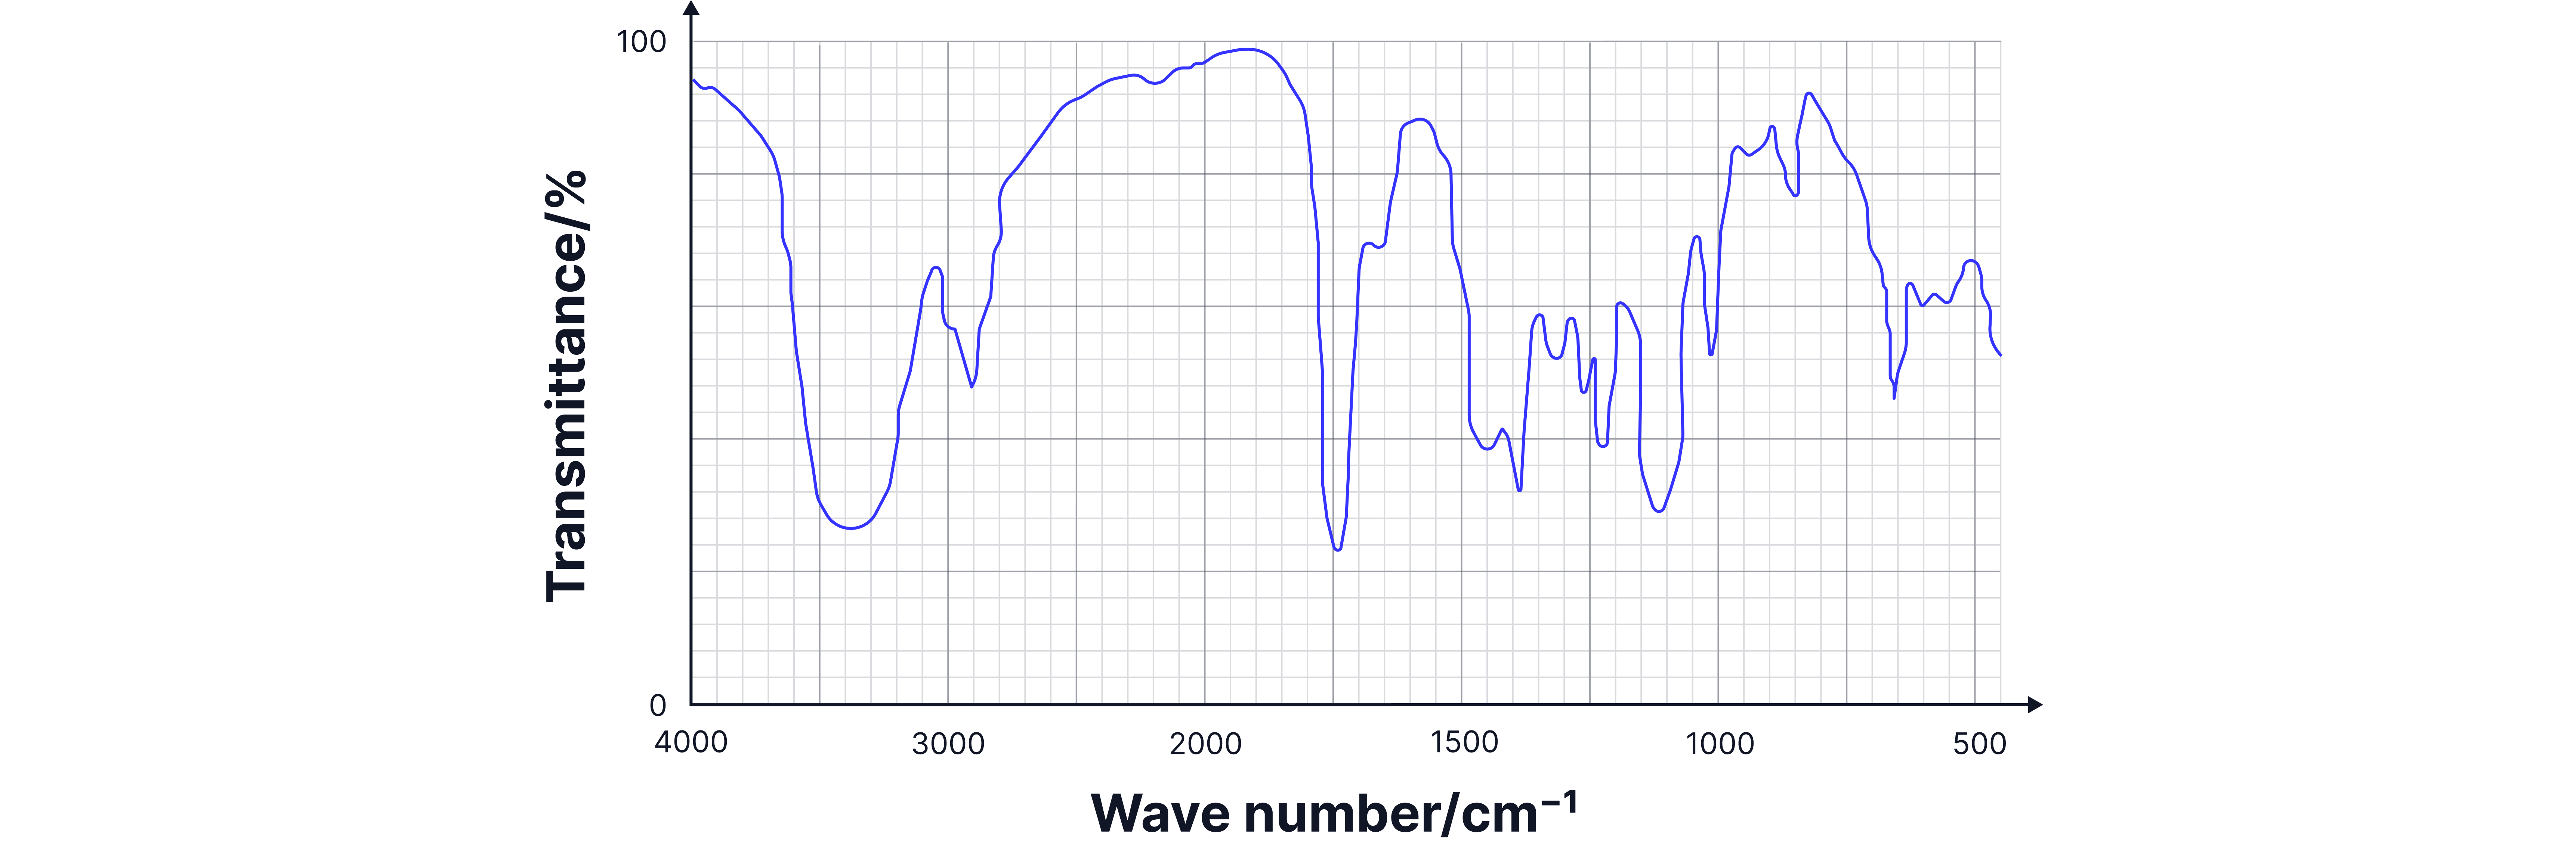
Analysis:
1. Broad O-H (3200-3500 cm⁻¹): Alcohol group present.
2. Sharp C=O (~1715 cm⁻¹): Ketone group present.
3. Both present: Only 1-hydroxypropanone has both alcohol and ketone.
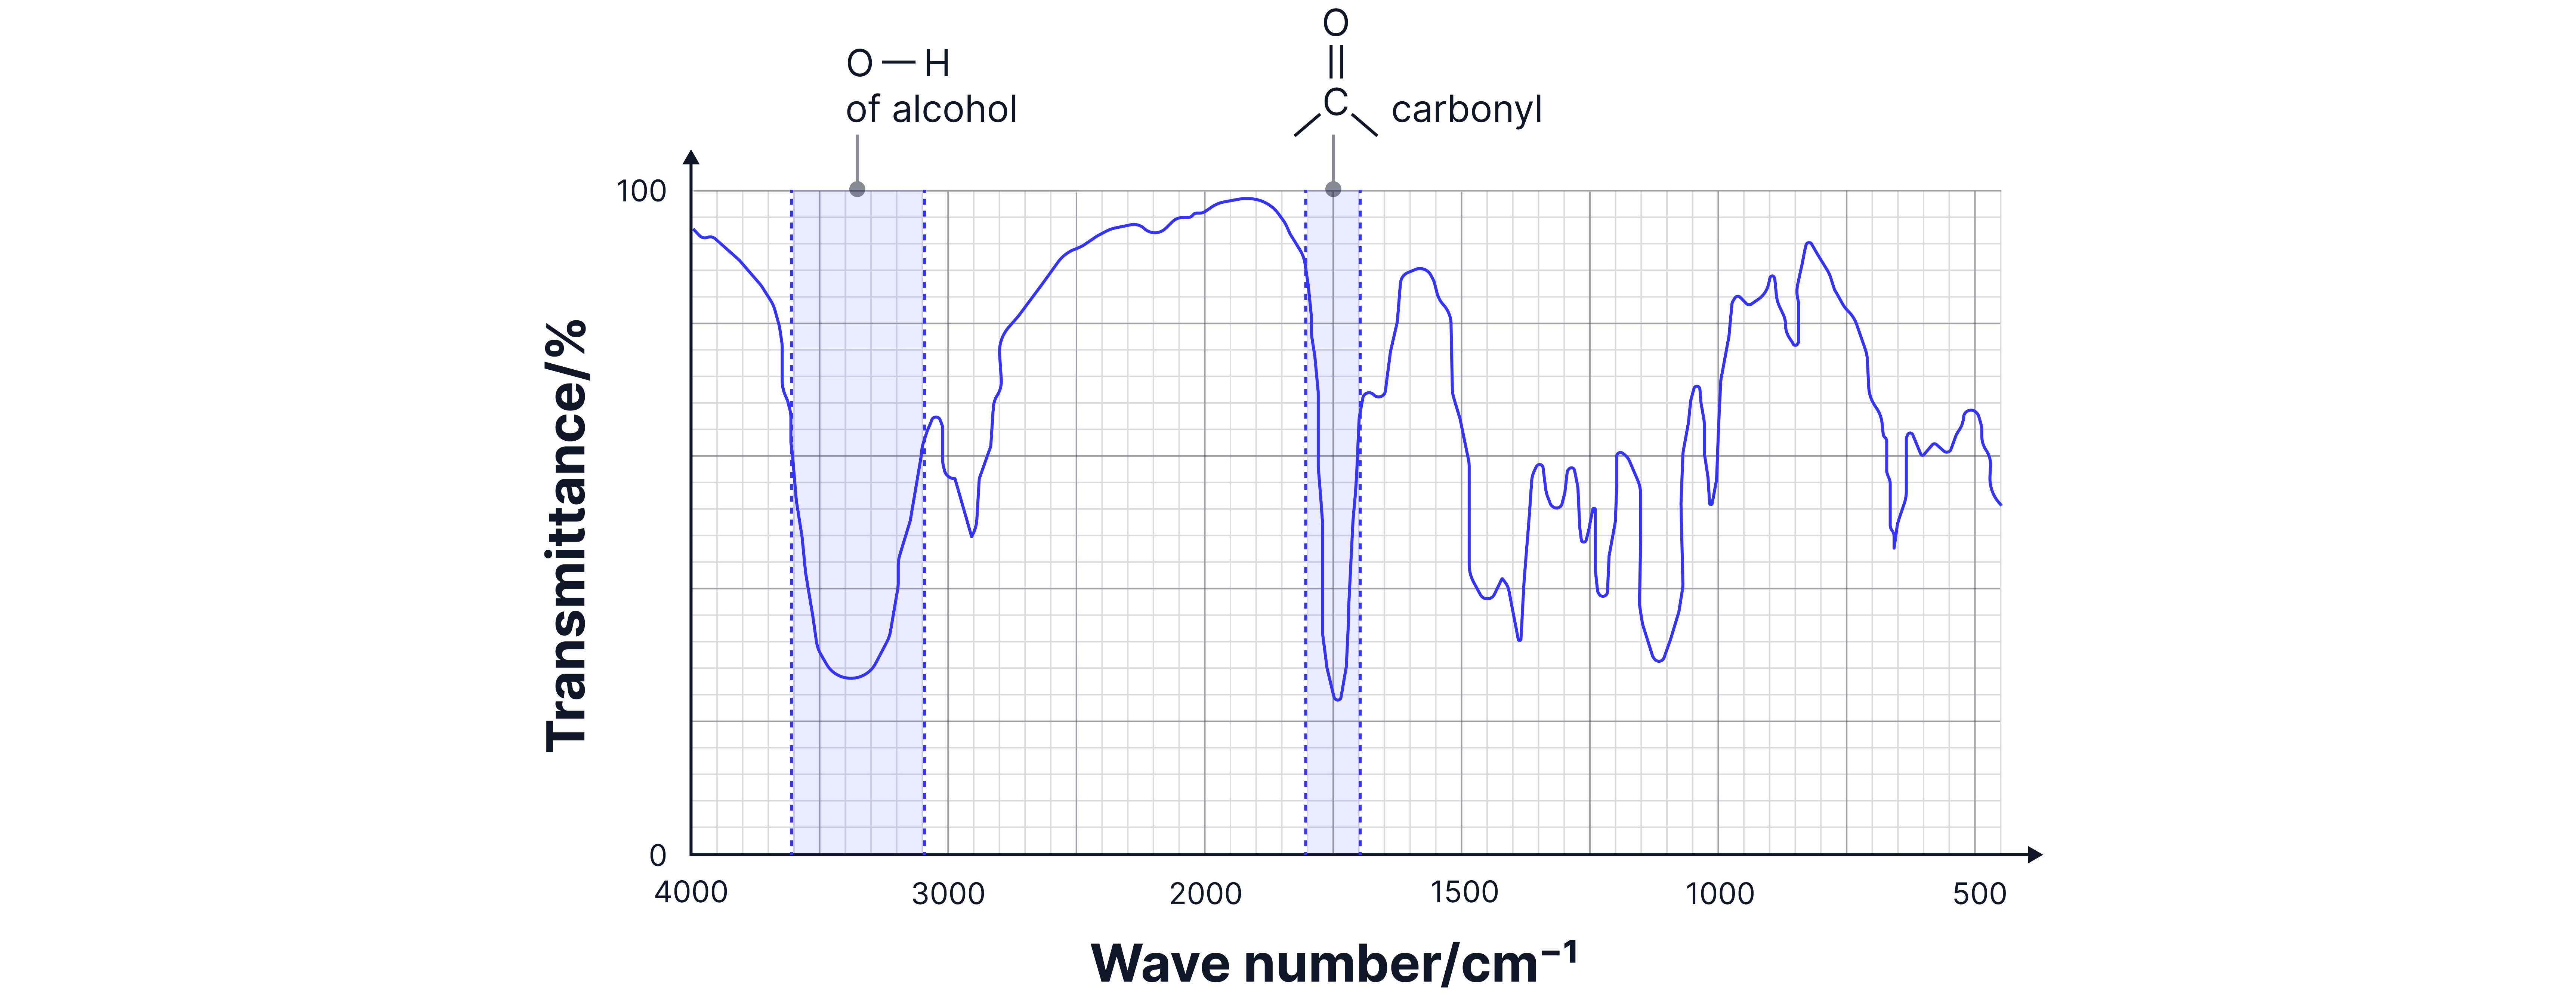
Answer:
1-hydroxypropanone
Practice Questions
Question 1
An IR spectrum shows a sharp peak at 2250 cm⁻¹. Which functional group is most likely present?
Answer:
Nitrile (C≡N) Explanation: The 2200-2260 cm⁻¹ region is characteristic of triple bonds, specifically C≡N stretches.
Question 2
Two isomeric compounds C₃H₈O give identical spectra in the functional group region but different fingerprint regions. Explain this observation.
Answer:
Both compounds have the same functional group (alcohol O-H stretch) but different structural arrangements. The fingerprint region is unique to each compound's exact structure, allowing distinction between isomers like propan-1-ol and propan-2-ol.
Common Student Mistakes and How to Avoid Them
Mistake 1: Confusing Alcohol and Carboxylic Acid O-H
Error: Calling any broad O-H peak an alcohol
Solution:
Alcohol O-H: 3200-3550 cm⁻¹, no C=O
Acid O-H: 2500-3300 cm⁻¹ (very broad), always with C=O at ~1700 cm⁻¹
Mistake 2: Missing Water Contamination
Error: Identifying O-H peaks that are actually from water in the sample
Solution: Water gives a broad peak around 3300 cm⁻¹ - consider if this makes chemical sense.
Mistake 3: Ignoring Peak Absence
Error: Only looking at present peaks Solution: Always consider what's missing - absence of C=O rules out ketones, aldehydes, acids, etc
Mistake 4: Incorrect Wavenumber Reading
Error: Misreading the scale on the spectrum Solution: Practice reading spectra carefully, noting that scale goes from high to low wavenumbers
Mistake 5: Overlooking Peak Shape
Error: Not considering whether peaks are sharp or broad Solution: Peak shape gives vital information about hydrogen bonding and bond environment
Quick Reference Guide for Exams
High Priority Peaks (Must Know):
O-H alcohol: 3200-3550 cm⁻¹ (broad).
O-H acid: 2500-3300 cm⁻¹ (very broad) + C=O ~1700 cm⁻¹.
C=O ketone: 1705-1725 cm⁻¹ (sharp).
C=O ester: 1735-1750 cm⁻¹ (sharp, high).
C≡N nitrile: 2200-2260 cm⁻¹ (sharp).
Analysis Checklist:
Check for O-H (broad vs very broad).
Look for C=O (position indicates type).
Check for N-H (sharp, 3300-3500 cm⁻¹).
Look for C≡N (distinctive 2200-2260 cm⁻¹).
Consider what's absent.
Use fingerprint region for isomer distinction.
No answer provided.