Sound Intensity
Brook Edgar & Hannah Shuter
Teachers


Contents
Brook Edgar
Physics
Hannah Shuter
Physics
Explainer Video
Sound Intensity and Loudness
Sound intensity is defined as the power per unit area arriving at the ear, measured in .
The threshold intensity is the minimum detectable intensity by the human ear.
At a frequency of , the threshold intensity () is, .
The pain threshold is the maximum sound intensity that the human ear can typically tolerate before pain occurs. For most people, this is approximately, .
The typical human audible range is approximately . However, the ear is not equally sensitive to all frequencies. It is most sensitive to sounds between , so louder intensities are required to hear very low- or very high-frequency sounds.
Relative Intensity & the Decibel Scale
The ear perceives loudness logarithmically. A logarithmic scale is used for two main reasons:
It matches how the human ear perceives loudness, as the ear does not respond linearly to sound intensity. For example, if the sound intensity increases by a factor of 10, we do not perceive the sound as 10 times louder. Instead, it sounds only moderately louder.
It allows the enormous range of audible sound intensities (from ) to be expressed using manageable numbers. A logarithmic scale converts this range into 0 dB to 120 dB, making it much easier to compare sound levels.
Formula:
The units of relative intensity (the intensity of the sound that we perceive) are bels, but decibels () are the most commonly used.
To work out the sound intensity if we were given the intensity level, we would have to apply a logarithmic rule, namely:
For example, if asked to calculate the intensity of a sound at . We manipulate the equation until it looks like the log rule above:
We can now apply the log rule, so the above equation becomes:
Worked Example:
A loud speaker can be thought of as acting as a point source. It plays a sound with a power of . Calculate the intensity of the sound at a point away.
Answer:
The intensity is the power per unit area - however the loudspeaker will produce sound in every direction, so it will roughly spread out in a sphere. Therefore, we need to use the surface area of a sphere as our area in this equation:
Worked Example:
At a concert, the relative sound intensity level is . Calculate the sound intensity and compare it to the pain threshold.
Answer:
We now need to apply our log rule:
So my expression becomes:
The pain threshold is around , so this sound intensity is beneath the pain threshold.
Sensitivity and Equal Loudness Curves
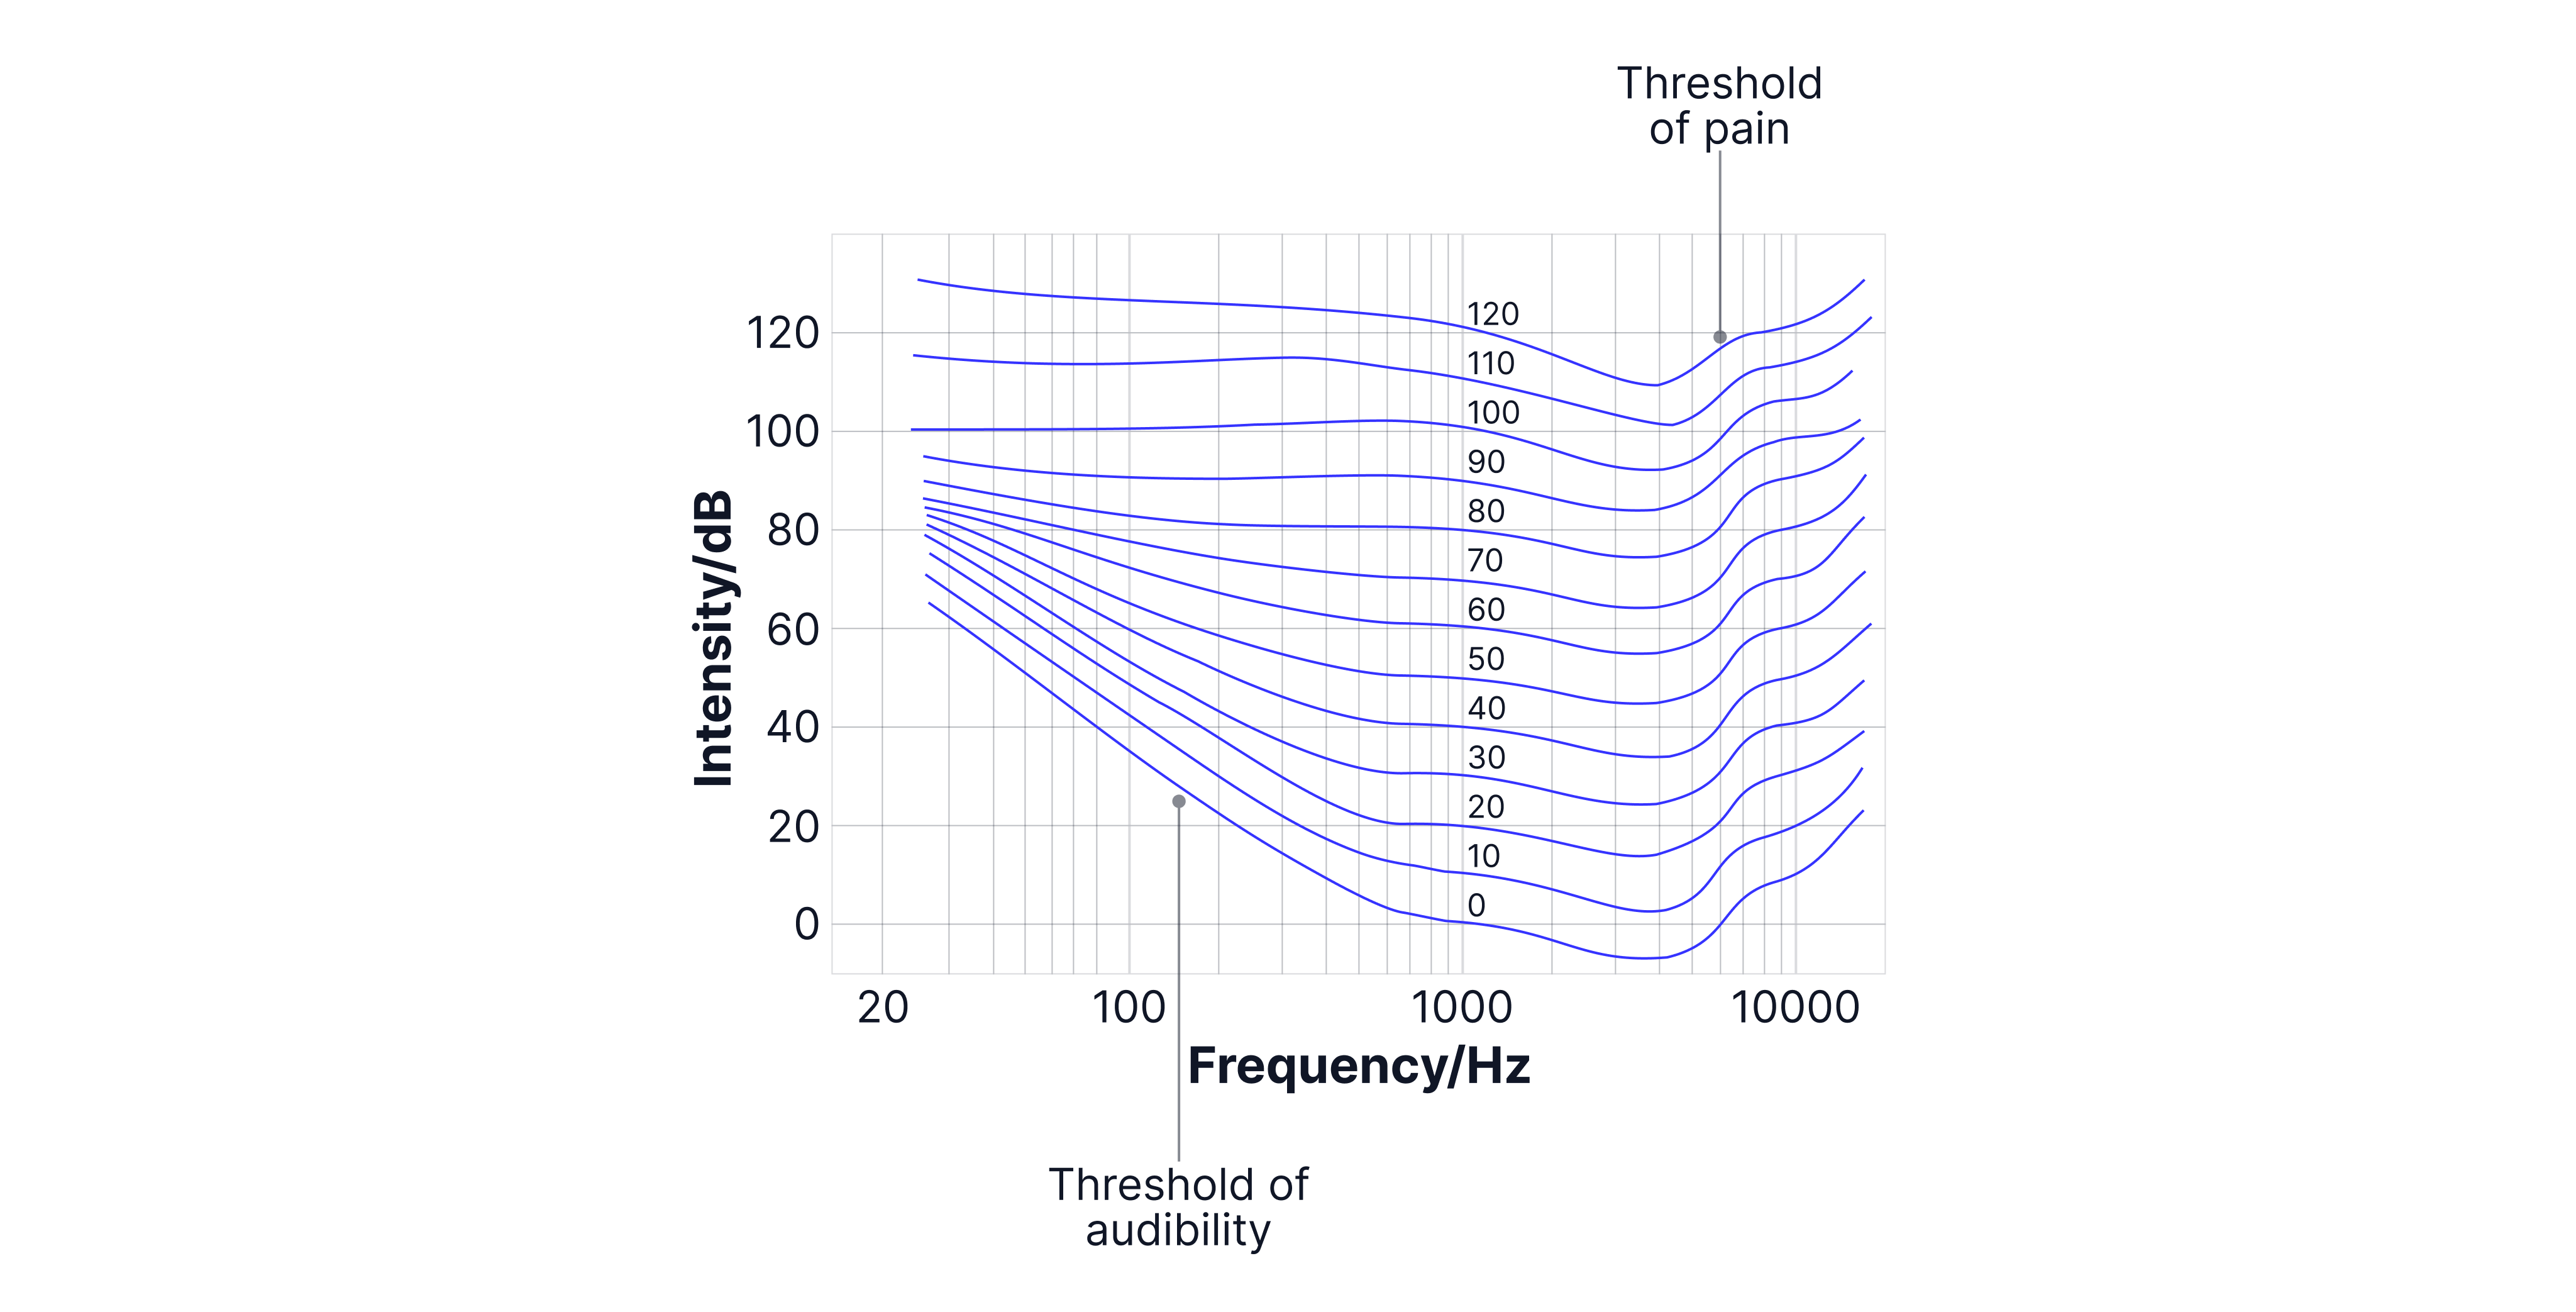
The ear is not equally sensitive at all frequencies. Maximum sensitivity occurs between and , with peak sensitivity occurring at . As the ear is not equally sensitive to all frequencies, higher intensities are required to hear very low- or very high-frequency sounds at the same loudness. We can see this below.
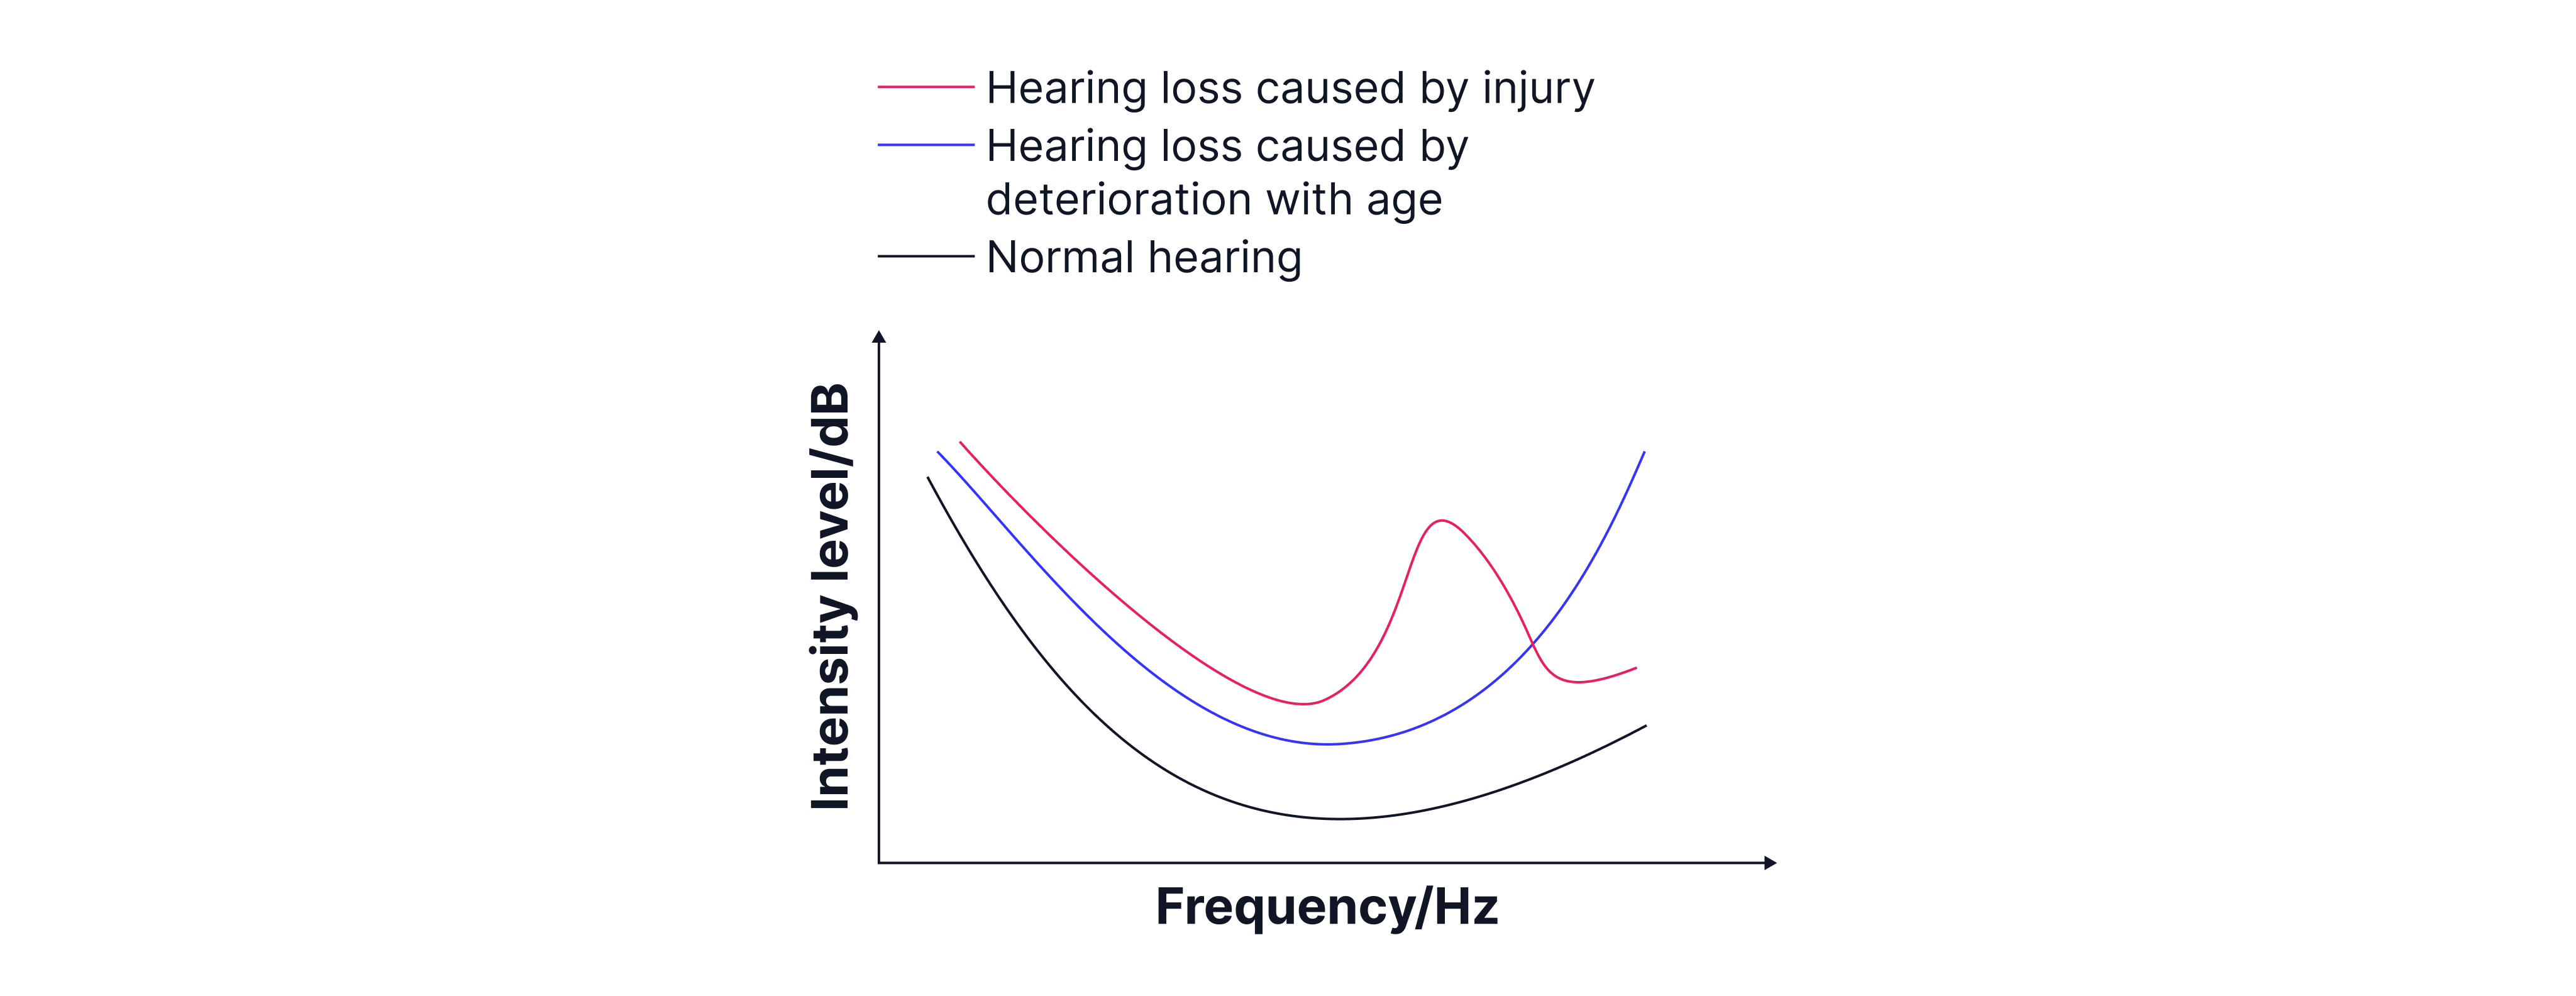
As we age:
The highest frequency that can be heard decreases.
A higher relative intensity is required to hear high-frequency sounds.
Hearing loss increases with exposure to loud noise. Damage is worst at .
High-frequency hair cells are particularly vulnerable.
Damage to hair cells is permanent.
Equal loudness curves show how the same perceived loudness requires different sound intensities at different frequencies. They are produced using a reference tone:
A sound of known intensity is played.
Sounds of other frequencies are adjusted until they are perceived to be equally loud.
The required intensity is recorded and plotted.
Equal loudness curves vary between individuals and change with age and hearing damage. The graph below shows equal loudness curves for one person with different starting intensities. Every point along the blue line the person perceives as being the same loudness.
Sound Level Meters
Sound level meters use an A-weighting filter which adjusts measurements to reflect the frequency sensitivity of the human ear. This reduces the contribution of very low and very high frequencies. Measurements using an A-weighting filter and given in .
Worked Example;
Three people are listening to music. Person A is a year old with healthy hearing, person B is a year old who works in loud environments as a concert music technician, and person C is a year old.
Describe the differences in their perceived sounds.
Answer:
Persons B and C with hear all frequencies at a lower intensity that person A.
Person B would experience most hearing loss at
Person C would experience most hearing loss at high frequencies
Worked Example:
Describe the procedure to gather data for an equal loudness curve.
Answer:
A reference tone of known intensity is played.
Sounds of other frequencies are adjusted until they are perceived to be equally loud.
The required intensity is recorded and plotted.
Worked Example:
The frequency of a sound heard by a person with normal hearing rises from to , while the sound intensity remains constant.
An increase in frequency causes the sound to be heard as having a higher pitch.
Explain one other way in which the sound perceived by the person would change as the frequency increases from .
Answer:
The perceived loudness will be less because the ear is most sensitive at .
Practice Questions
A lawnmower is producing a sound with a power of . Calculate the intensity level away.
-> Check out Hannah's video explanation for more help.
Answer:
At a hospital helipad, the sound level produced by a helicopter is at a nearby ward.
Calculate the sound intensity on the ward
A thick sound-insulating wall is installed and reduces the sound intensity by at the ward.
Calculate the new relative sound intensity level, in decibels, after the wall is installed.
-> Check out Hannah's video explanation for more help.
Answer: