Set Notation and Venn Diagrams
Neil Trivedi
Teacher

Contents
Sets
In maths, it is often useful to talk about a whole collection of items at once. We call such a collection a set, and we use curly brackets to list the items inside it.
A set is a collection of items that satisfies two properties:
It contains no duplicates: each item appears only once.
The order of the items does not matter (though ascending order is tidy).
For example:
is a finite set containing just the numbers and only.
The set of integers is infinitely large, and is the set of positive integers.
A set can also be described by a rule. For example, means “all numbers of the form where is an integer”, or, in other words, the even numbers.
For our notes on the general form of numbers, see our Algebraic Proof notes.
Key Set Notation
means “is an element (member) of”, e.g.
means “is not an element of”, e.g.
means “is a subset of”: every element of the first set is also in the second, e.g.
is the empty set: the set with no elements in it at all.
is the universal set: the set of everything being considered in the question.
Venn Diagrams
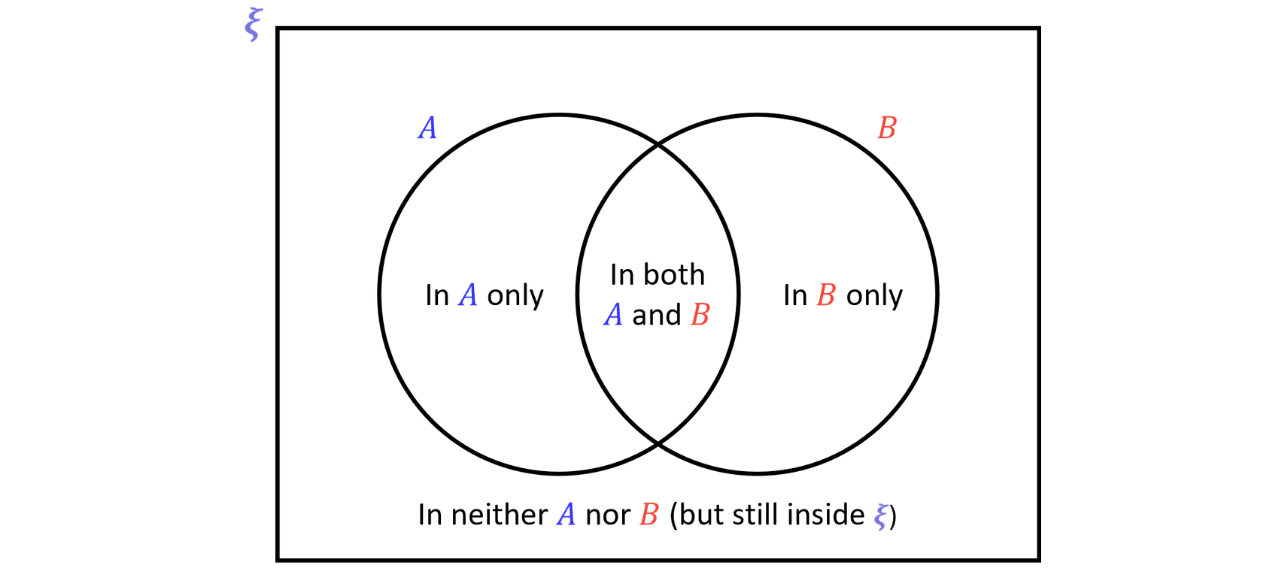
A Venn diagram sorts the elements of the universal set into regions. The rectangle represents so every element lives somewhere inside it. Each circle represents a set, the overlap holds the elements that are in both sets, and anything outside the circles is in neither set.
Union, Intersection and Complement
Combining Sets
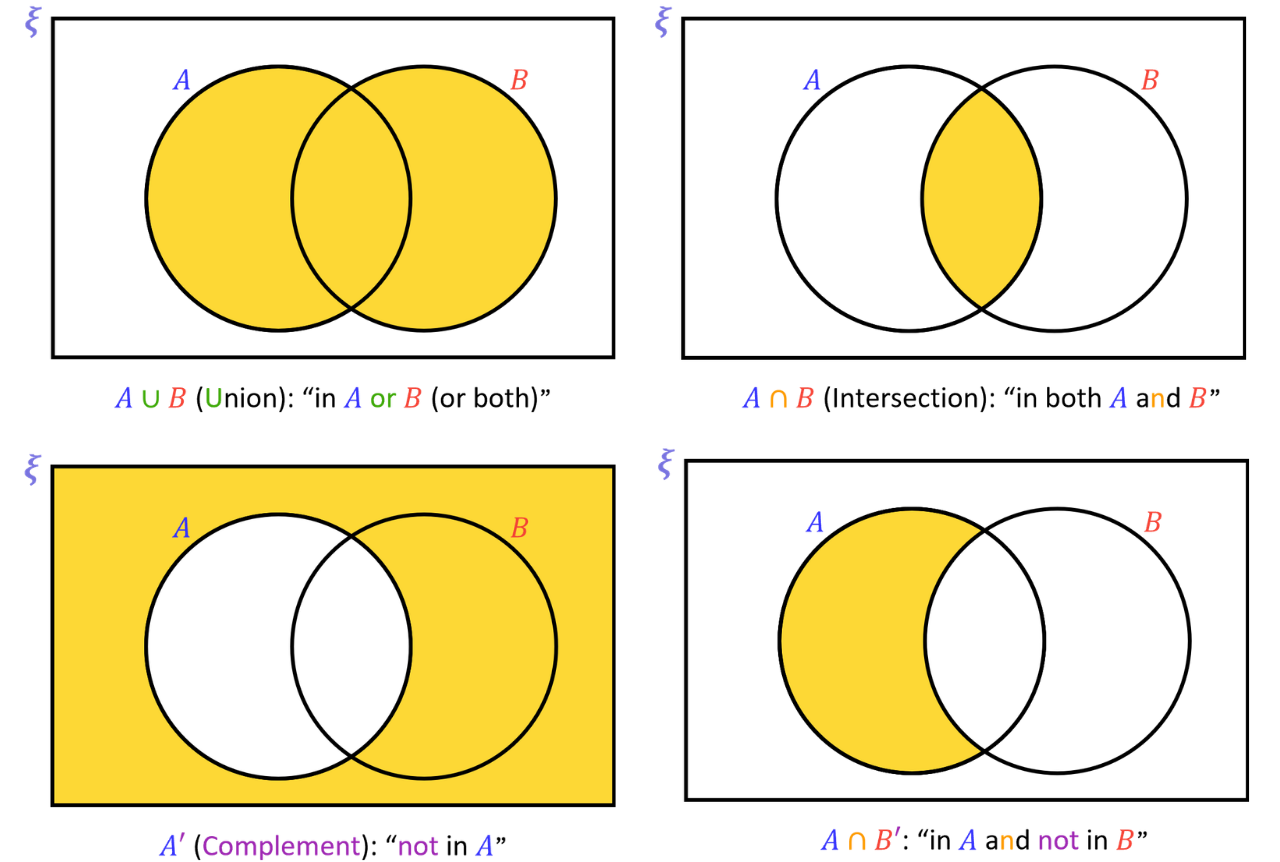
is the union of and the elements in or (or both).
is the intersection of and the elements in both and
is the complement of the elements not in
Example 1:
factors of and square numbers
a) Complete a Venn diagram to show and .
Step 1: List the elements of each set
For Set The factors of are and but only those up to are inside
For Set The square numbers up to are and
Therefore,
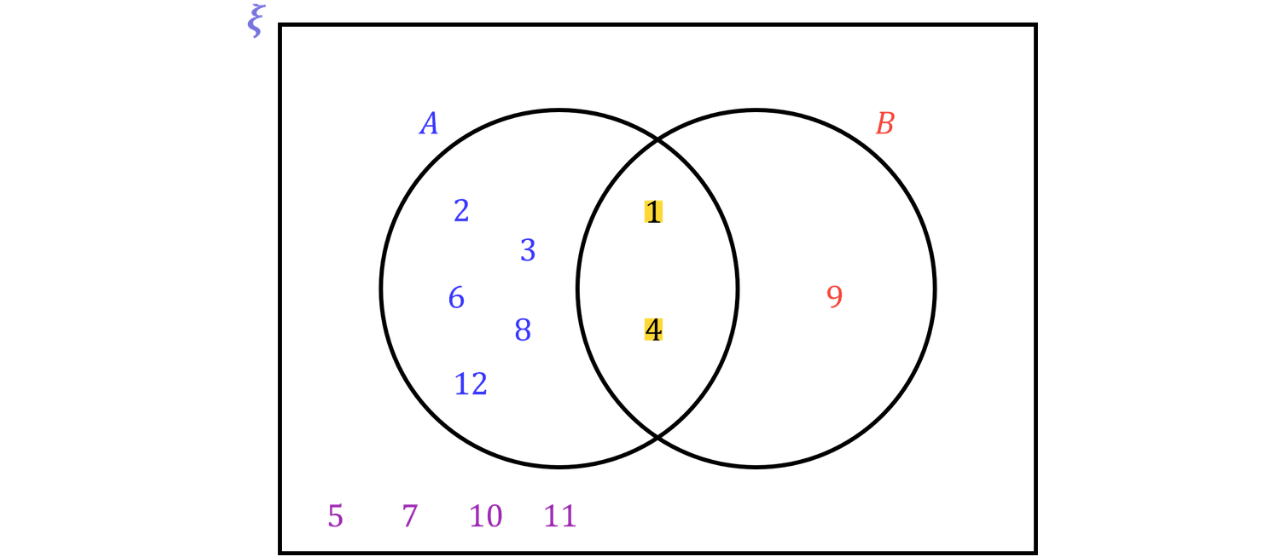
Step 2: Place the elements on the Venn diagram, starting with the overlap.
and are in both sets, so they go in the intersection. The remaining elements of each set go in their own circle, and and belong in neither set, so they sit outside the circles (but still inside the rectangle).
b) List the elements of:i. ii. iii.
Single Step: Read off the sets from the Venn diagram.
i. The intersection holds and
ii. The union is everything inside either circle:
iii. is everything in that is not in
c) True or false?i. ii. iii. iv.
Single Step: Decide whether each statement is true or false.
i. is TRUE: is a factor of
ii. is FALSE: is in but it is not in so it is not in both.
iii. is TRUE: every element of is also in
iv. is FALSE: is not in
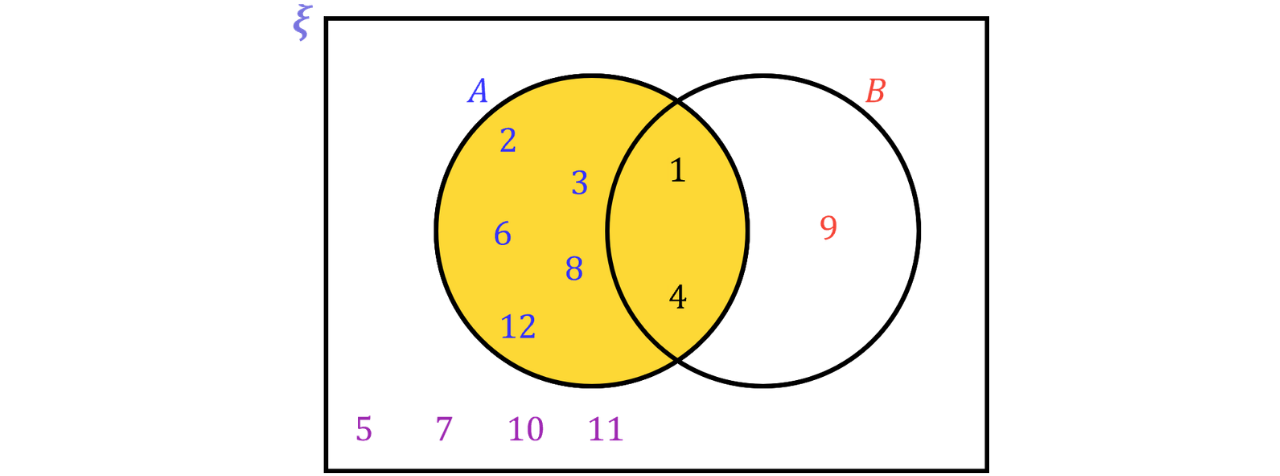
d) A number is chosen at random from Find
means “in and not in ”.
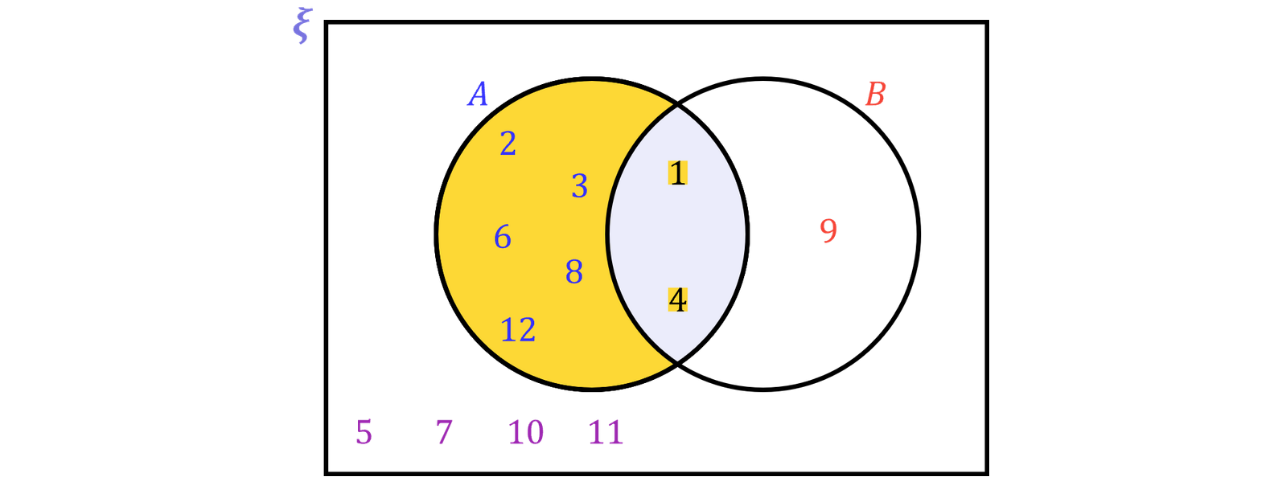
That is the set which contains numbers.
Since we are choosing a number from we have numbers in total.
e) Find
A vertical line means “given” in set notation. So is asking us to find the probability of given
In other words: what is the probability of if has already happened?
The best way to think of it is this: If we focus on the elements inside of circle how many are shared with
The circle has elements inside of it. This means our probability is out of
There are elements inside of that are also shared with
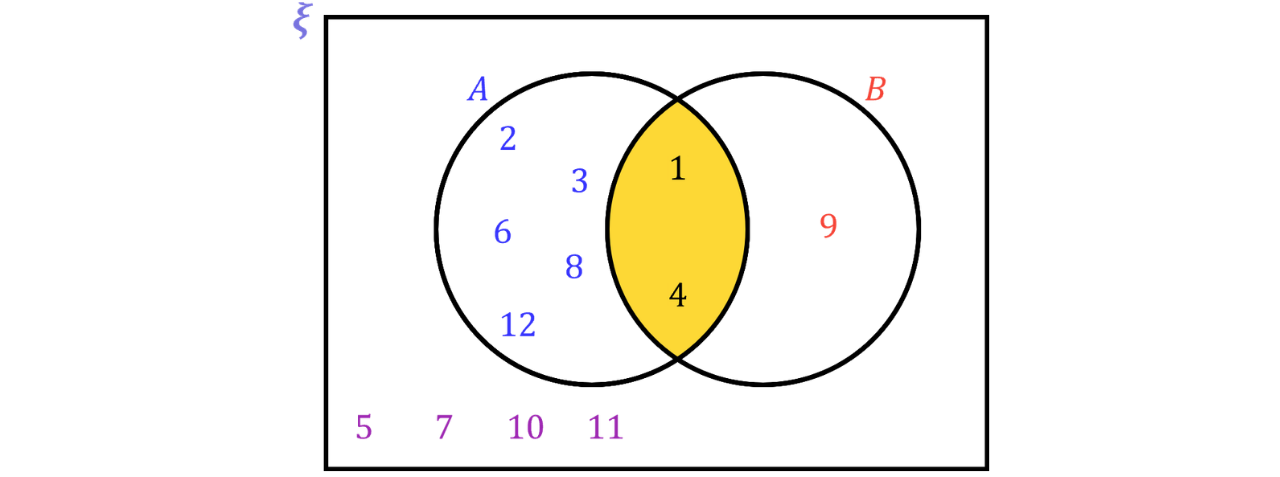
Therefore,
HCF and LCM from a Venn Diagram
Venn diagrams give a quick way to find the highest common factor (HCF) and lowest common multiple (LCM) of two numbers by sorting their prime factors into the two circles.
Method: HCF and LCM from a Venn Diagram
Write each number as a product of its prime factors.
Put the prime factors common to both numbers (including repeats) in the overlap.
Put each number’s remaining prime factors in its own outer region.
HCF = the product of the overlap. LCM = the product of every prime in the diagram.
Example 2:
Find the HCF and LCM of and
Step 1: Write each number as a product of prime factors.
This is most commonly done at GCSE using factor trees.
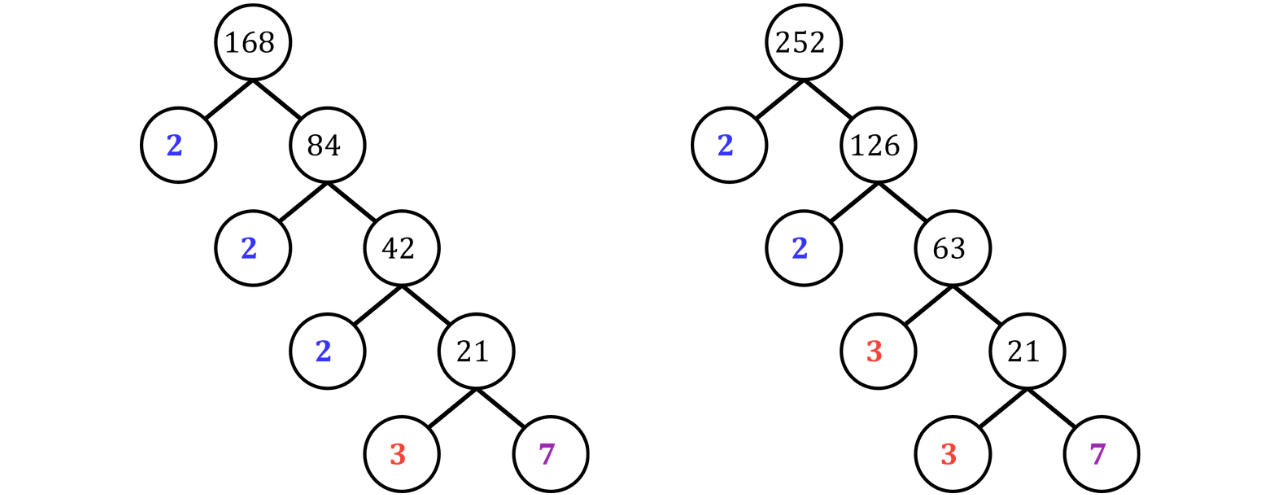
Written in product form:
Step 2: Sort the prime factors into a Venn diagram.
Both lists share two , one and one so these go in the overlap.
That leaves a spare for and a spare for
The numbers that overlap only get put in the Venn diagram once. Crossing out one line of overlapping numbers can help mitigate that mistake.

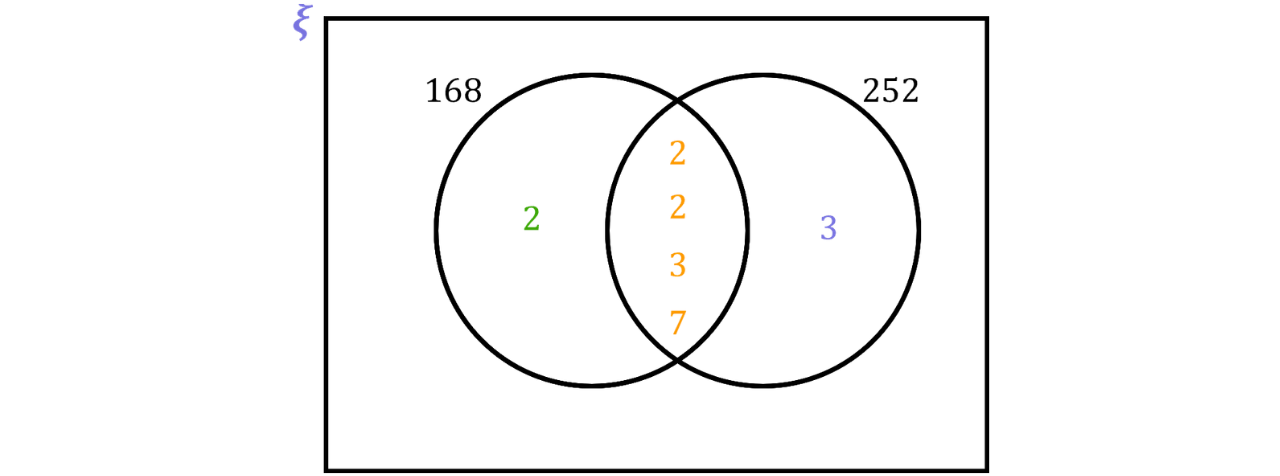
Step 3: Multiply the overlap to get the HCF.
HCF
Step 4: Multiply every prime in the diagram to get the LCM.
LCM
Venn Diagrams and Frequencies
Often, each region of a Venn diagram shows how many items are in it, rather than the items themselves. Exam questions usually give the total for each set and the amounts in the overlaps and ask you to complete the diagram before finding probabilities.
Method: Completing a Frequency Venn Diagram
Start in the middle: fill in the overlap of all the circles first.
With three circles, each “two sets” overlap is its pair total minus the centre.
For each single set, subtract the other regions of its circle from that set’s total.
Anything left over goes outside the circles: subtract everything inside from the overall total.
Conditional probability: means “the probability of given has happened”. Only look inside divide the part of that is also in by the total of
Example 3:
Year students were asked which revision resources they had used. is the set of students who used flashcards, is the set who used past papers and is the set who used revision videos.
used flashcards, used past papers and used revision videos
used flashcards and past papers
used flashcards and revision videos
used past papers and revision videos
used all three resources
a) Complete a Venn diagram to show this information.
Step 1: Start in the centre.
students used all three resources, so goes in the centre region.
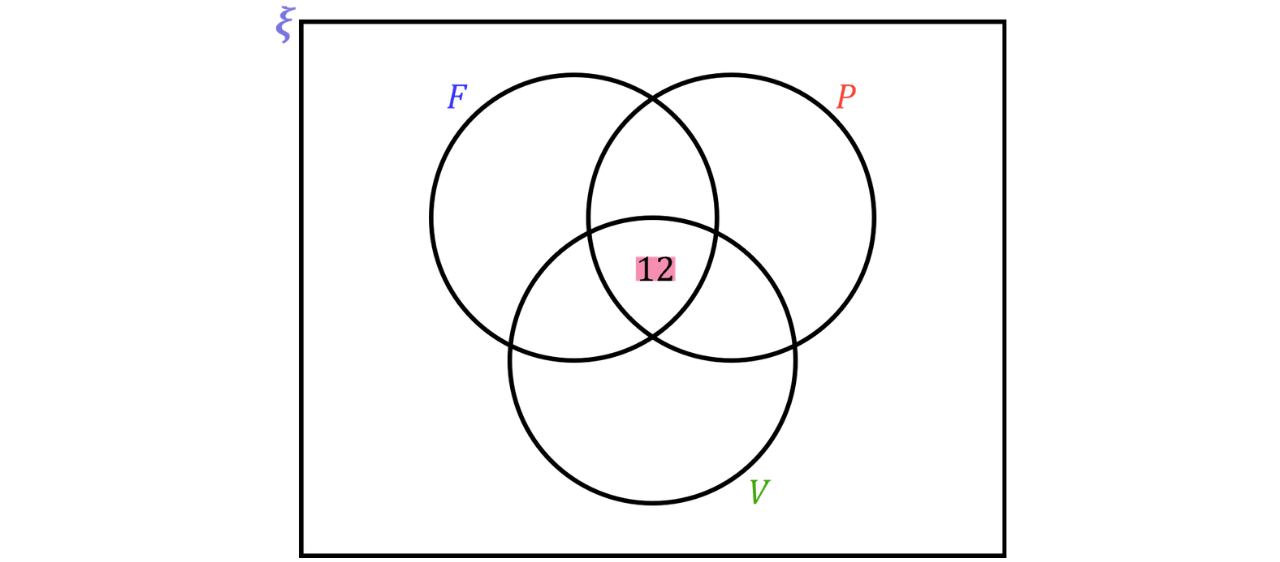
Step 2: Fill in the “exactly two” overlaps by subtracting the centre.
only:
only:
only:
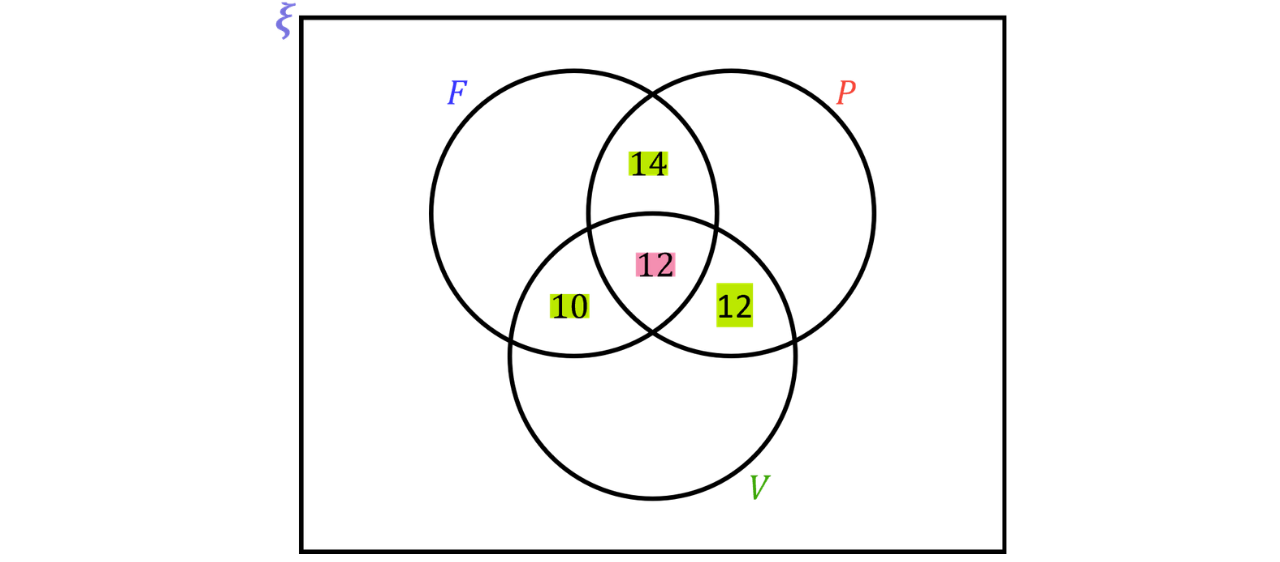
Step 3: Fill in the “only one set” regions using each set’s total.
only:
only:
only:
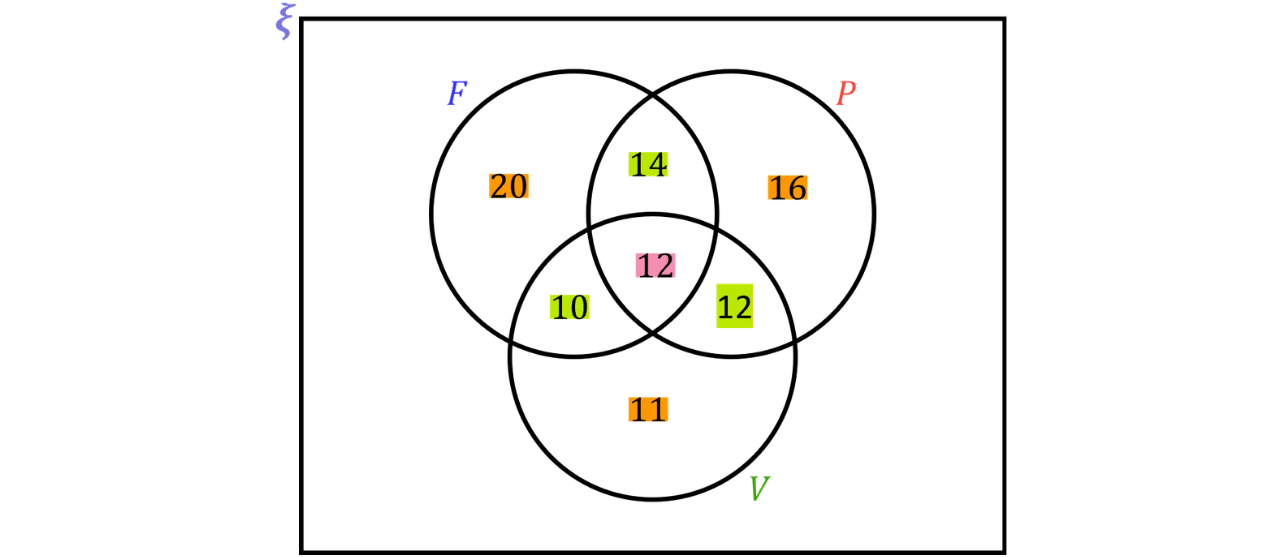
Step 4: Whatever is left over goes outside the circles.
The regions inside the circles add up to so students used none of the resources.
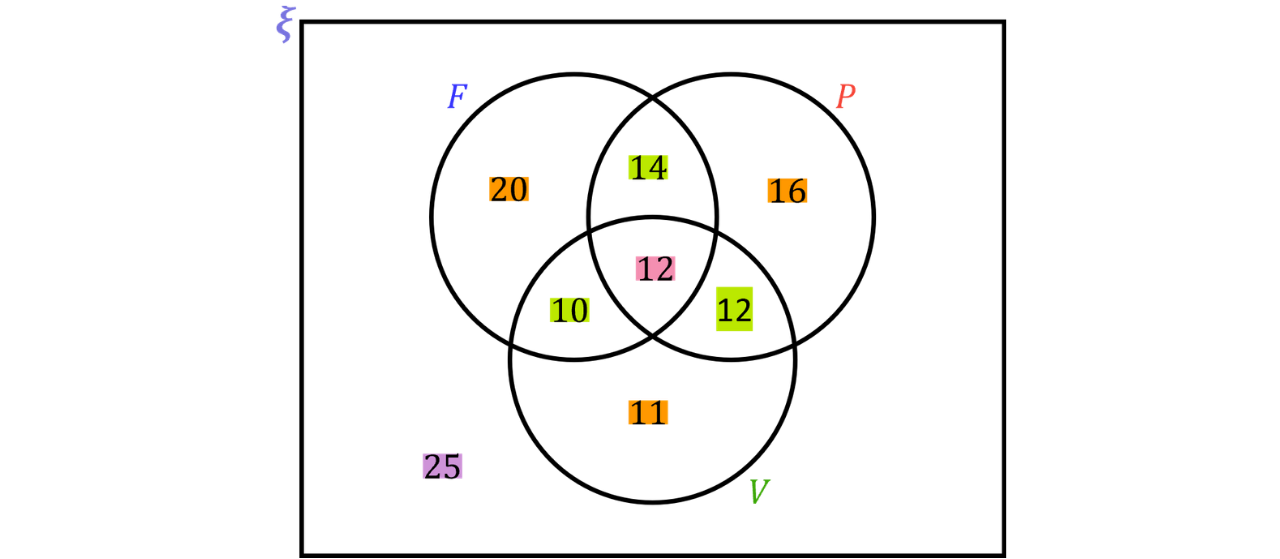
b) One of the students is chosen at random. Find the probability that the student
i. used none of the three resources.
Single Step: Read the appropriate value from the Venn diagram and write it over the total.
of the students used none of the resources:
(none)
ii. used exactly two of the resources.
Single Step: Read the appropriate value from the Venn diagram and write it over the total.
“Exactly two” is the three regions and which add to give
(exactly two)
iii. used flashcards but not past papers.
Single Step: Read the appropriate value from the Venn diagram and write it over the total.
“Flashcards but not past papers” is the part of outside (inside the blue circle but outside the striped area):
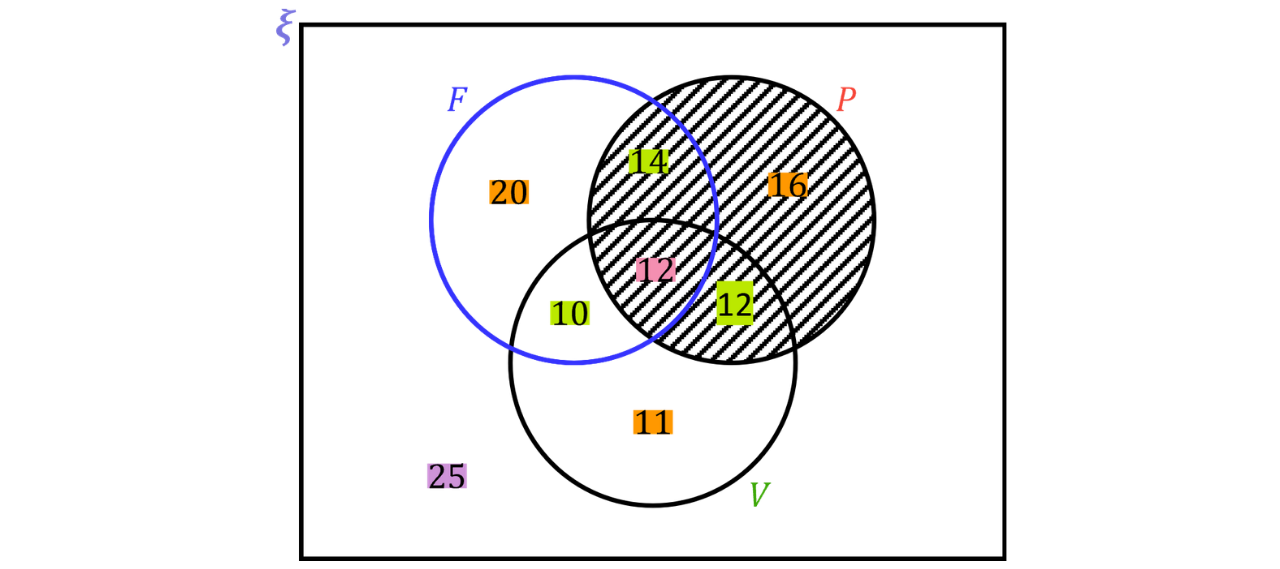
(flashcards but not past papers)
c) Given that the student used past papers, find the probability that they used all three resources.
Single Step: Restrict to and observe how many also use and
“Given that the student used past papers” means we only look inside In total, students used past papers, and of them used all three resources.
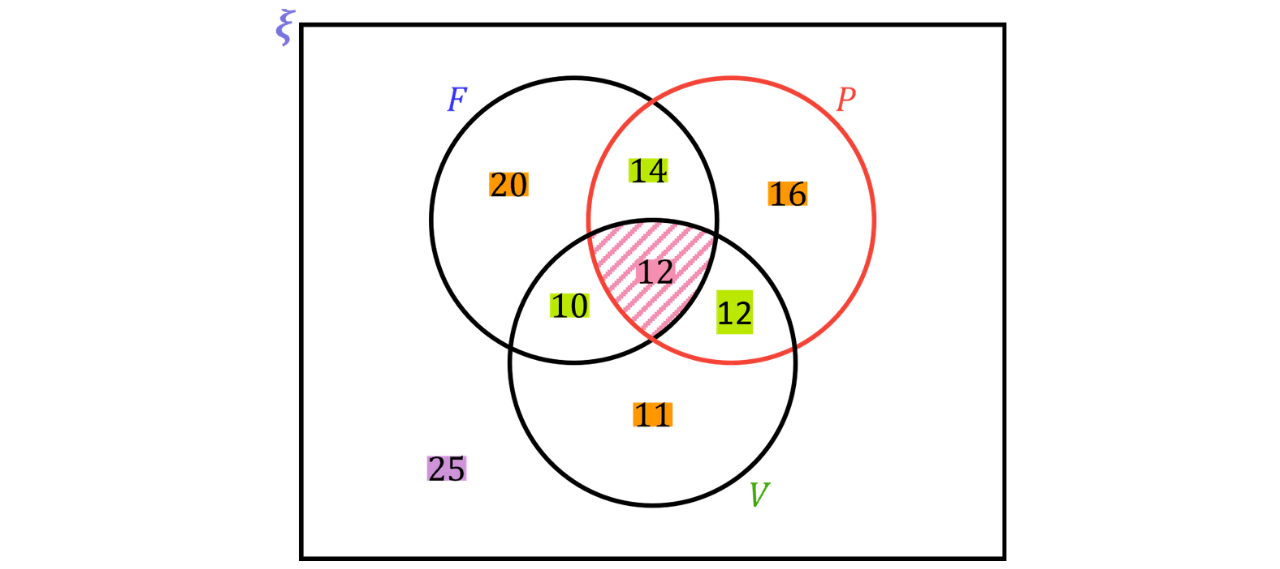
given
(used all three resources|used past papers)
Algebraic Venn Diagrams
Sometimes, the regions of a Venn diagram contain algebraic expressions instead of numbers. All the regions must add up to the overall total, which lets us form and solve an equation.
Example 4:
The Venn diagram shows information about the customers who visited a café one morning. is the set of customers who ordered a hot drink and is the set of customers who ordered a cake.
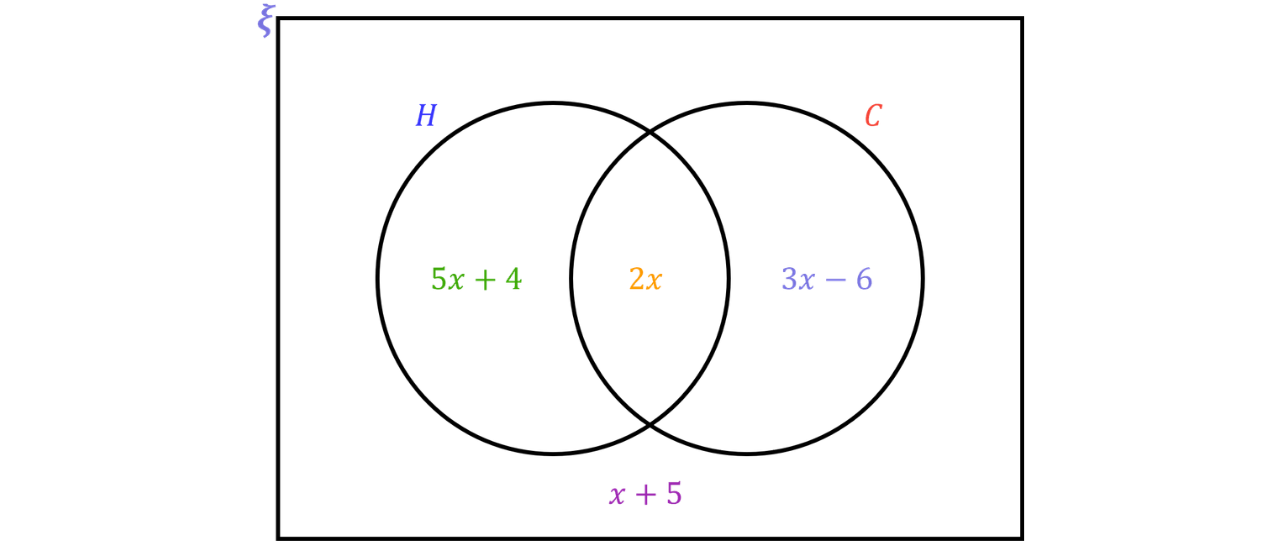
a) Find the value of
Single Step: Form an equation. The four regions must add up to
Since there are no coefficients in front of the brackets, we can remove them and simplify the left side.
Subtracting from both sides,
Dividing both sides by
b) Find the probability that a randomly chosen customer ordered exactly one of the two items.
Step 1: Substitute into our Venn diagram.
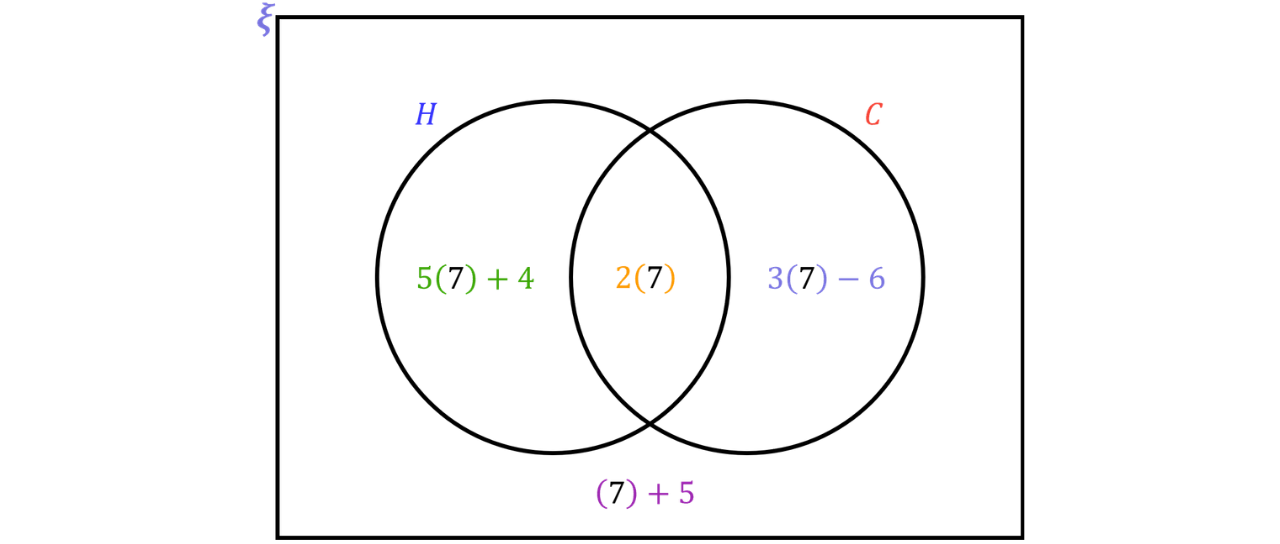
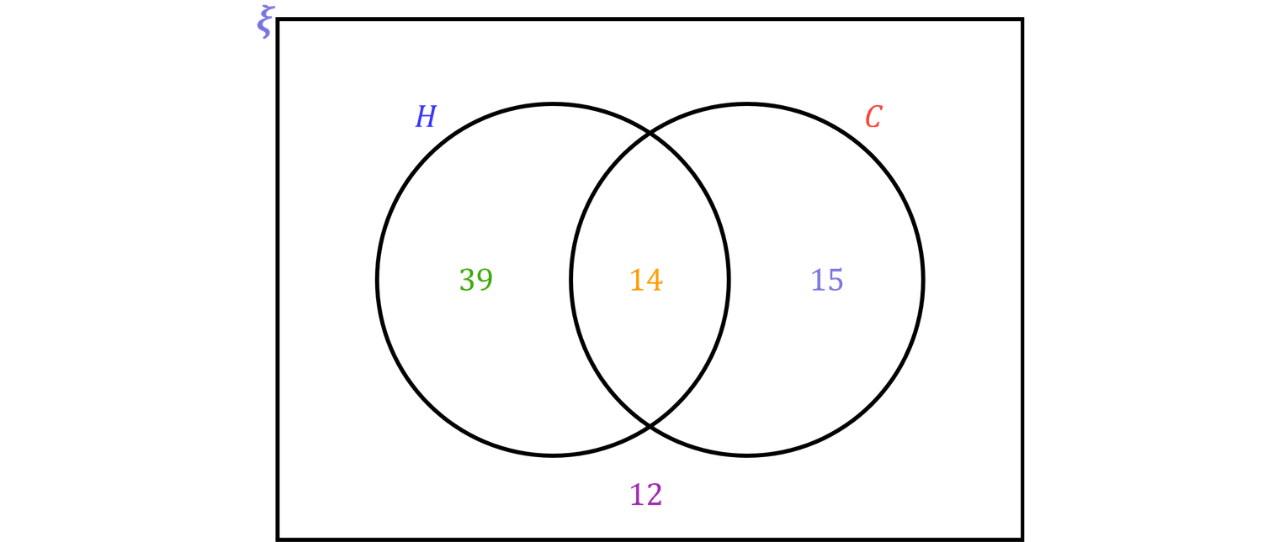
Step 2: “Exactly one of the two items” means hot drink only or cake only.
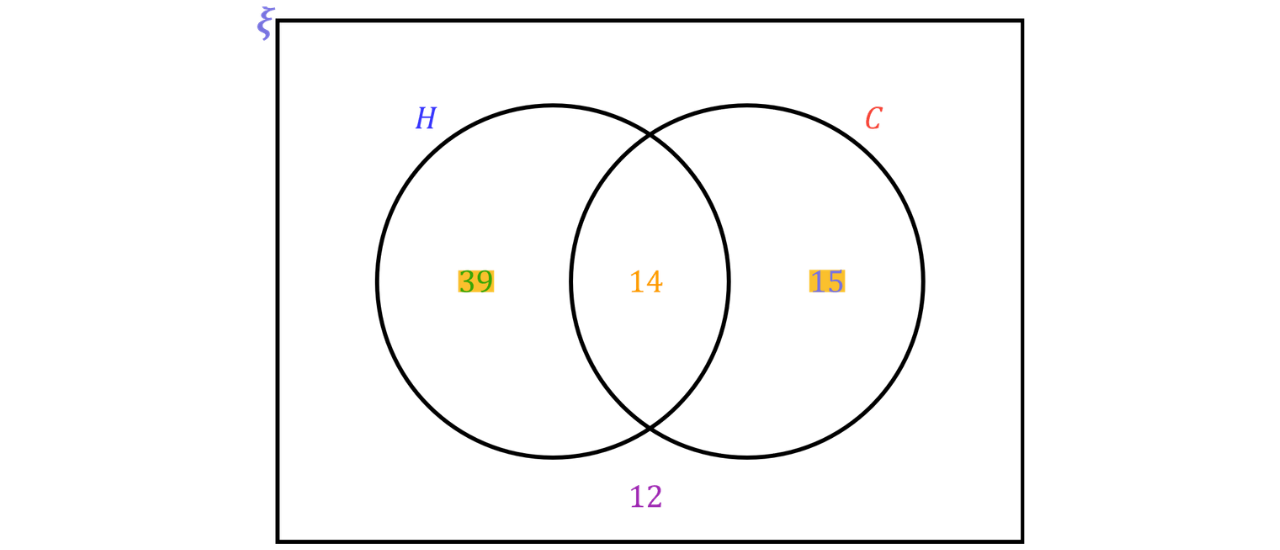
customers
(exactly one)
c) Given that a customer ordered a cake, find the probability that they also ordered a hot drink.
Single Step: Restrict to and observe how many order
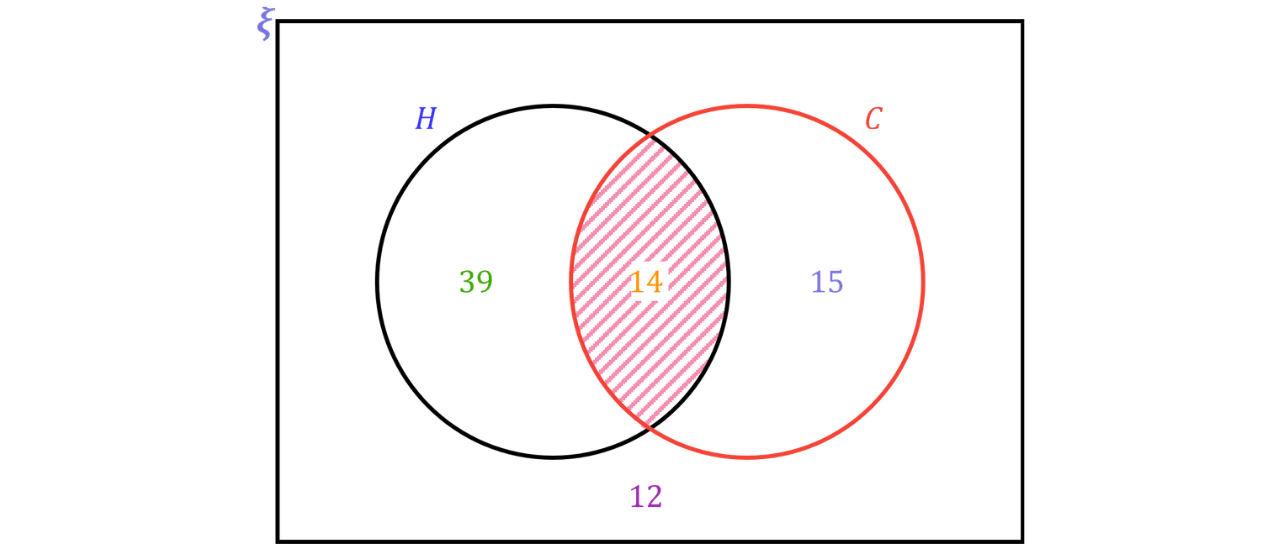
In total customers ordered a cake. Of these, also ordered a hot drink.
(ordered a hot drink | ordered a cake)
Practice Question