Solving by Plotting Graphs
Neil Trivedi
Teacher

Solving by Plotting Graphs
Solving by plotting graphs is a method used to find solutions to equations by drawing graphs and identifying the points where they intersect.
To draw the graphs, we often use a table of values to obtain coordinates, which are then plotted on a set of axes. The points are then joined to form a line or a curve.
Once we draw the graphs, we can identify the points of intersection.
This method is particularly useful for estimating solutions to equations that are difficult to solve algebraically.
Example 1:
A quadratic has equation
a) Use the table below to plot the quadratic for

Step 1: Complete the table of values.
We substitute each value of into the equation to find the corresponding value of
Let’s start with
Note:
Then, continuing this process for the other values:
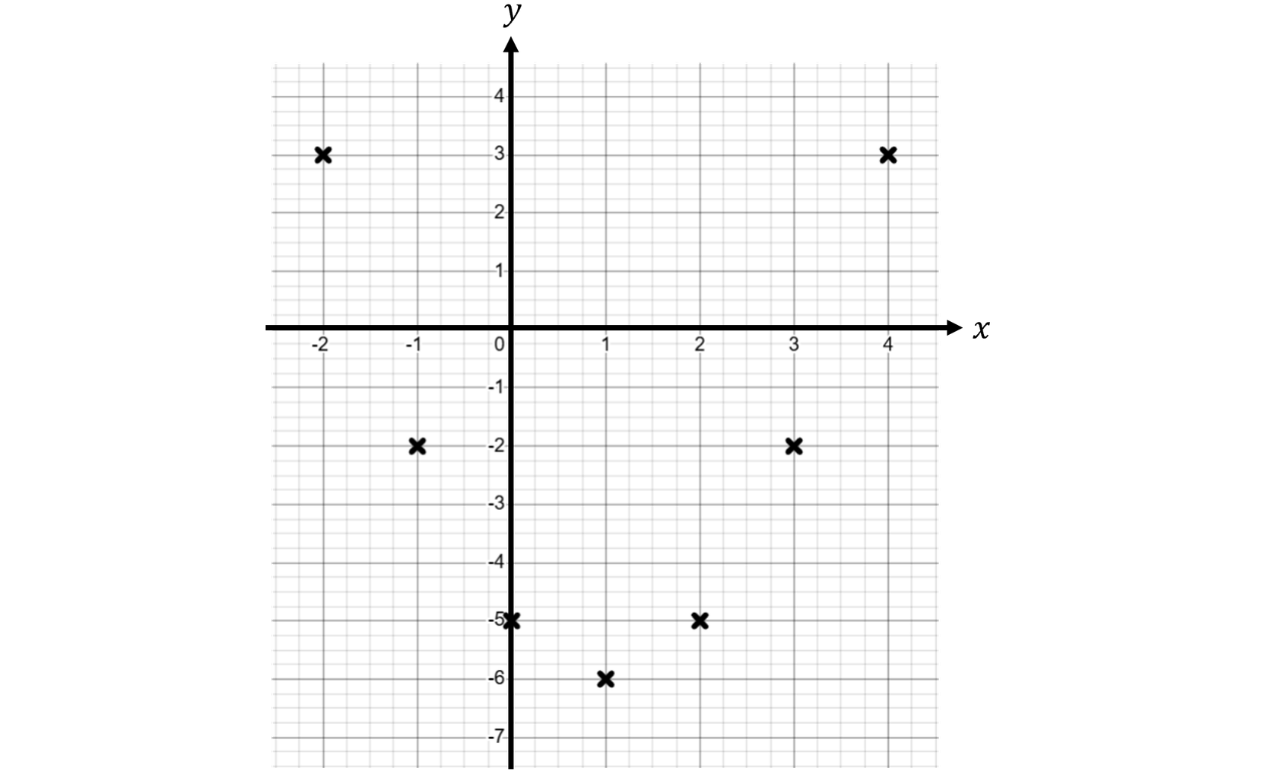
Therefore, we get the following completed table of values.

Note: The completed table shows that the values are symmetrical. For example, and both give and and both give This happens because the graph of a quadratic is symmetrical.
Step 2: Plot the coordinates from the completed table of values on a set of axes.
Step 3: Connect these points by drawing a curve to form a parabola.
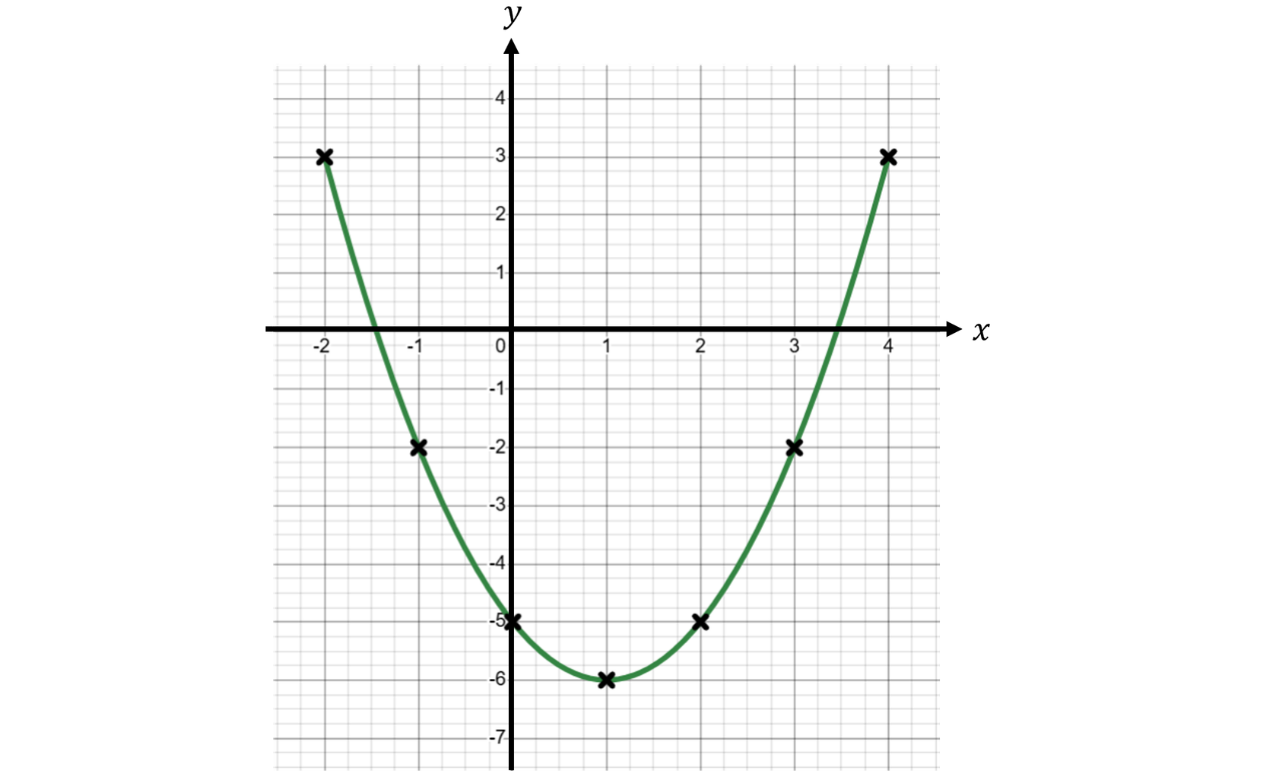
b) Estimate the solutions of
Give your answers to decimal place.
Single Step: Use the graph to estimate the solutions to the equation.
This equation represents where the quadratic has value which corresponds to the axis.
Therefore, the solutions are the points where the graph intersects the axis, also known as the roots of the equation.
The graph below shows the points of intersection between the quadratic and the axis.
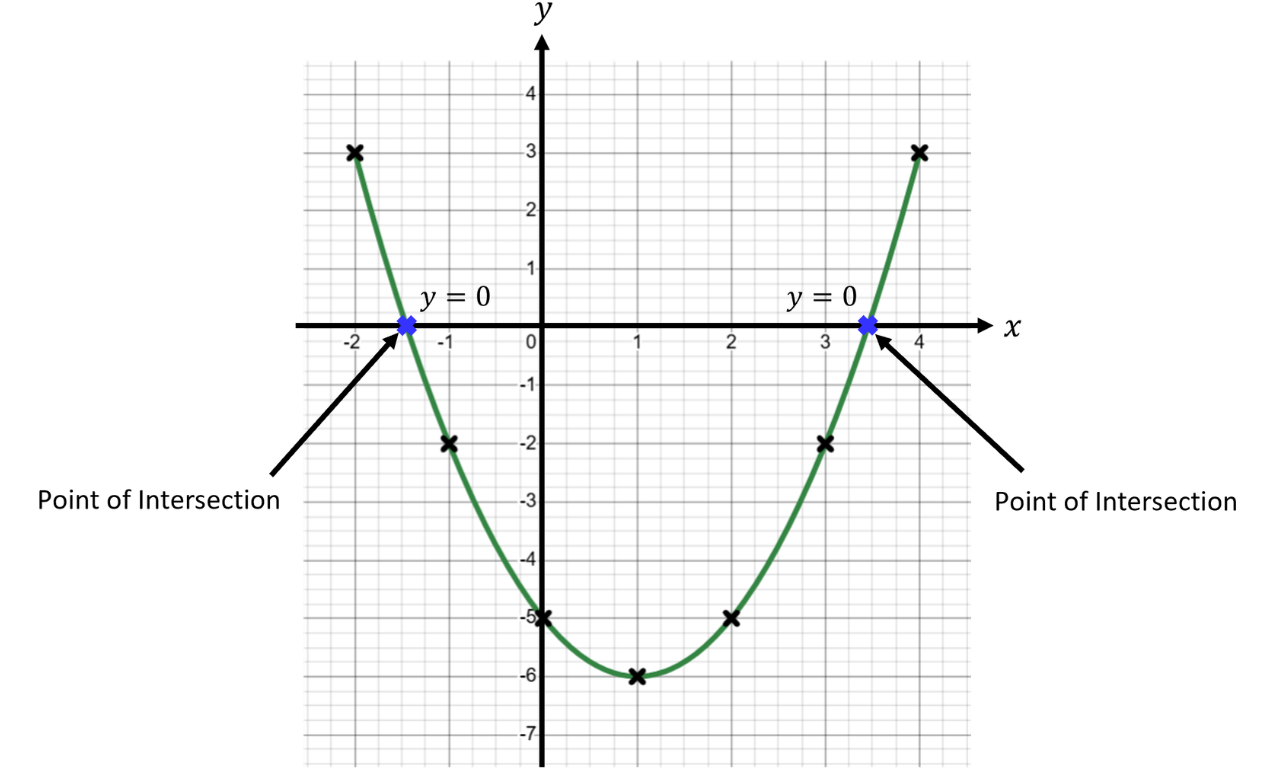
From the graph, we can estimate that the curve intersects the axis at and
Note: Answers may vary slightly depending on how the curve was drawn. In exam questions, a range of acceptable answers is usually allowed when estimating from a graph.
Example 2:
a) By completing the table first, plot the graph of for

Step 1: Complete the table of values.
We substitute each value of into the equation to find the corresponding value of
Let’s start with
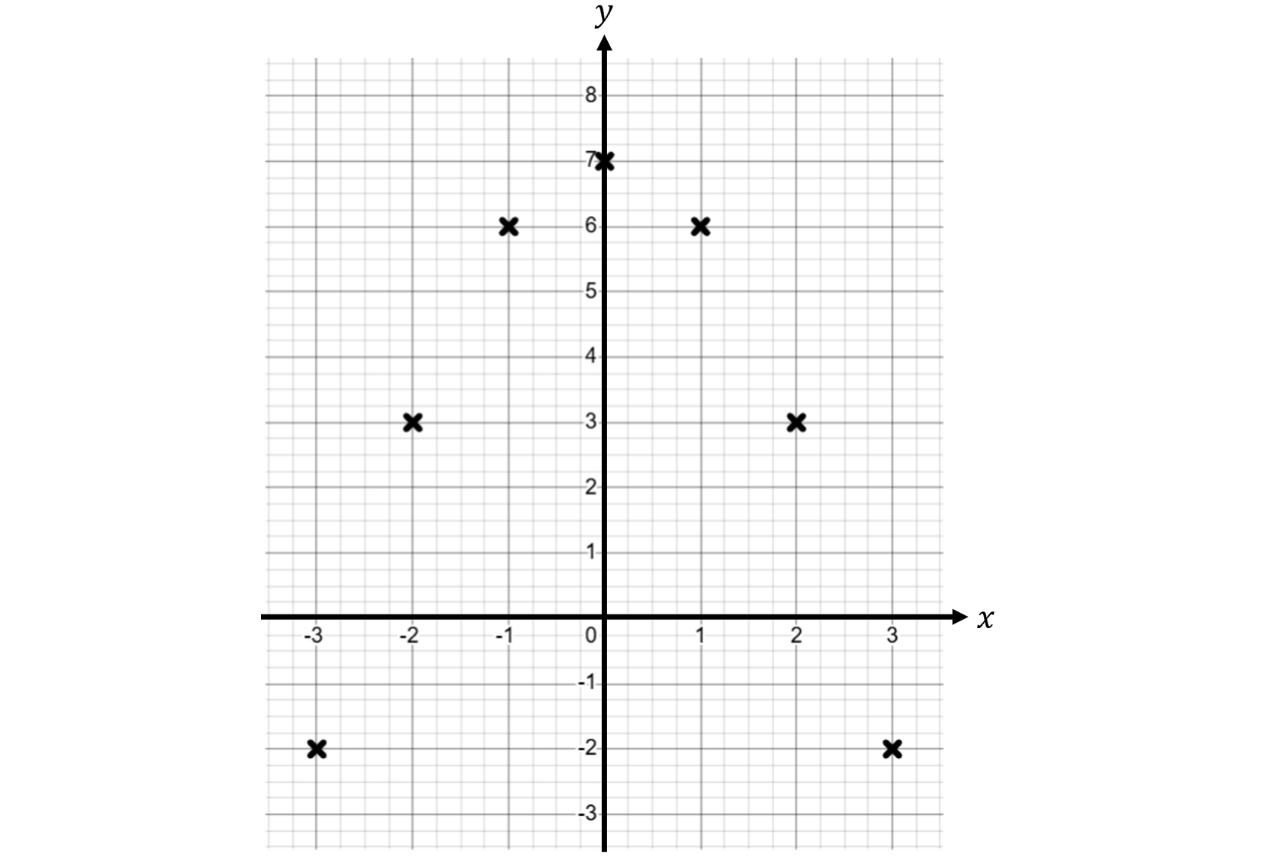
Therefore, we get the following completed table of values.

Step 2: Plot the coordinates from the completed table of values on a set of axes.
Step 3: Connect these points by drawing a curve to form a parabola.
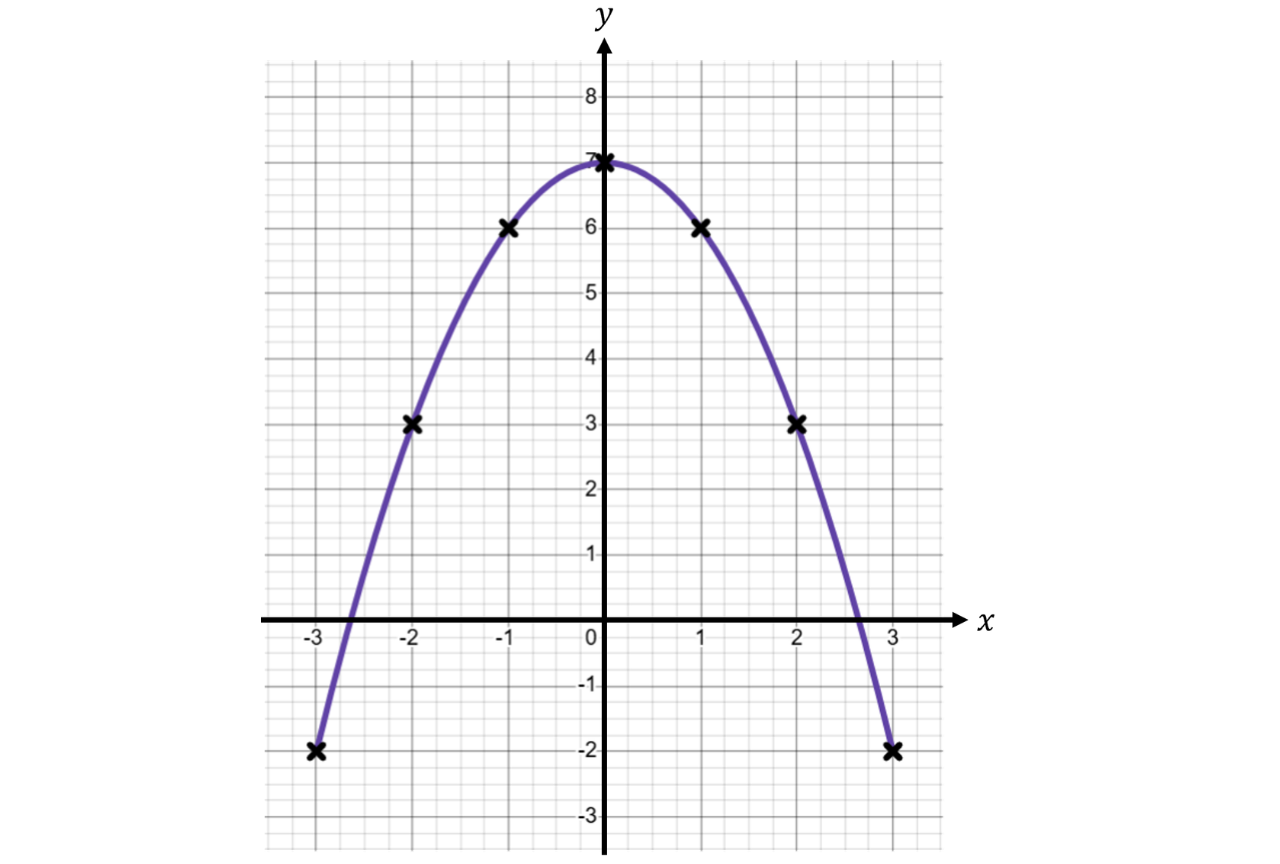
b) Draw the line on the same coordinate axes.
Single Step: Use the gradient and intercept to draw the line.
The line has a intercept of so it passes through the point The gradient is so from this point, we move unit to the right and unit up to get to another point, namely
We then draw a straight line through these points using a ruler.
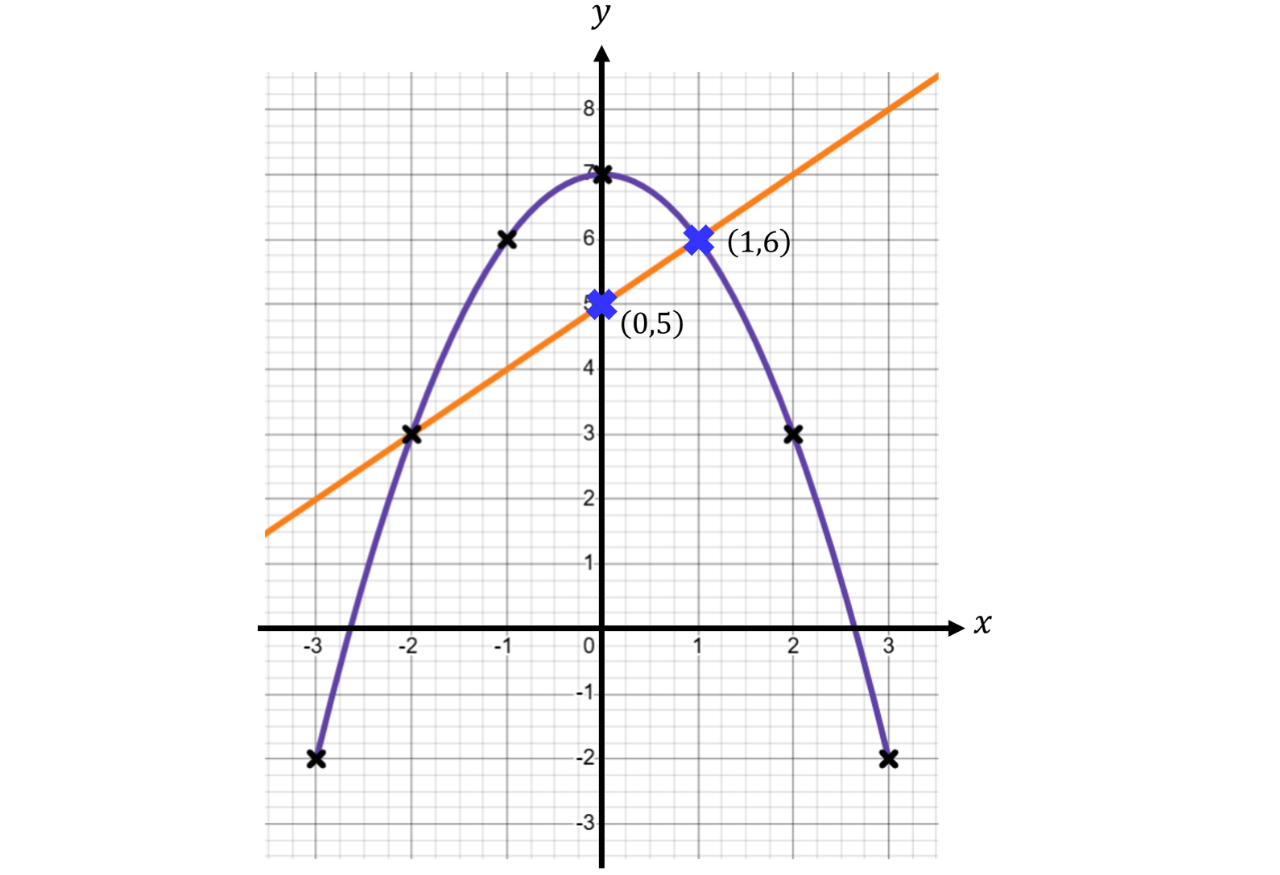
c) Find the coordinates of the points of intersection between and
Single Step: Use the graph to find the points of intersection between the line and the curve.
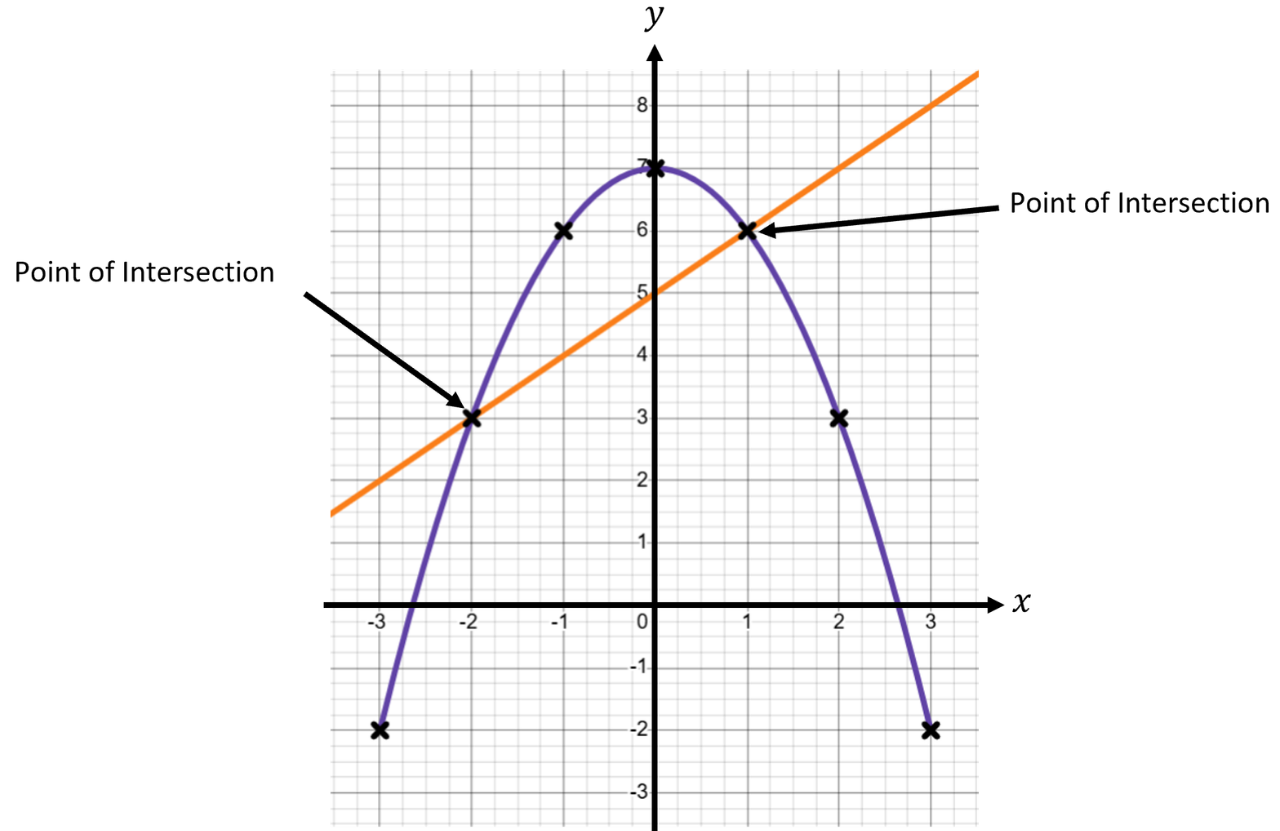
From the graph, we see that the line and the curve intersect at the points with coordinates and
Example 3:
A quadratic has equation
a) Use the table below to plot the quadratic for

Step 1: Complete the table of values.
We substitute each value of into the equation to find the corresponding value of
Let’s start with
Therefore, we get the following completed table of values.

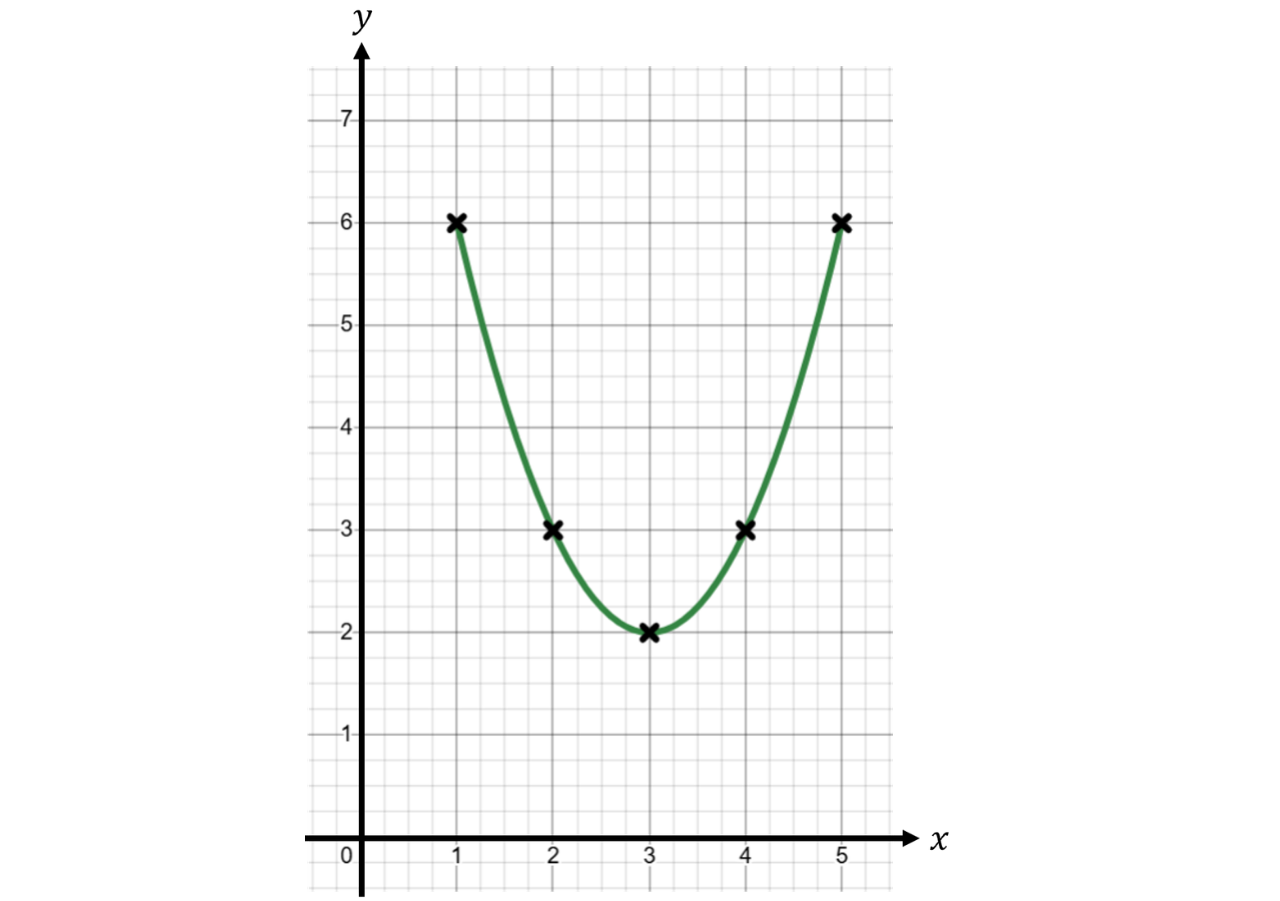
Step 2: Plot the coordinates from the completed table of values on a set of axes.
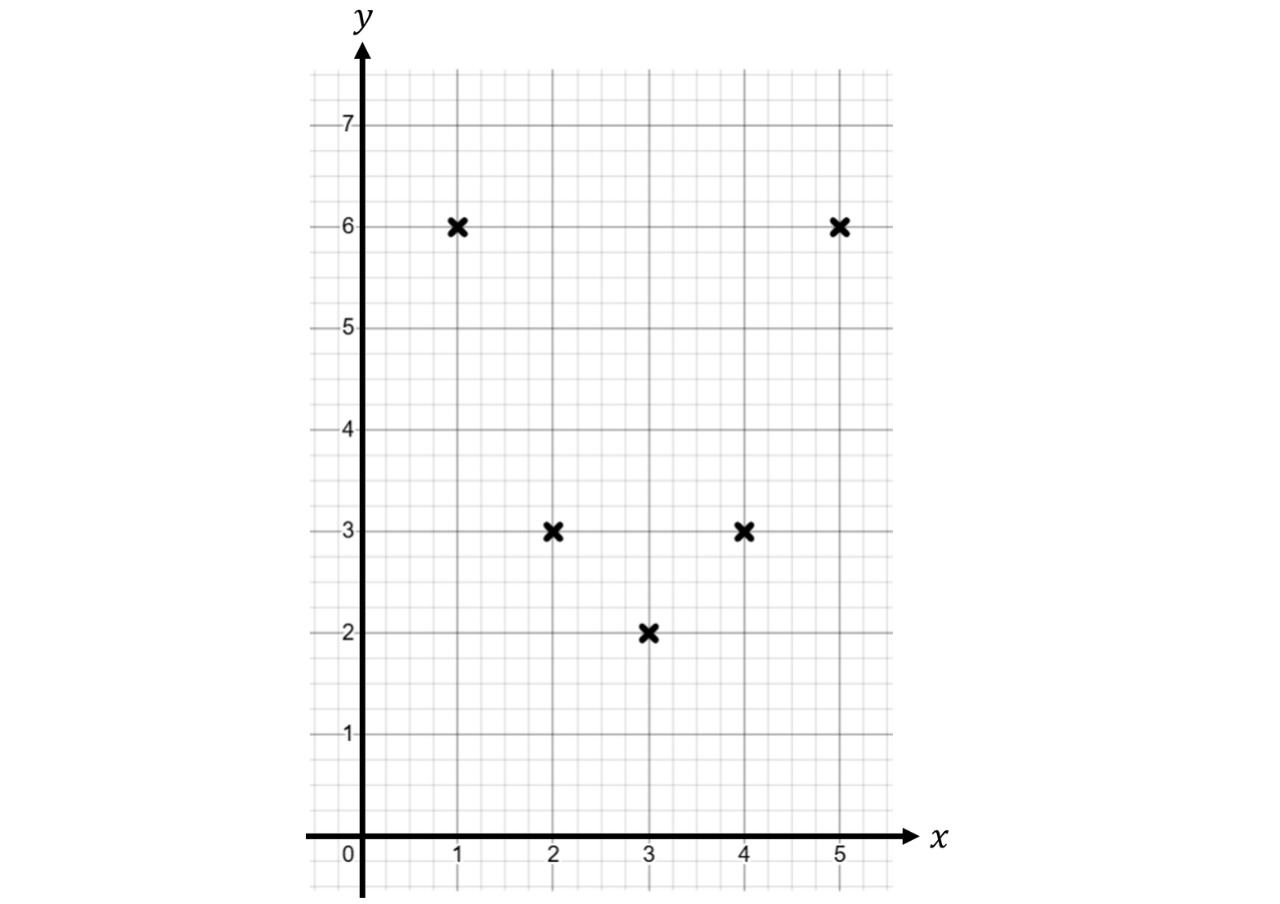
Step 3: Connect these points by drawing a curve to form a parabola.
b) By drawing a suitable straight line on your graph, estimate, to decimal place, the solutions of
Step 1: Transform the equation so that on the left-hand side.
For this question, we want to utilise the fact that we have already drawn the quadratic
So, we have to manipulate the equation so that it reads where is a function to be found.
Both and have but the coefficients of and the constants at the end are different.
To change to we subtract Then, to change to we need to add
So, on our already drawn quadratic graph, we need to draw the line and find where they intersect.
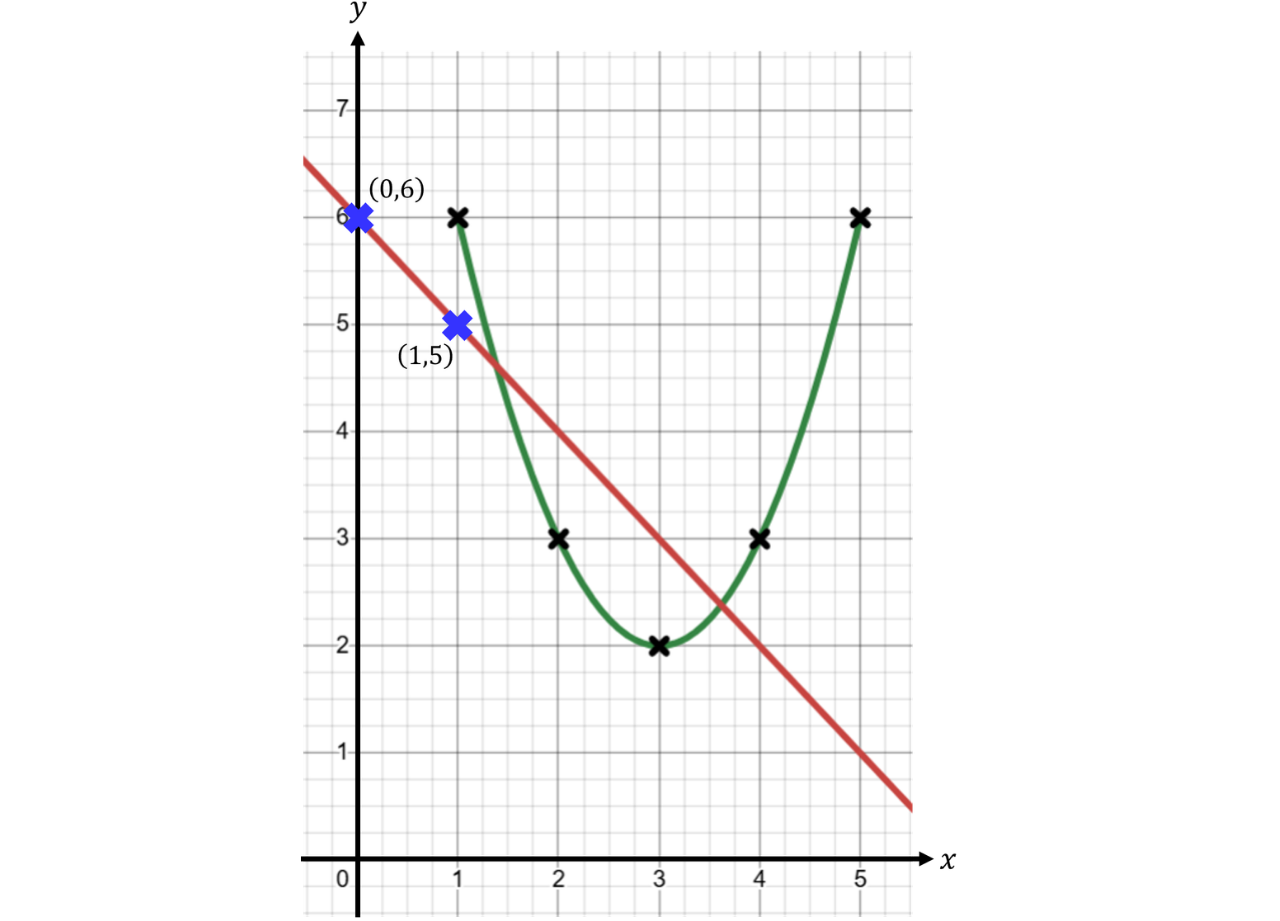
Step 2: Draw the line onto the graph.
The line has a intercept of so it passes through the point The gradient is so from this point, we move unit to the right and unit down to get to another point, namely
We then draw a straight line through these points using a ruler.
Step 3: Use the graph to find the coordinates of the points of intersection between the line and the curve.
On the graph, we identify the points where the line and the curve intersect.
Then, from each point of intersection, we draw a vertical line down to the axis to read off the values.
These values represent the solutions to the equation or equivalently,
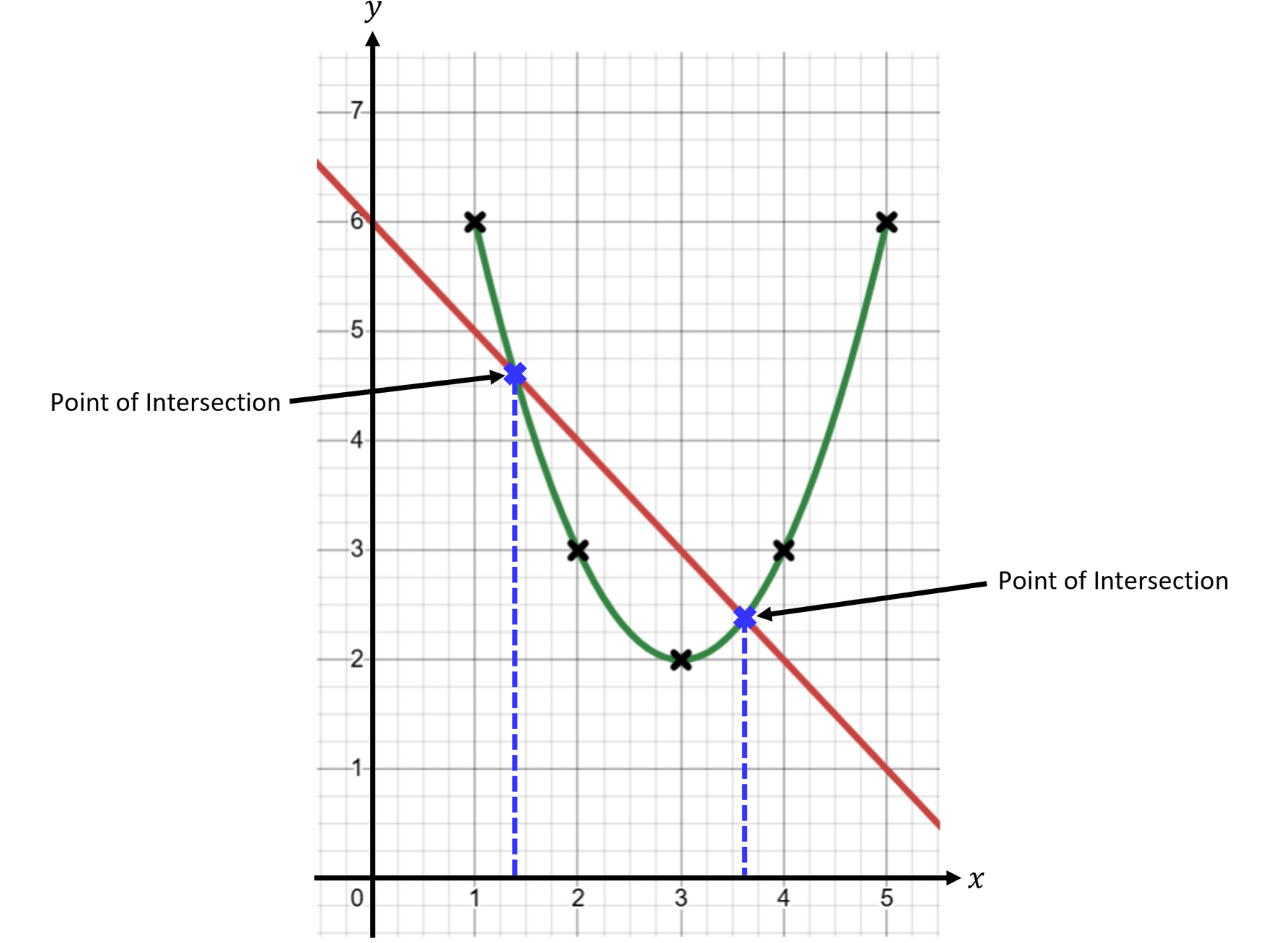
From the graph, we can estimate that the line intersects the curve at and Therefore, these are the approximate solutions to the equation
To note, since we are asked to estimate the solutions to the quadratic equation, we only need the values. It is not necessary to find the corresponding values.
Practice Question