Transformation of Functions
Neil Trivedi
Teacher

Transformation of Functions
Transformations of functions describe how the graph of a function changes its position, shape or orientation.
Starting with a function such as we can apply transformations to produce new graphs without redrawing them from scratch.
At GCSE, we study three main types of transformations:
1) Translations
2) Enlargements
3) Reflections
Translations
Translations involve shifting a graph to a different position without changing its shape, size, or orientation.
The graph can be shifted left or right, which affects the values, or up or down, which affects the values. Each point on the graph moves by the same amount in the same direction.
We describe translations by comparing a new function with the original function Translations can also be described using vectors:
where represents the change in values and represents the change in values. If the graph shifts to the right or upwards, the values of or are positive. If the graph shifts left or downwards, the values are negative.
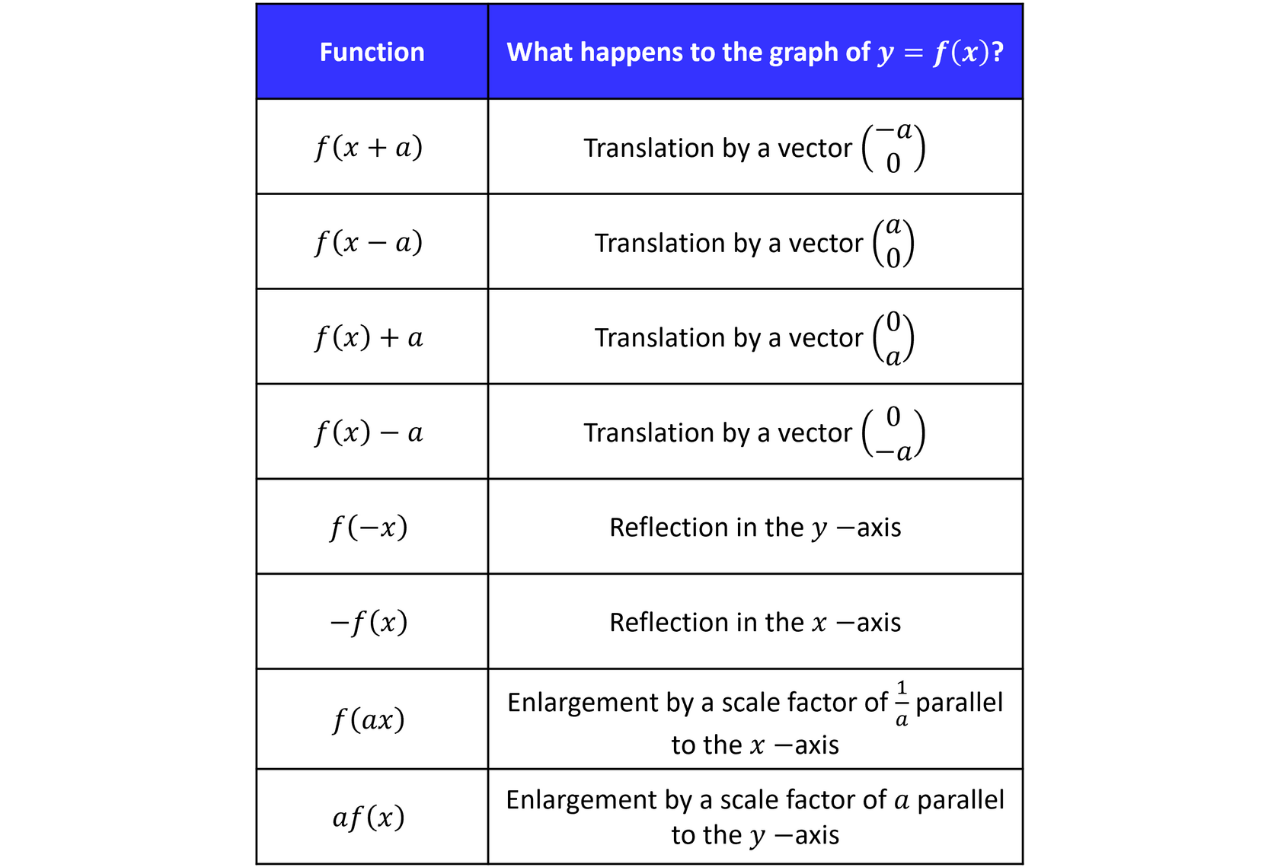
Here is what happens when we translate to the following functions:
The graph shifts left by units. This is a translation by the vector
The graph shifts right by units. This is a translation by the vector
The graph shifts up by units. This is a translation by the vector
The graph shifts down by units. This is a translation by the vector
Key idea: changes inside the function affect the values (horizontal movement) whereas changes outside the function affect the values (vertical movement).
Note: Horizontal translations work in the opposite direction to the sign. Vertical translations work in the same direction as the sign.
We will now look at an example to understand why this is the case.
Example 1:
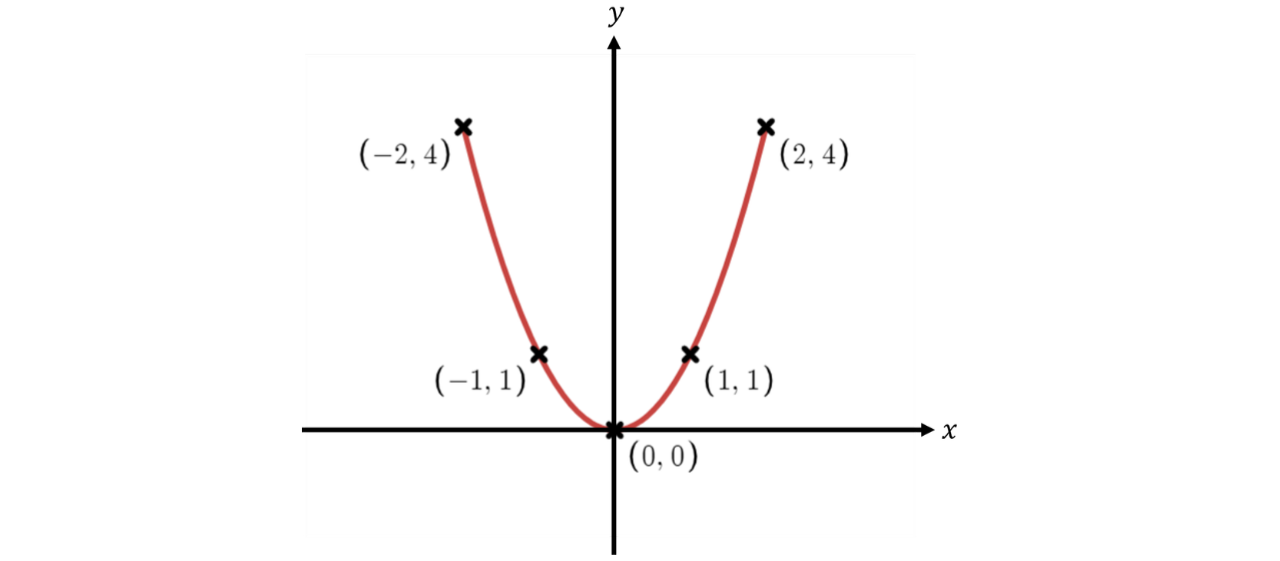
a) Given complete the table to sketch

Step 1: Complete the table by substituting the values of into the equation to find the corresponding values of
We start with
Therefore, we get the following completed table.

Step 2: Use the completed table of values to sketch the curve of
We plot the coordinates taken from the table and then connect them with a curve.
b) Write down an expression for
Single Step: is the input, which we substitute in place of the
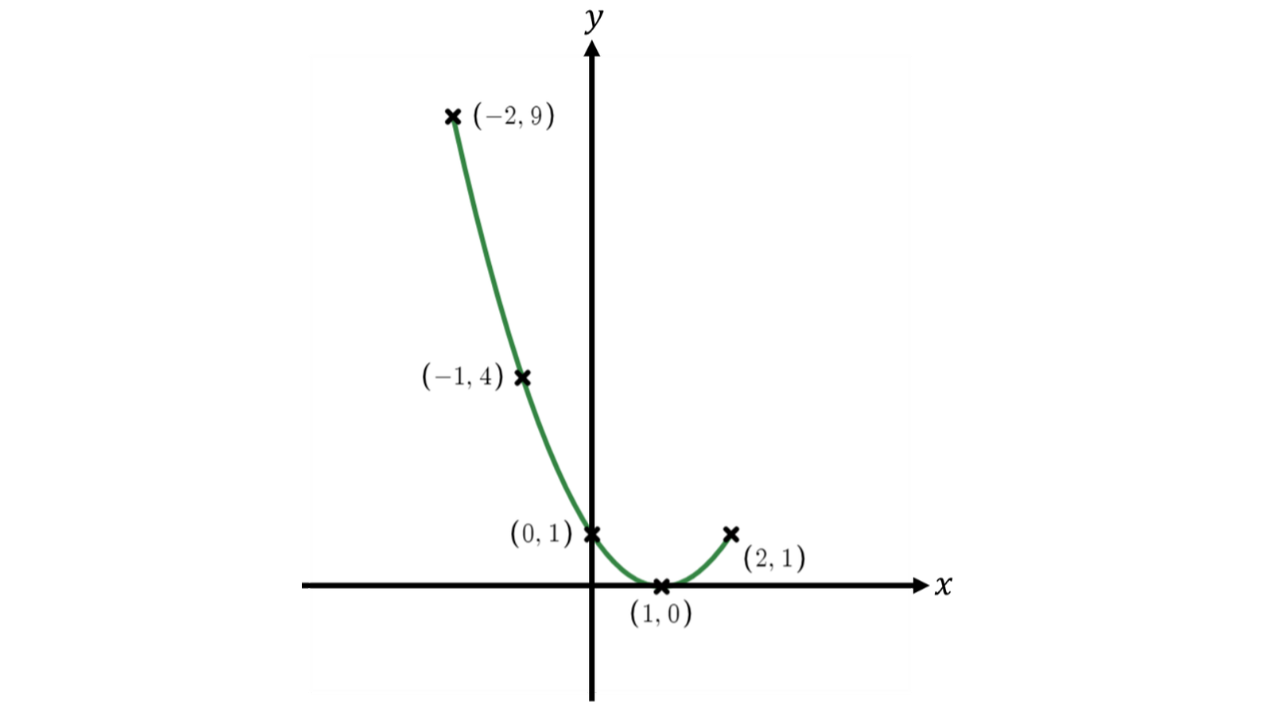
c) Use the table of values as an aid to sketch

Step 1: Complete the table by substituting the values of into the equation to find the corresponding values of
Therefore, we get the following completed table.

Notice that the values have shifted unit to the right when going from to

For example, whereas occurs when
Step 2: Use the completed table of values to sketch the curve of
We plot the coordinates from the table and join them with a curve.
Here is a diagram to visualise the transformation and compare the graphs of and
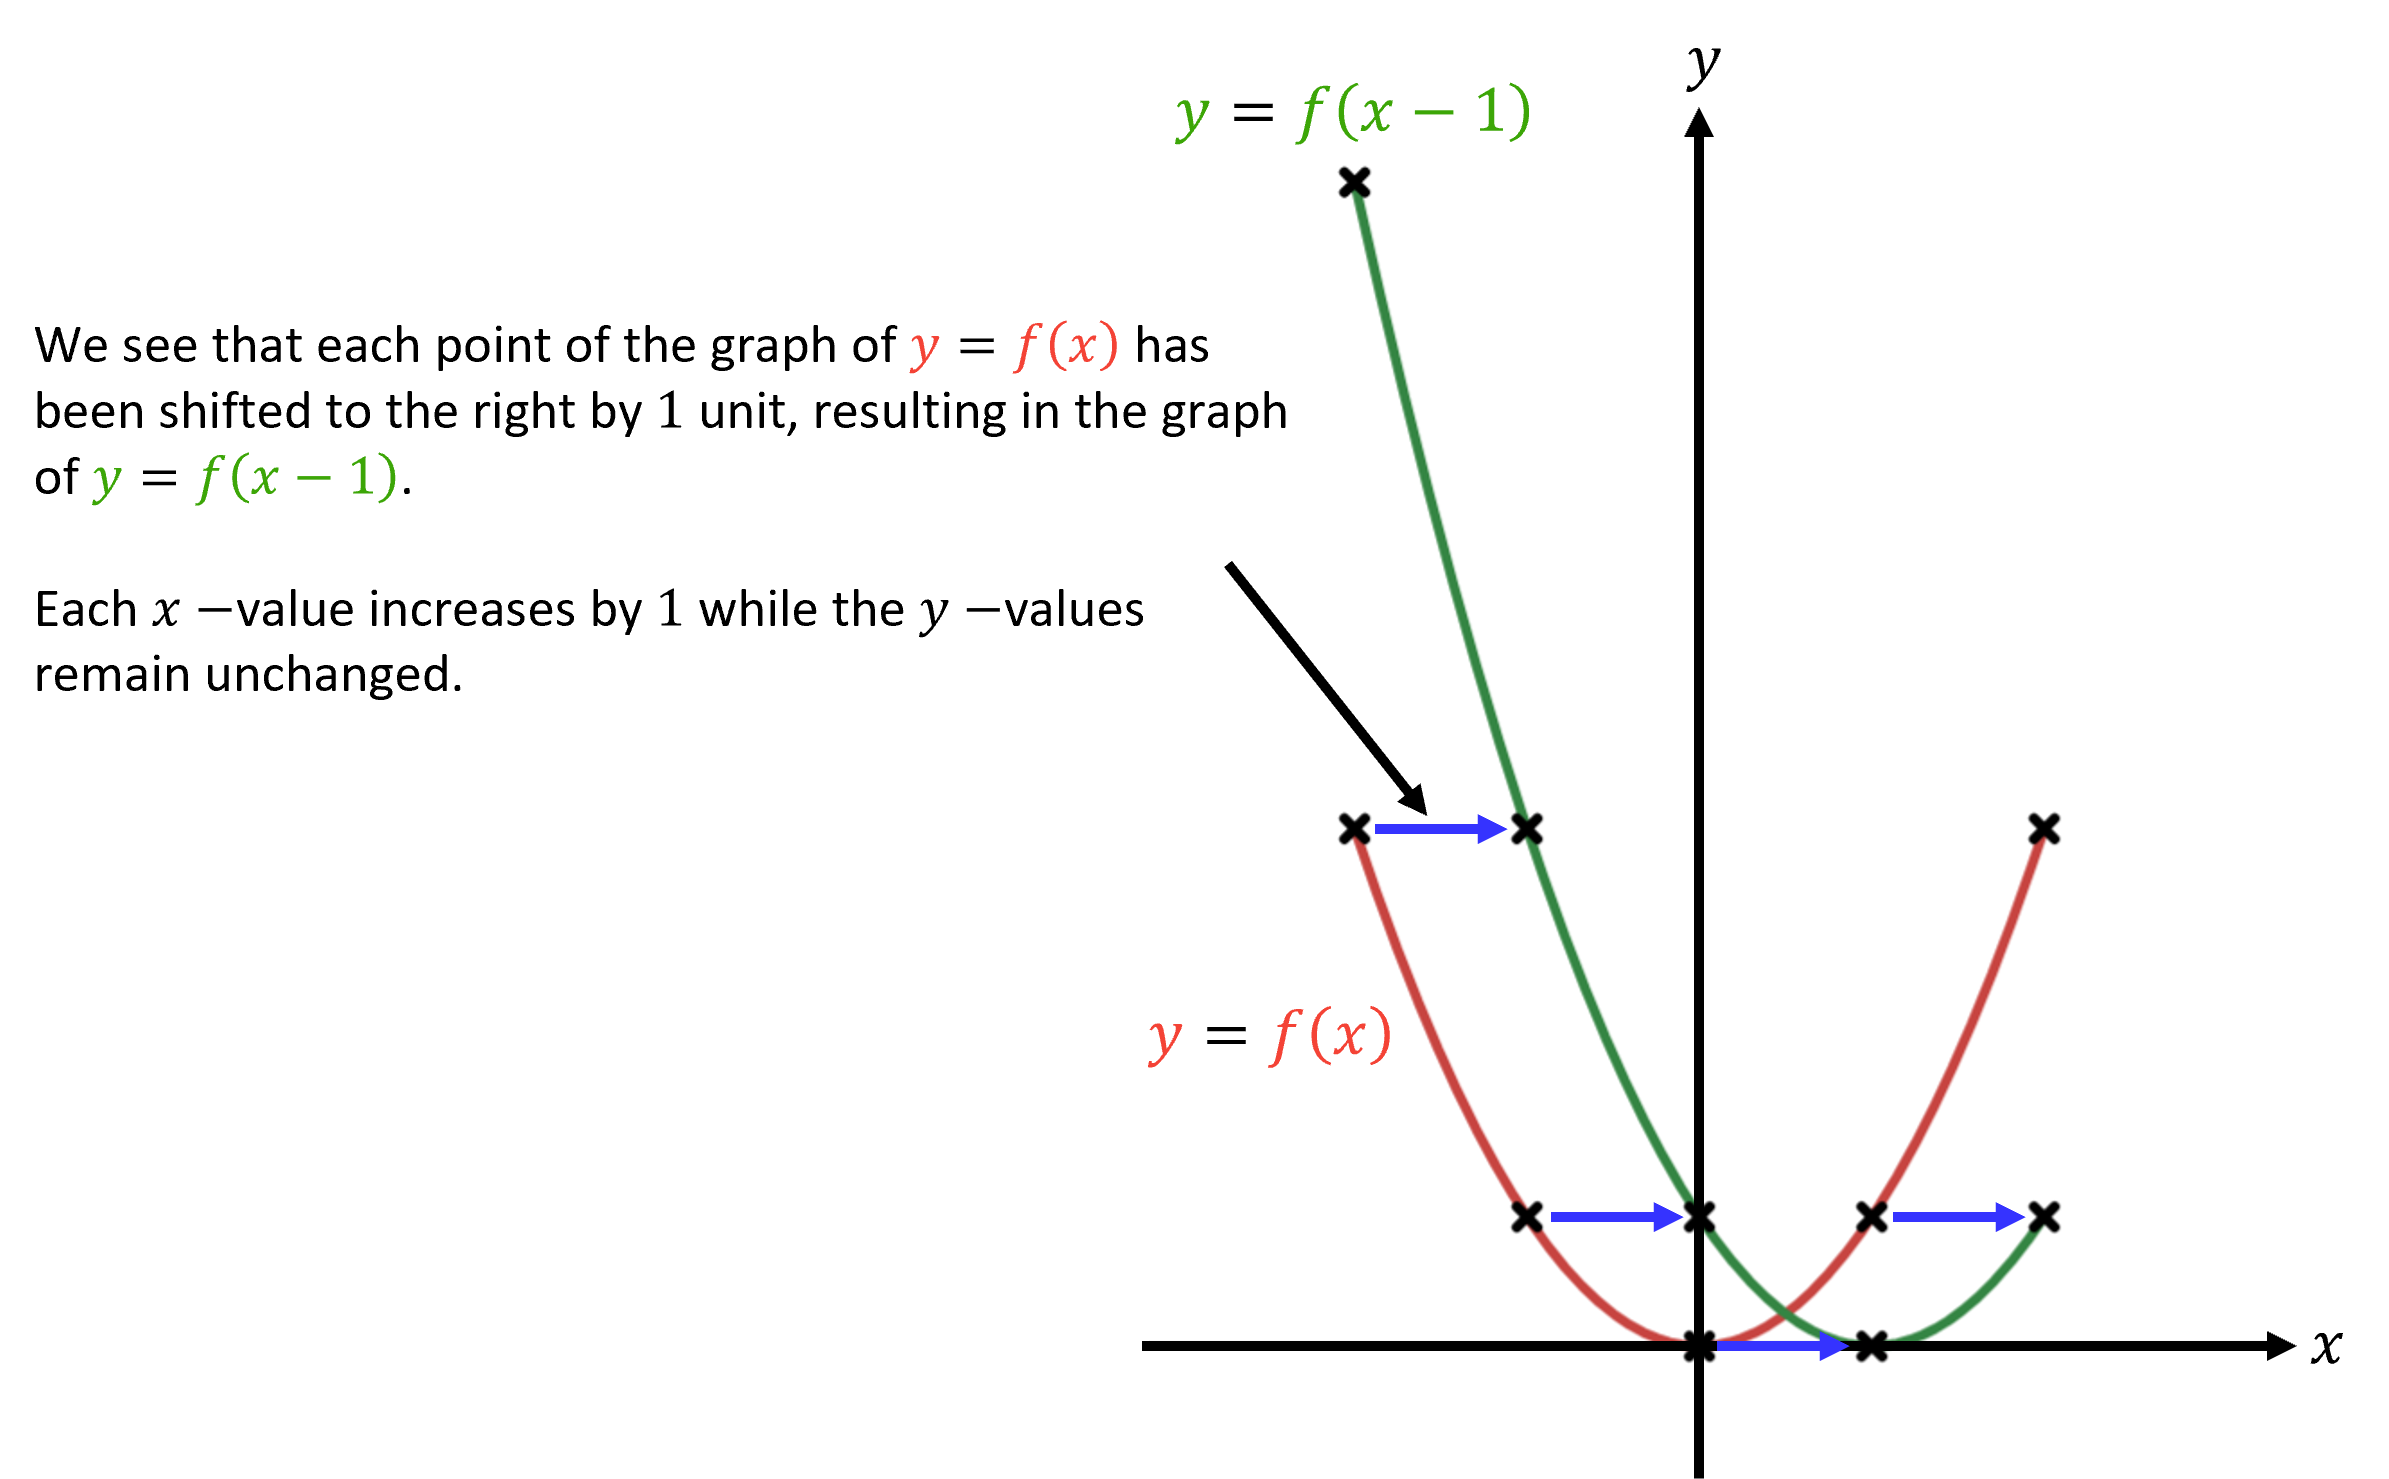
d) Describe the transformation from to
This is a translation by the vector
Reflections
Reflections involve flipping a graph in a line to produce a mirror image. The shape and size of the graph remain unchanged, but its orientation reverses.
We describe reflections by comparing a new function with the original function
In GCSE, we only need to know the reflections of functions in the and axes.
Here is what happens when we apply reflections to
The graph is reflected in the axis.
If the negative is on the outside of the function, we are multiplying the values by so they change sign and the graph flips upside down.
For instance, a point would become
The graph is reflected in the axis.
If the negative is on the inside of the function, we are dividing the values by (the same as multiplying by so they change sign and the graph flips from left to right.
For instance, a point would become
Example 2:
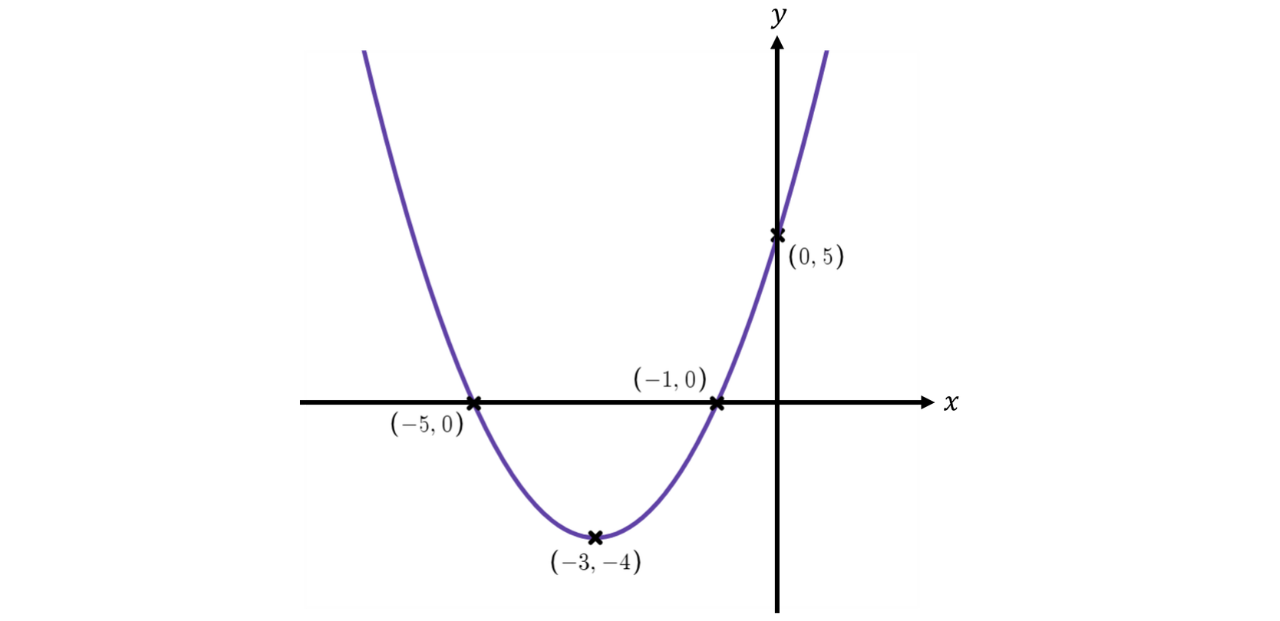
The figure shows the graph of with its intercepts with the axes and turning point labelled.
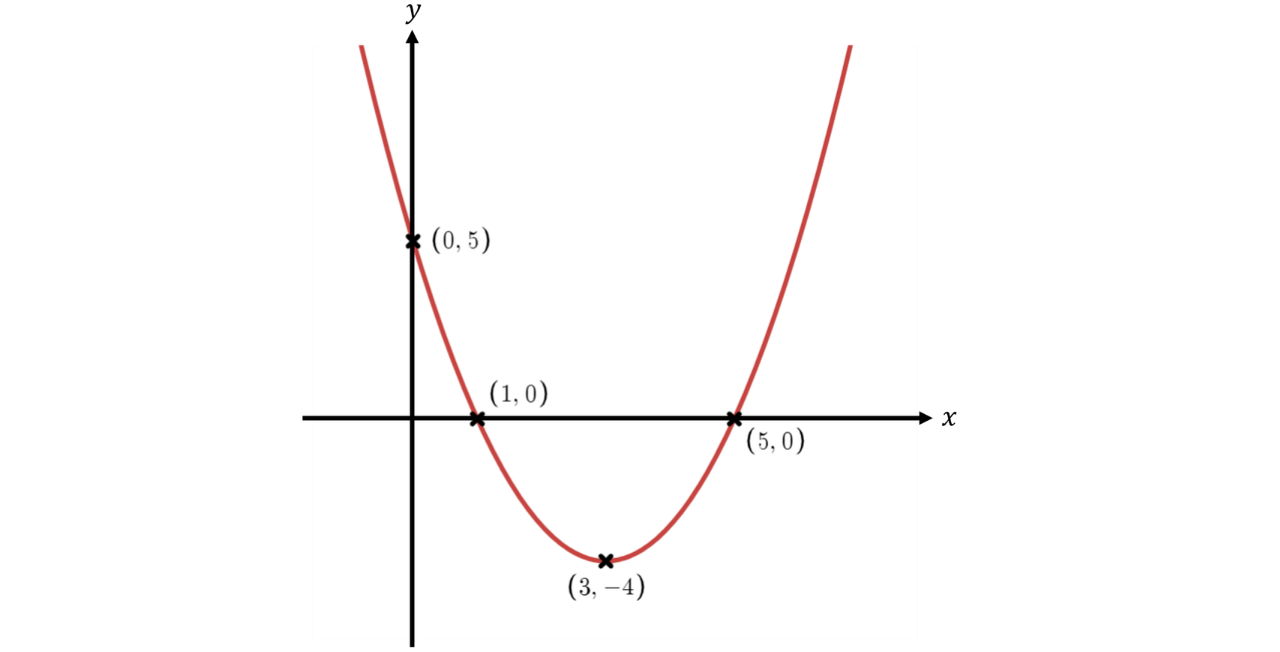
a) Find an expression for
Single Step: is the input, which we substitute in place of the
b) Sketch the graph of
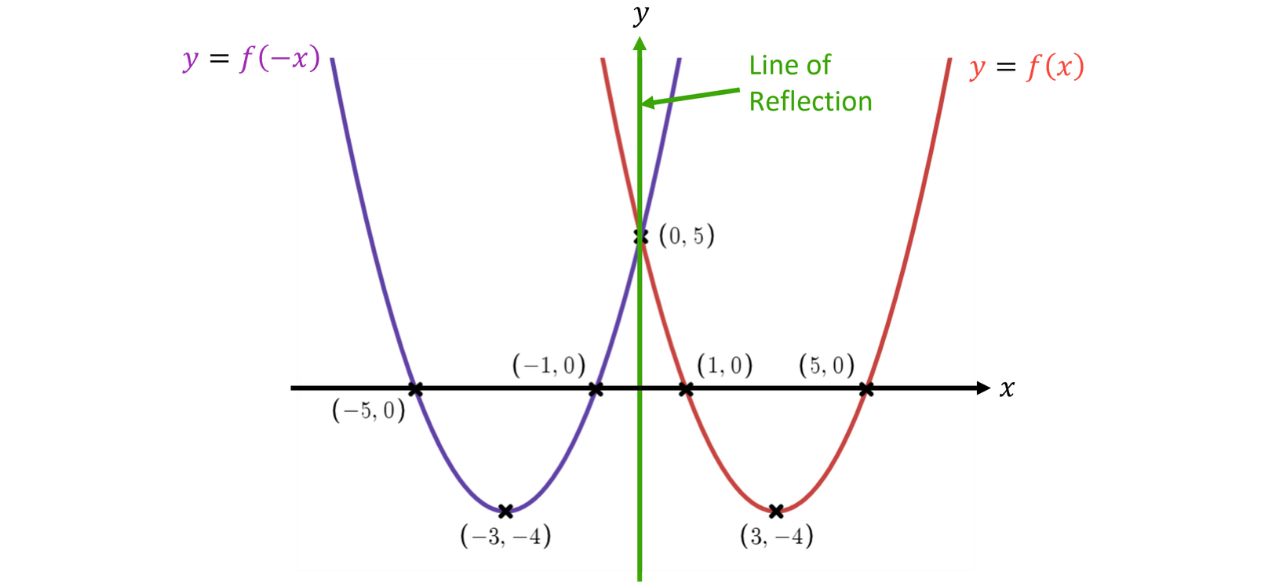
Single Step: This is a reflection in the axis, so all values change sign.
Here is a diagram to visualise the transformation and compare the graphs of and
Enlargements (IGCSE, GCSE Further Maths and A-Level Maths only)
Note: In GCSE Maths, graph transformations are limited to translations and reflections only. Enlargements/stretches are no longer required in the specification. They are included here, as an extension, because they are covered in IGCSE, GCSE Further Maths, and A-Level Maths.
Enlargements involve changing the size of a graph without changing its orientation.
Enlargements scale the graph by a constant factor. We describe enlargements by comparing a new function with the original function
Here is what happens when we apply enlargements to
The graph is enlarged by a scale factor of parallel to the axis (horizontal enlargement).
The graph is enlarged by a scale factor of parallel to the axis (vertical enlargement).
Note: Similar to translations, horizontal enlargements work in the opposite way to the number inside the function. If the graph is scaled by a factor of parallel to the axis.
For example, enlarges the graph by a scale factor of parallel to the axis, not (so we divide the values by instead of multiplying them by
Example 3:
The figure shows the graph of in the interval
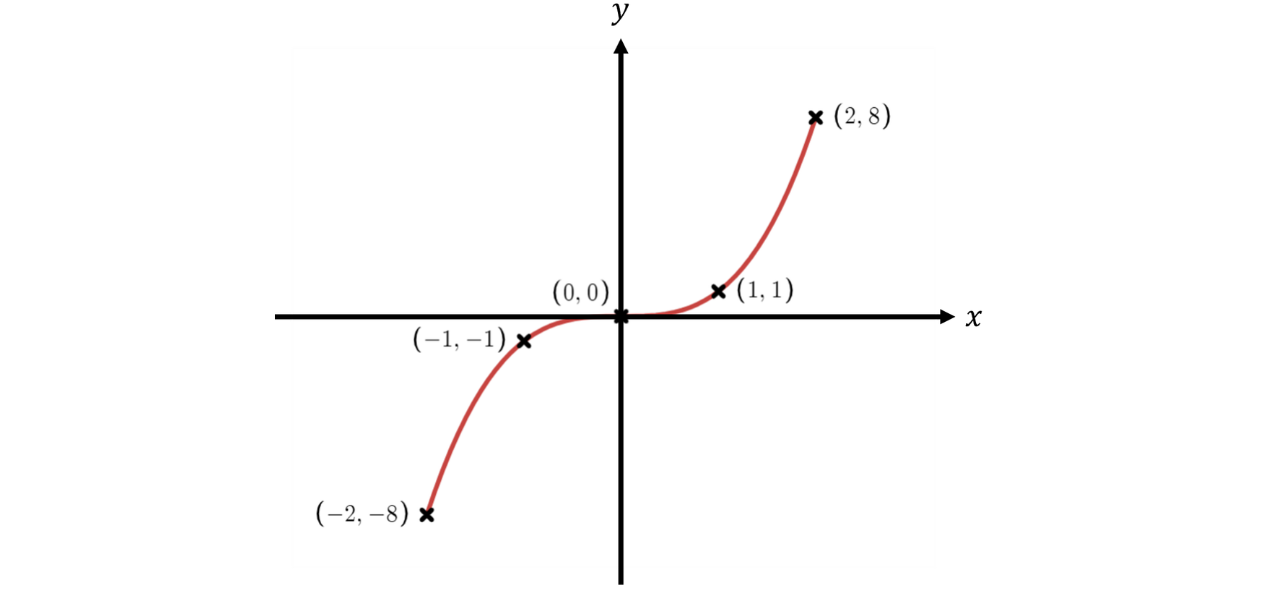
a) Write down an expression for
Single Step: The is outside the function so it multiplies the output of the function by
b) Describe the transformation from to
Single Step: The is outside the function so it affects the values. Each value is multiplied by
This is an enlargement by a scale factor of parallel to the axis.
c) Hence, sketch the graph of
Single Step: Sketch the graph by enlarging by a scale factor of parallel to the axis.
The overall shape and orientation of the graph remain unchanged. Only the values are multiplied by while the values stay the same.
For example, the point on the graph of is transformed to become on the graph of
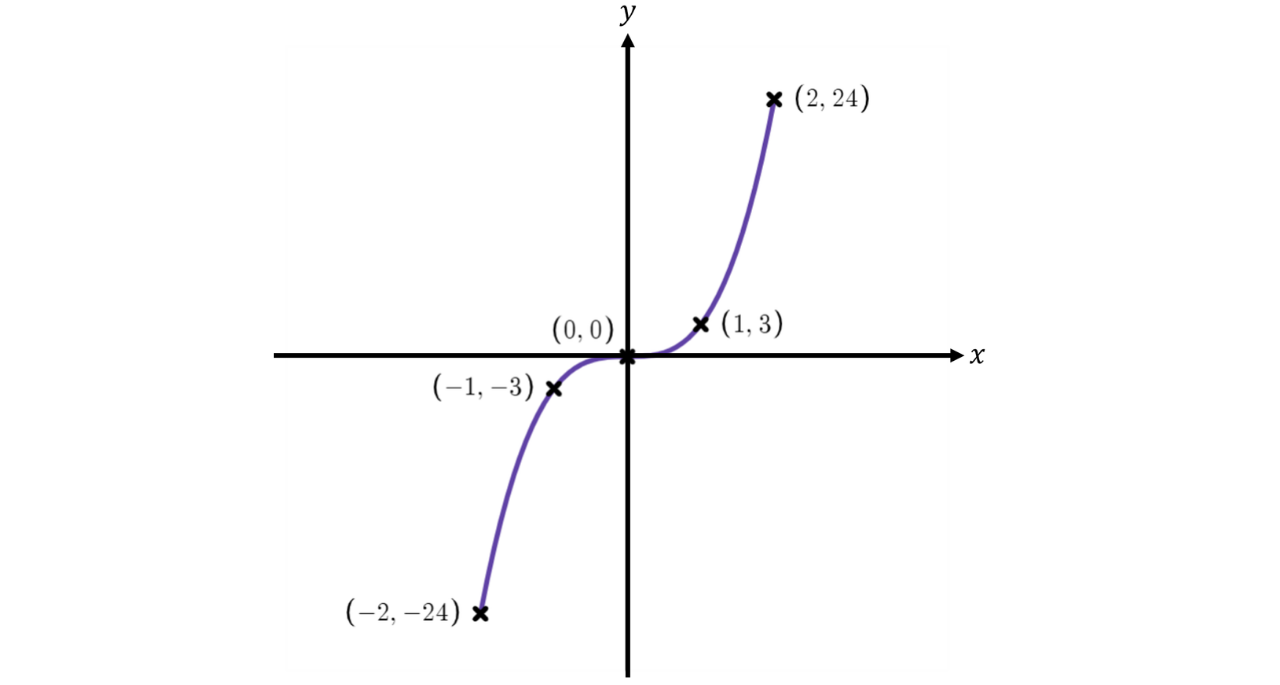
Here is a diagram to visualise the transformation and compare the graphs of and To note, only some points have been shown for clarity.
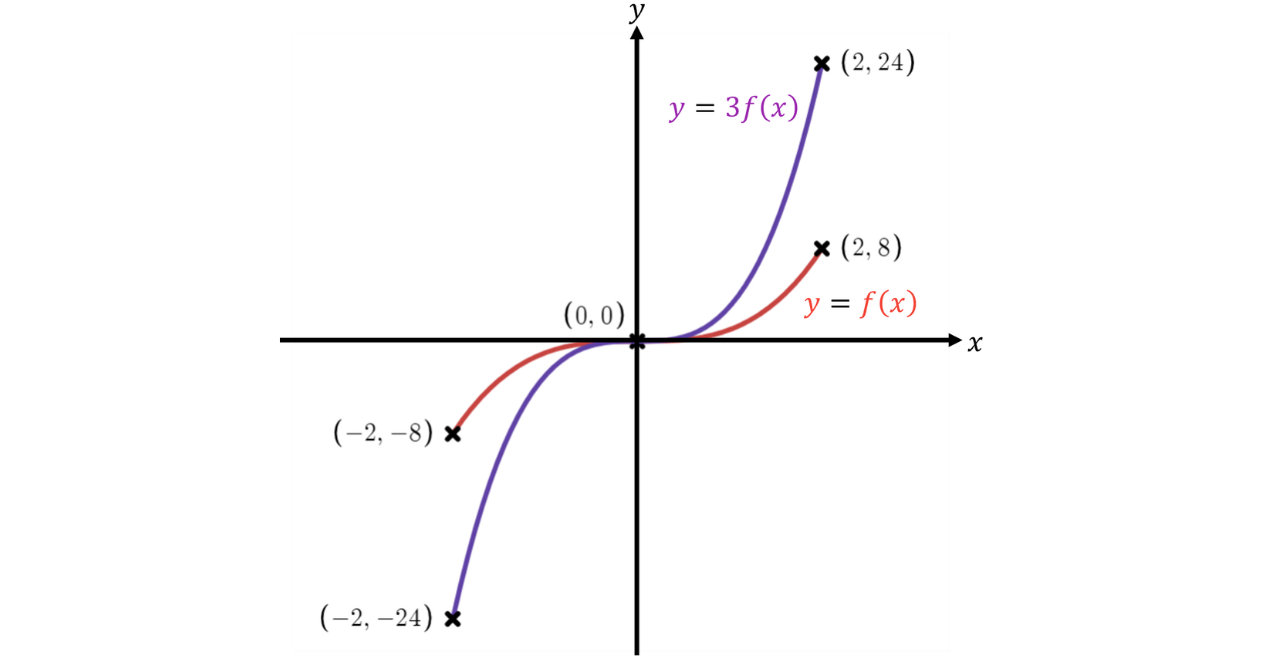
Here, we see that the graph of has been stretched parallel to the axis by a scale factor of multiplying all values in the process and resulting in the graph of
Mixed Questions

Example 4:
Describe the transformations from to:
a)
Single Step: The is inside the function, so it affects the values. The transformation will be in the opposite direction to the sign, so the graph is shifting units to the left.
This is a translation by the vector
b)
Single Step: The is outside the function, so it affects the values. The transformation will be as it says and we multiply all values by
This is an enlargement by a scale factor of parallel to the axis.
c)
Single Step: The is outside the function, so it affects the values. The transformation will be as it says so the graph is shifting units downwards.
This is a translation by the vector
d)
Single Step: The is inside the function, so it affects the values. The transformation will have the opposite effect to what it says so we multiply all values by instead of
This is an enlargement by a scale factor of parallel to the axis.
e)
Single Step: Here, we have a inside the function and a on the outside of the function. So, both the and values are affected. The graph shifts units to the right and units up.
This is a translation by the vector
Example 5:
A point lies on a curve What is the image of this point after the following transformations?
Note: The image of a point is the point that we get when we apply transformations to the original point.
a)
Single Step: This is a translation by the vector so we’re adding to the coordinate only. Therefore, after this transformation, the image of the point will be
b)
Single Step: This is a translation by the vector so we’re subtracting from the coordinate only.
Therefore, after this transformation, the image of the point will be
c)
Single Step: This is a reflection in the axis, so the sign of the coordinate will change or equivalently, we multiply the coordinated by
Therefore, after this transformation, the image of the point will be
d)
Single Step: This is an enlargement by a scale factor of parallel to the axis, so we multiply the coordinate by
Therefore, after this transformation, the image of the point will be
e)
Single Step: Here, we have two transformations. The inside the function represents a translation by the vector so we’re subtracting from the coordinate. The outside the function represents an enlargement by a scale factor of so we multiply the coordinate by
Therefore, after the transformation, the image of the point will be
Summary
Practice Question