Graphs of Functions
Neil Trivedi
Teacher

Contents
Graphs of Functions
A function is a rule that links each input value to exactly one output value Functions can be represented visually using graphs.
Graphs are drawn on a set of axes, where the axis represents the input and the axis represents the output.
Each point on a graph is written as a coordinate showing a pair of values that satisfy the rule in the function.
Different types of functions produce different graph shapes. At GCSE, we need to be able to recognise, interpret, and sketch these graphs, and use them to solve problems.
Linear Graphs
Linear equations are in the form
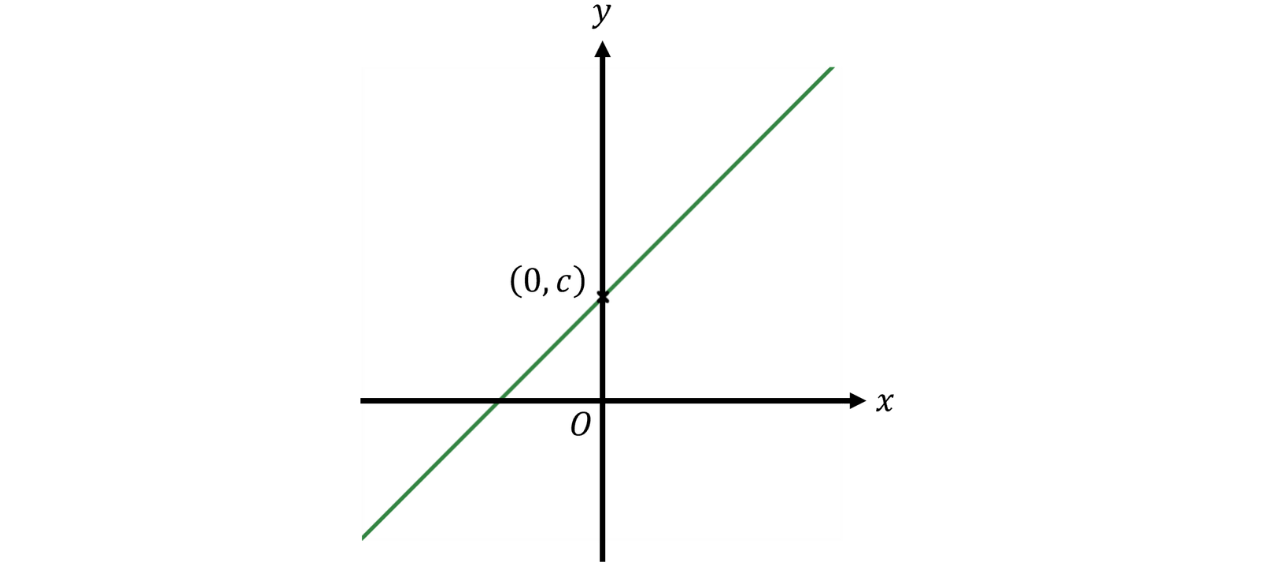
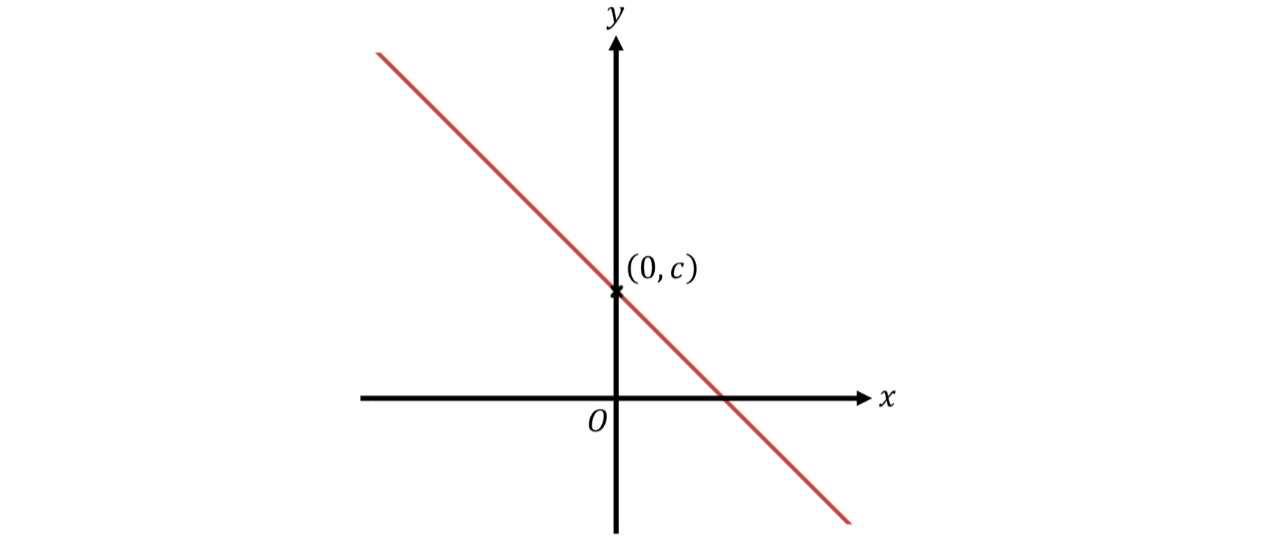
Linear equations are represented by straight lines, where is the gradient of the line and is the intercept, the point where the line crosses the axis.
Here is the graph of when (positive gradient) and (positive intercept).
Similarly, here is the graph of when (negative gradient) and
Quadratic Graphs
Quadratic equations are in the form
where
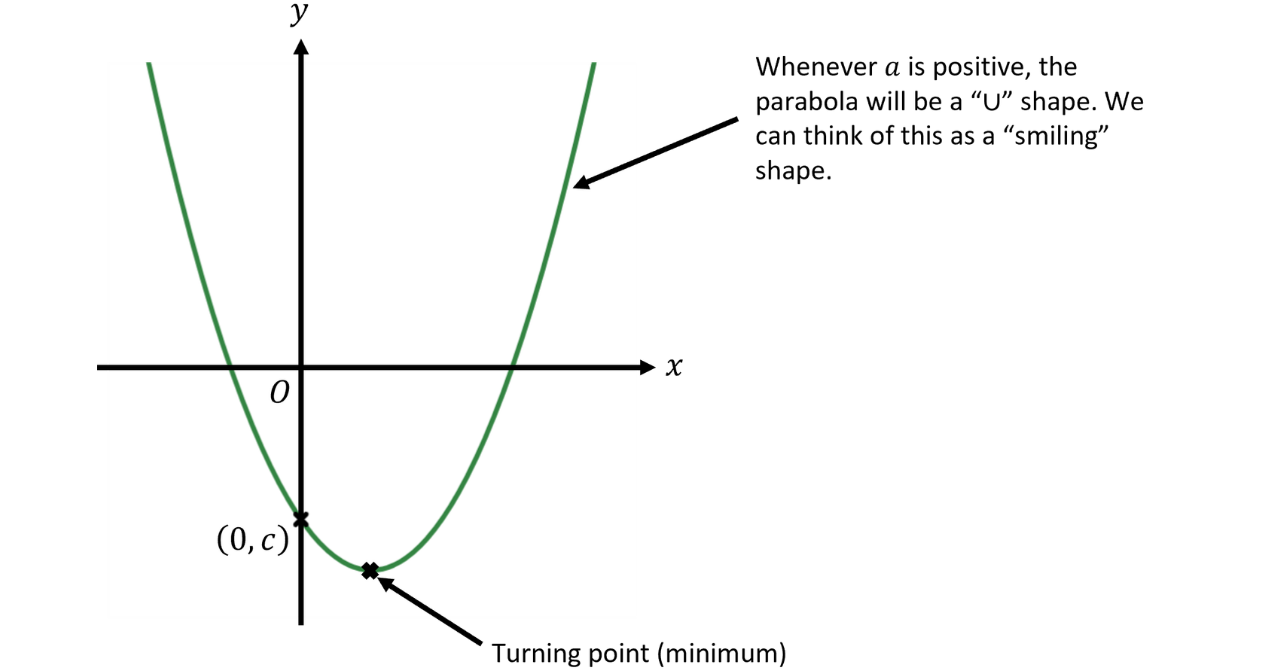
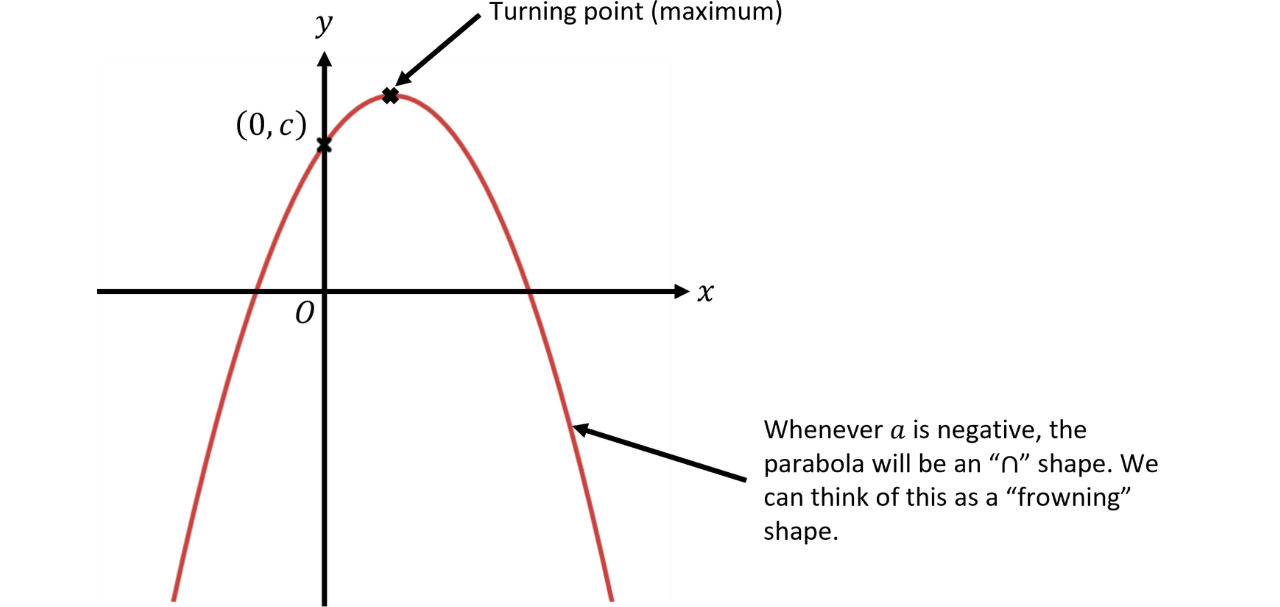
The graph of a quadratic is called a parabola. The value of is the intercept. The graph has a turning point, which is a minimum if or a maximum if All quadratics are symmetrical at the turning points.
Here is the graph of when and (intersects the negative axis).
Similarly, here is the graph of when and
Cubic Graphs
Cubic equations are in the form
where
The graph of a cubic is a smooth S-shaped curve, and the value of is the intercept. Below is the graph of when In this case, the value of is so the intercept is at the origin.
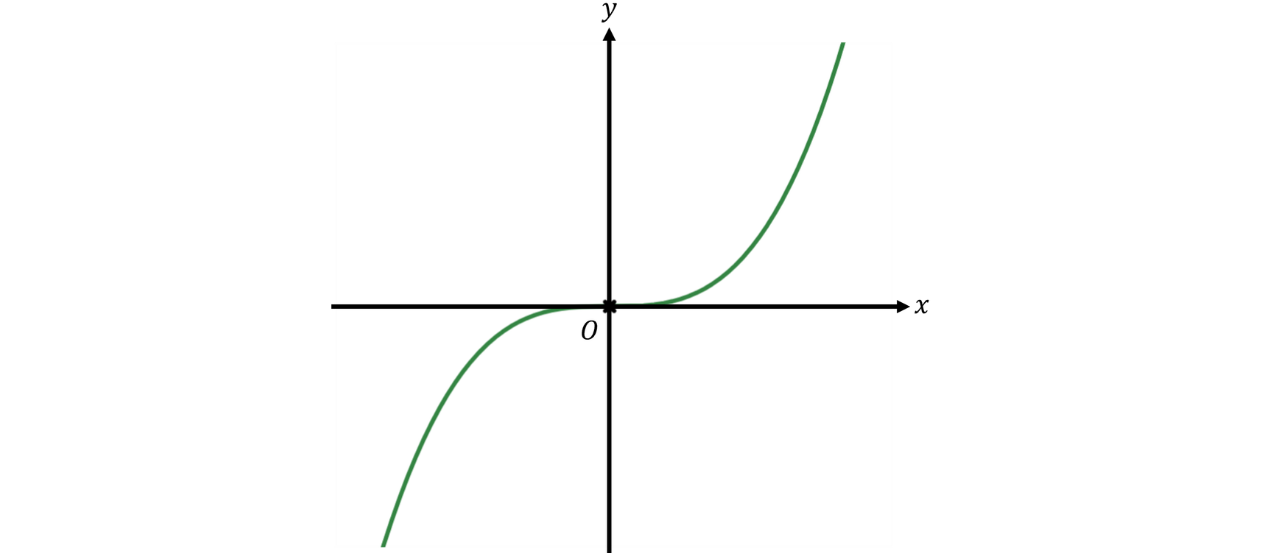
Similarly, here is the graph of when
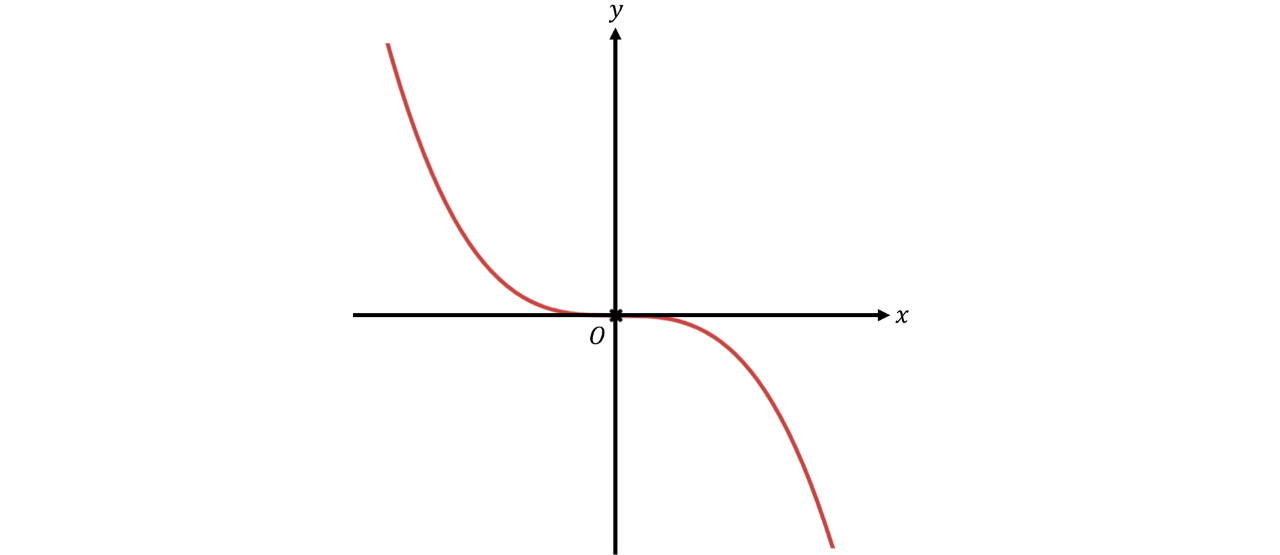
A typical cubic graph, with equation has two turning points. Here is a cubic graph where
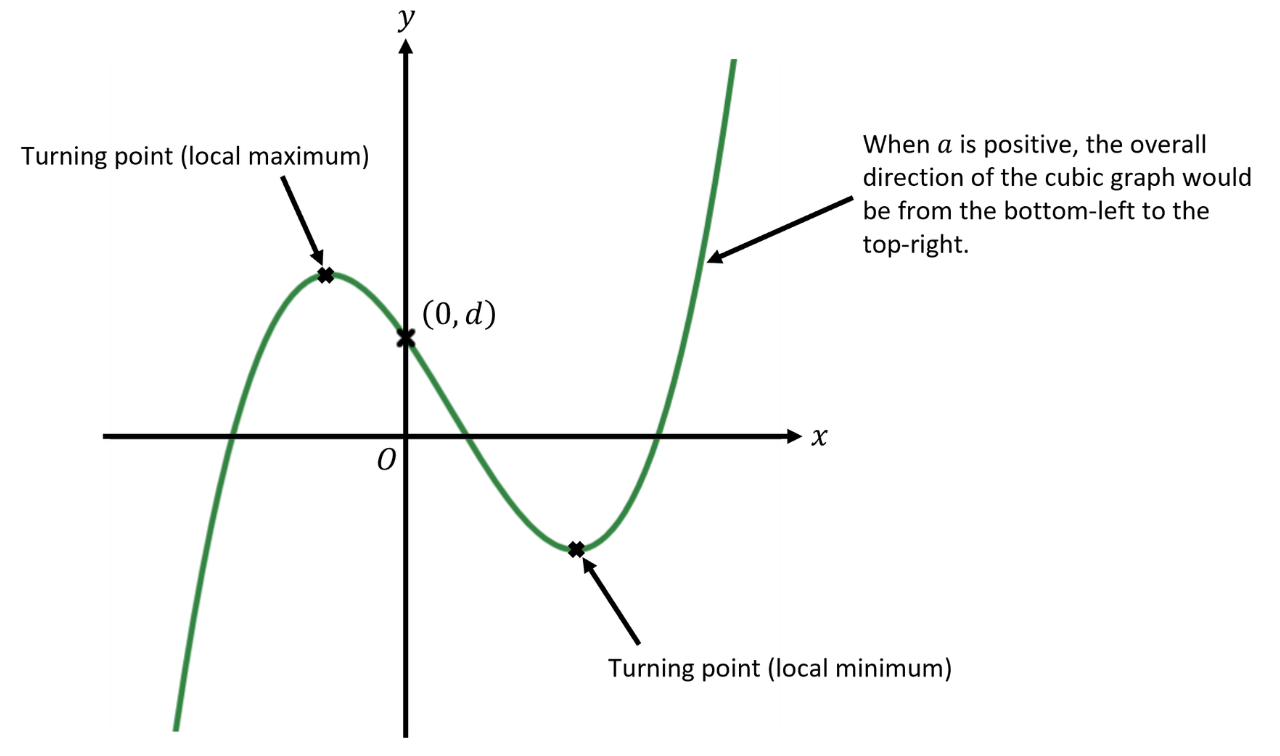
Similarly, here is a typical cubic graph where
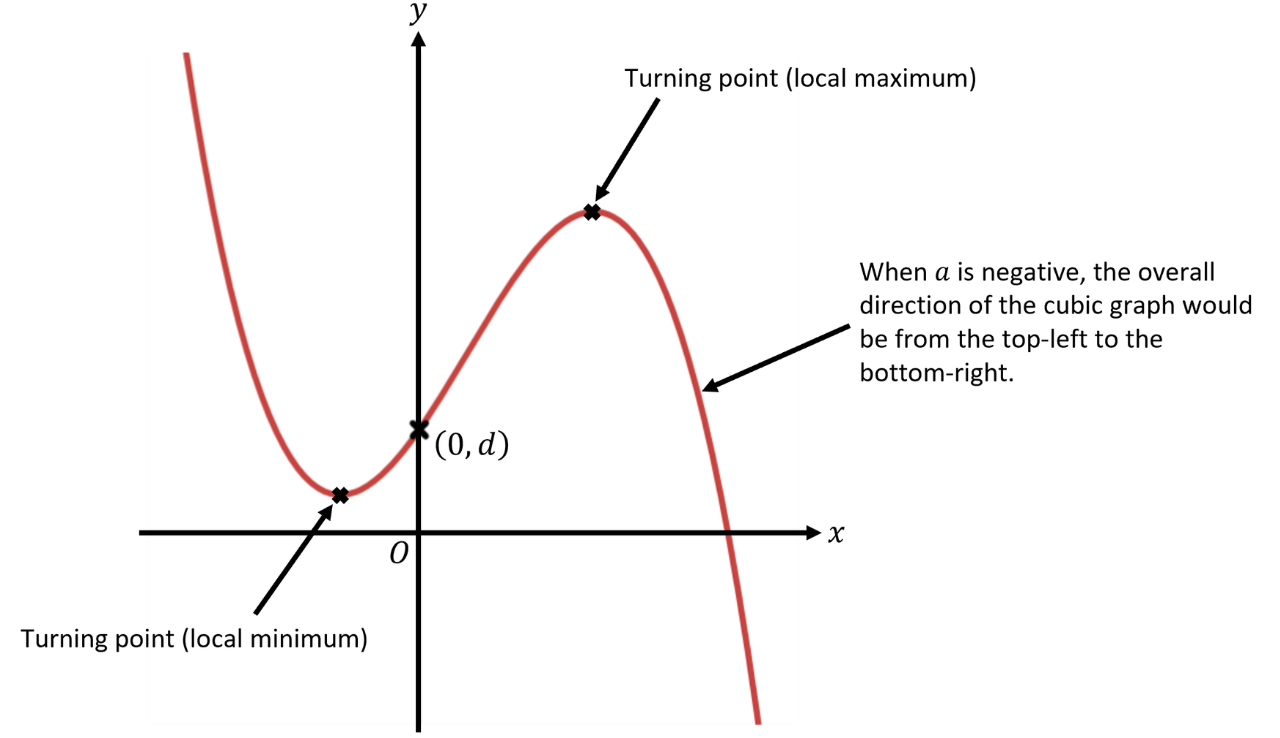
Reciprocal Graphs
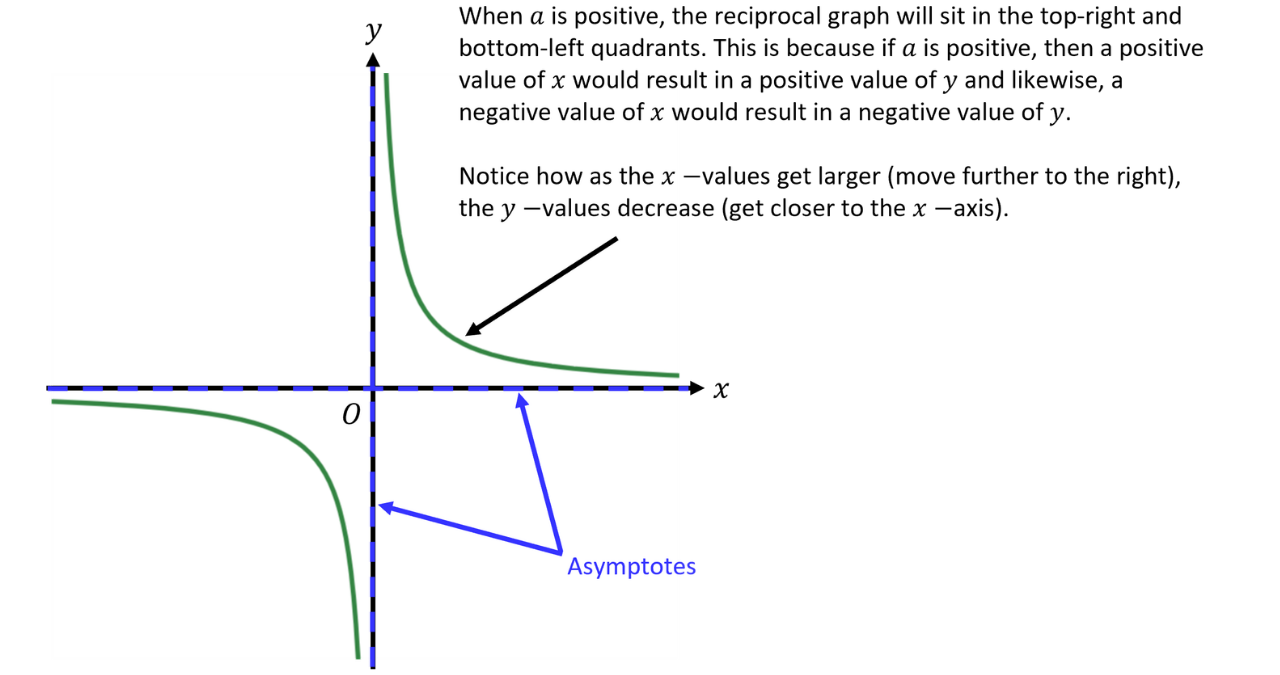
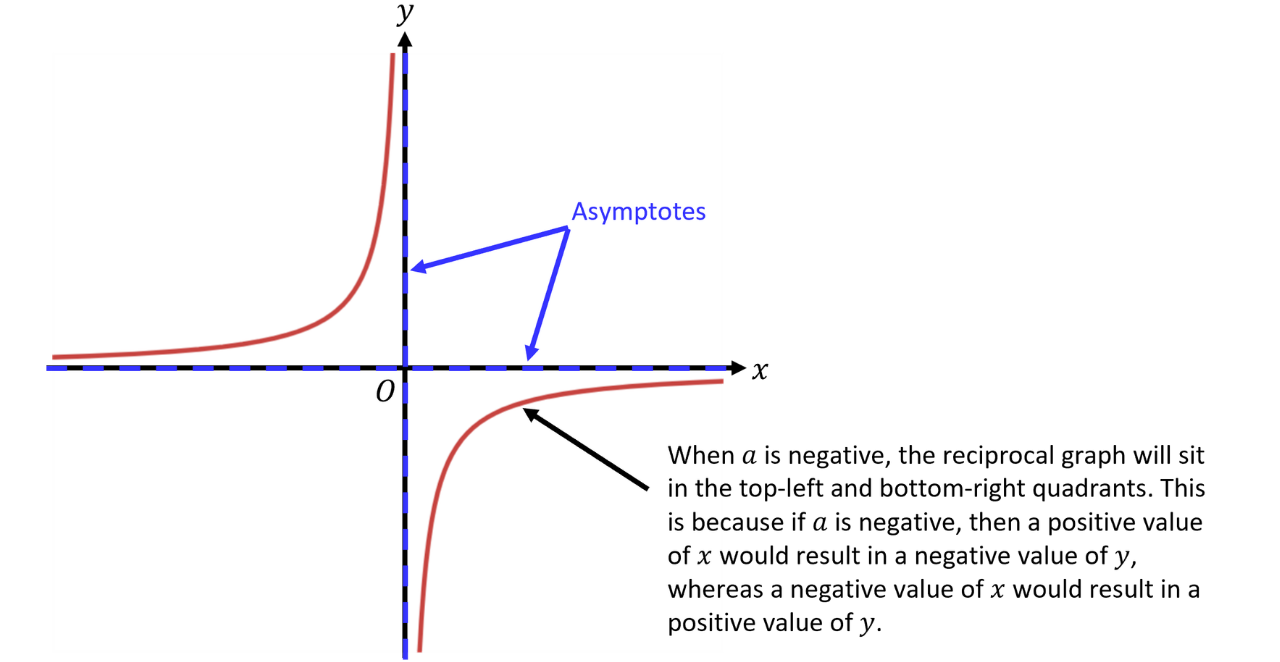
Reciprocal graphs show an inverse relationship between and where as increases, decreases, and vice versa. The equations of these graphs are of the form
where is a constant and The and axes are asymptotes, meaning the graph gets very close to them but never meets or crosses them. Here is the graph of when
Similarly, here is the graph of when
Exponential Graphs
An exponential graph shows a relationship where a quantity increases or decreases by a constant factor. Exponential functions can be used to model real-life situations such as population growth or radioactive decay. The equations of these graphs are in the form
where and
Notice how is in the power here (also known as the exponent, hence why we call them exponential graphs).
To find the intercept, we must substitute which, in this case, gives us:
Recall, from the index rules, that if we raise anything to the power of we get So,
Therefore, the intercept is
The axis is an asymptote, meaning that the graph gets very close to it but never meets or crosses it.
Here is the graph of when and
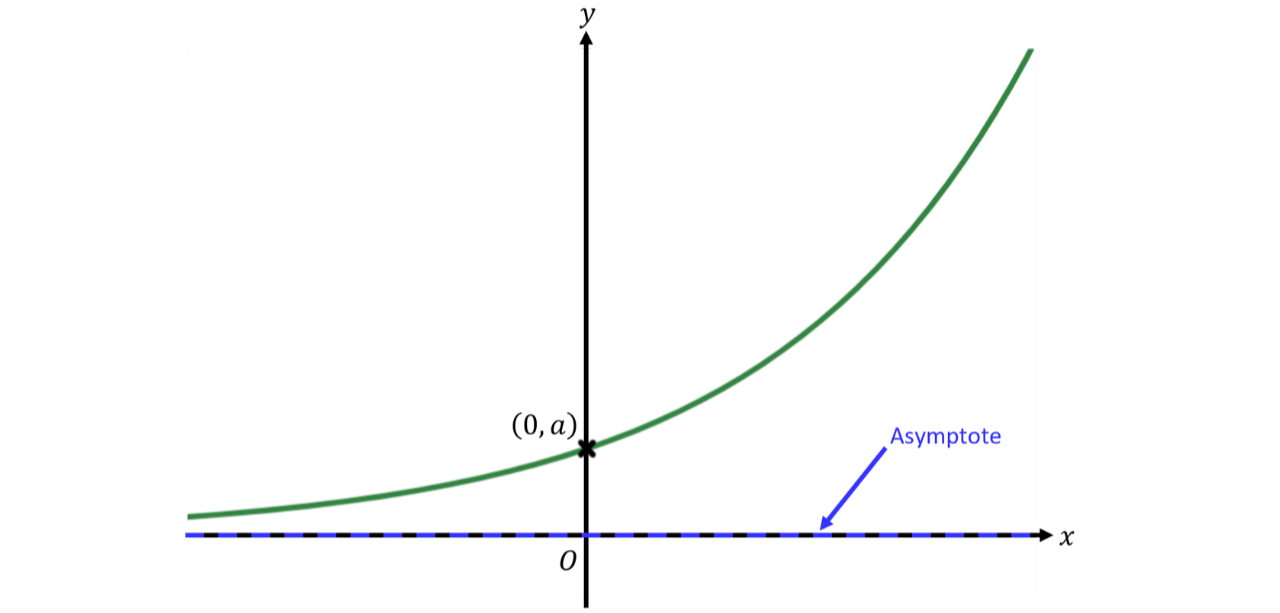
This graph is showing exponential growth. As increases, also increases.
Similarly, here is the graph of when and
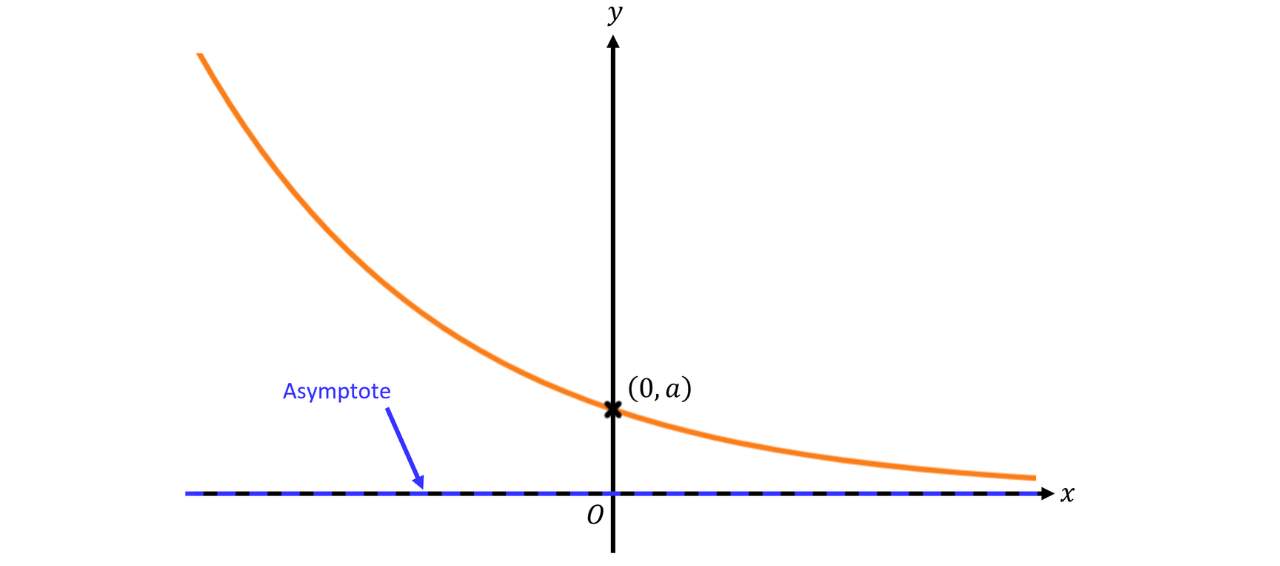
The graph is showing exponential decay. As increases, decreases. The important condition is When a number between and is raised to higher powers, the result of becomes smaller and smaller.
Take the graph of as an example. Let’s substitute some values of to see what happens.
We can see that as the power (the value of increases, the value of decreases, so the graph trends downwards towards (the axis) as increases but it never reaches it.
This decay graph can also be linked to exponential growth. For example, using our index rules, we can rewrite the graph of as
We can get the graph of by reflecting the graph of in the axis. Therefore, we can think of exponential decay graph as the reflection in the axis of the exponential growth graph.
If the graph is reflected in the axis, so all values become negative while the values stay the same.
Please read our study note on Transformations of Functions for more on these.
Example 1:
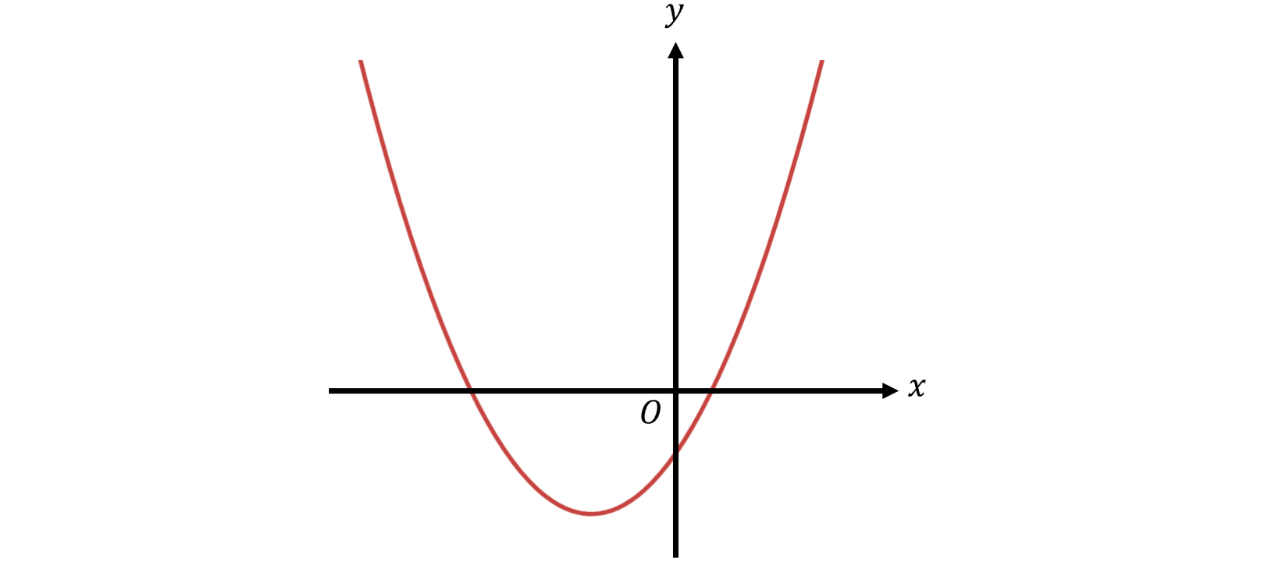
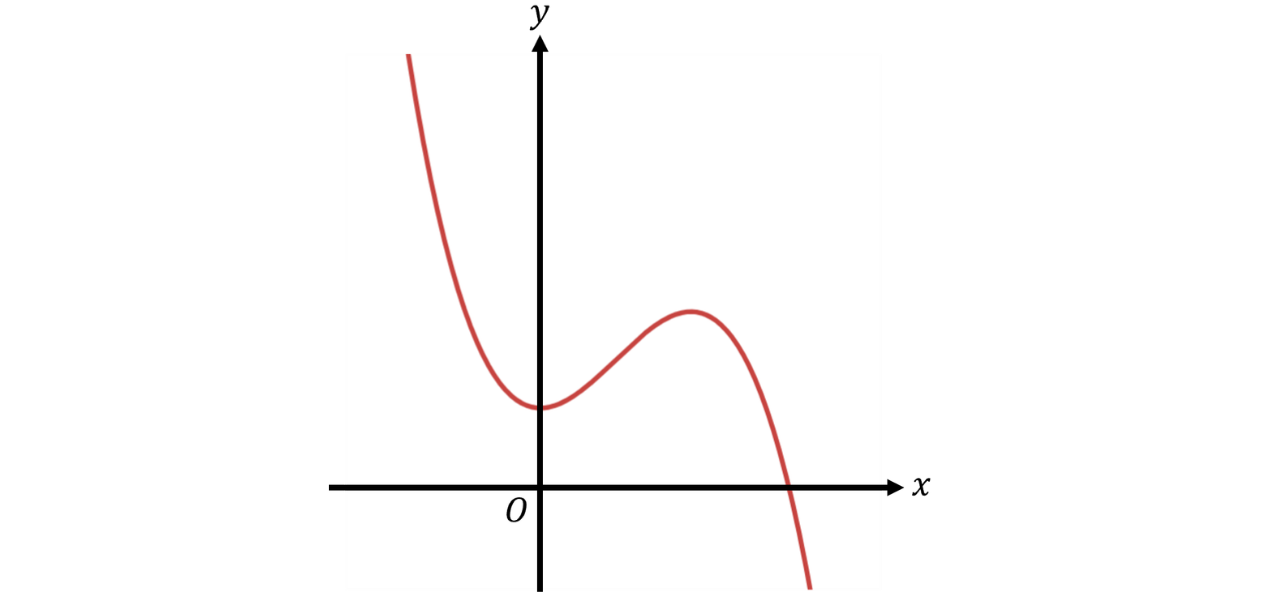
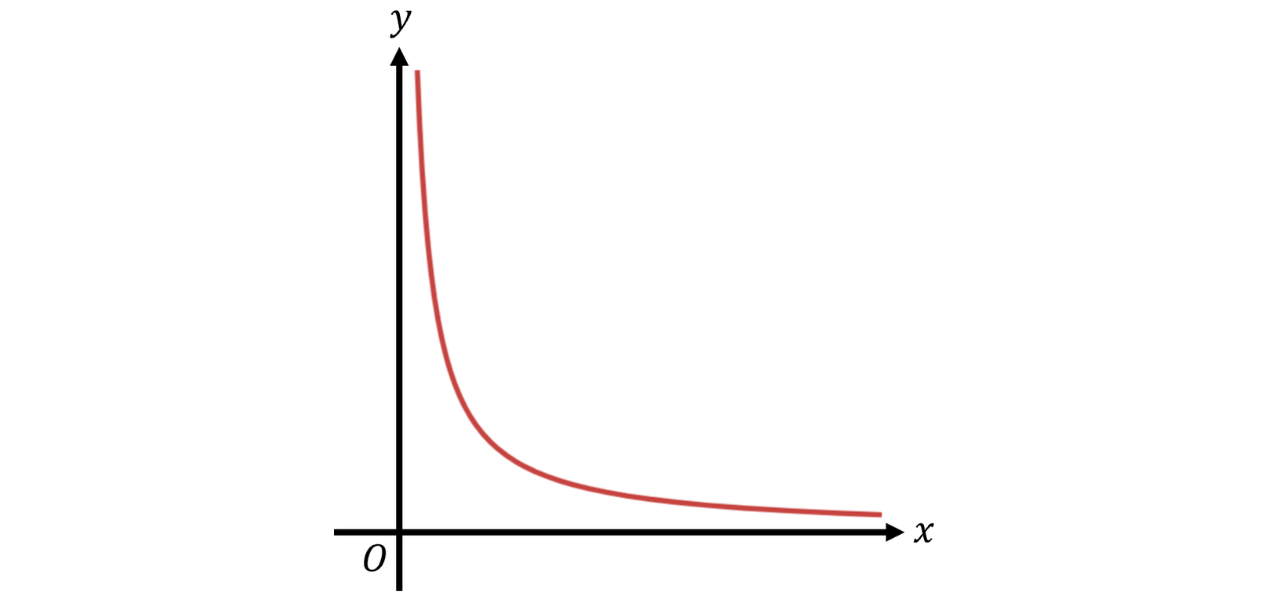
Identify a possible equation for the following graphs:
a)
A:
B:
C:
D:
Let’s consider each option and identify the type of graph it represents:
A is a linear equation, which is represented by a straight line.
B is a quadratic equation, which is represented by a parabola. The coefficient of the term is positive, so the curve is U-shaped.
C is a cubic equation, which is represented by an S-shaped curve. The coefficient of the term is positive, so the overall direction of the curve is from the bottom-left to the top-right.
D is an exponential function.
The graph shown has a U-shape, which is a quadratic graph, so B is the only possible equation for that.
b)
A:
B:
C:
D:
Let’s consider each option and identify the type of graph it represents:
A is a reciprocal function which is positive, so it sits in the top-right and bottom-left quadrants.
B is a quadratic equation, which is represented by a parabola. The coefficient of the term is negative, so the curve is ∩-shaped.
C is a cubic equation, which is represented by an S-shaped curve. The coefficient of the term is positive, so the overall direction of the curve is from the bottom-left to the top-right.
D is also a cubic equation. The coefficient of the term is negative, so the overall direction of the curve is from the top-left to the bottom-right.
The graph shown is a cubic graph, so the only options are C or D. However, the curve is going from the top-left to the bottom-right, which means the coefficient of the is negative.
Therefore, D is the only possible equation for the graph shown.
c)
A:
B:
C:
D:
Let’s consider each option and identify the type of graph it represents:
A is a reciprocal function which is negative, so it sits in the top-left and bottom-right quadrants.
B is an exponential decay function.
C is a reciprocal function which is positive, so it sits in the top-right and bottom-left quadrants.
D is a linear equation, represented by a straight line.
The graph shows a reciprocal function because, as the value of increases, the value of decreases, and there are asymptotes at the and axes (it cannot be exponential because exponential graphs intersect the axis).
Therefore, the only options are A or C. The reciprocal graph is in the top-right quadrant, so it is positive.
Therefore, C is a possible equation.
Example 2:
The diagram shows a sketch of a curve with equation where and The curve passes through the points and
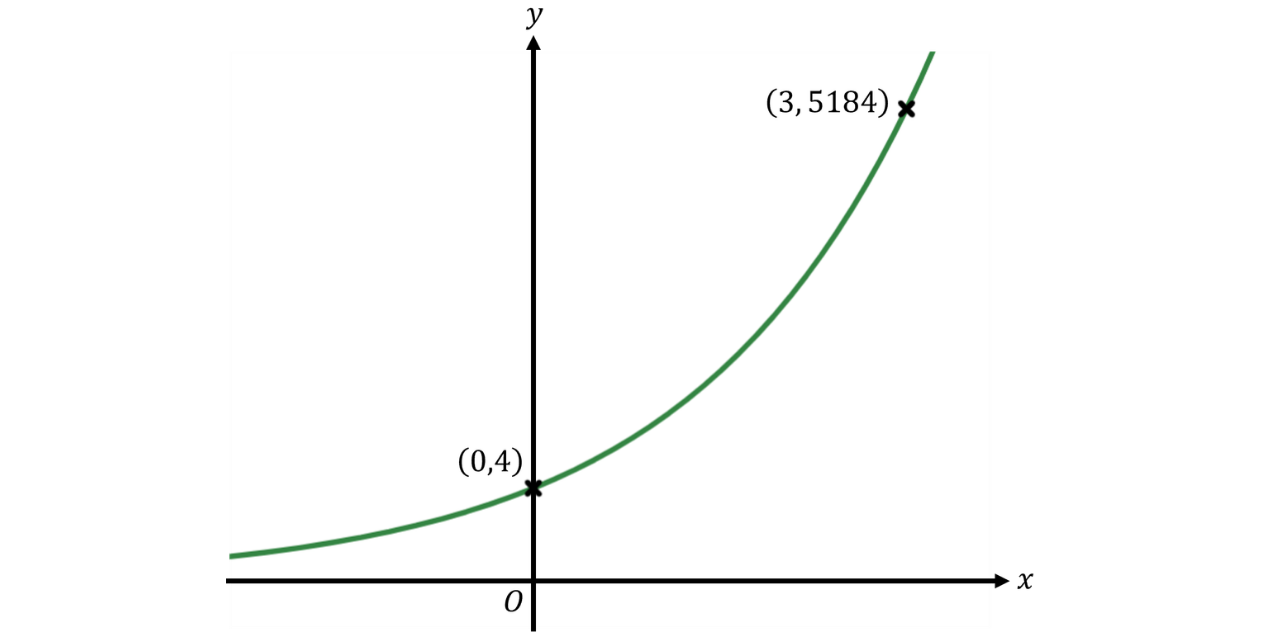
Work out the values of and
Step 1: Find the value of by using the intercept.
Here, we have an exponential graph and are given two coordinates. We will use these coordinates to find the values of and in the equation represented by the graph.
First, we use and substitute and into the equation.
Since
Step 2: Use the other coordinates and the value of we found to find the value of
Next, we use and we substitute and into the equation. We also replace with
Dividing both sides by
Cube rooting both sides to isolate
Practice Question