Sketching Quadratics
Neil Trivedi
Teacher

Sketching Quadratics
A quadratic is an algebraic expression in which the highest power of is Quadratic equations are typically written in the form
where and are constants and
In this note, we will explore sketching the graphs of quadratic equations.
The graph of a quadratic is called a parabola.
If the coefficient of is positive, the graph would be a U-shape.
If the coefficient of is negative, the graph would be a ∩-shape.
When first introduced to the topic of sketching quadratics, you may have used a table of values to help you, where you substitute some values of into the quadratic equation to obtain the corresponding coordinates, then plot the coordinates onto the graph, and then connect the points on the graph with a curve.
In the table, you’d notice the symmetry of values which is why it has that parabolic U-shape.
Here, we will explore another way to approach sketching quadratics, where we only need to consider three features.
Features to Consider when Sketching Quadratics
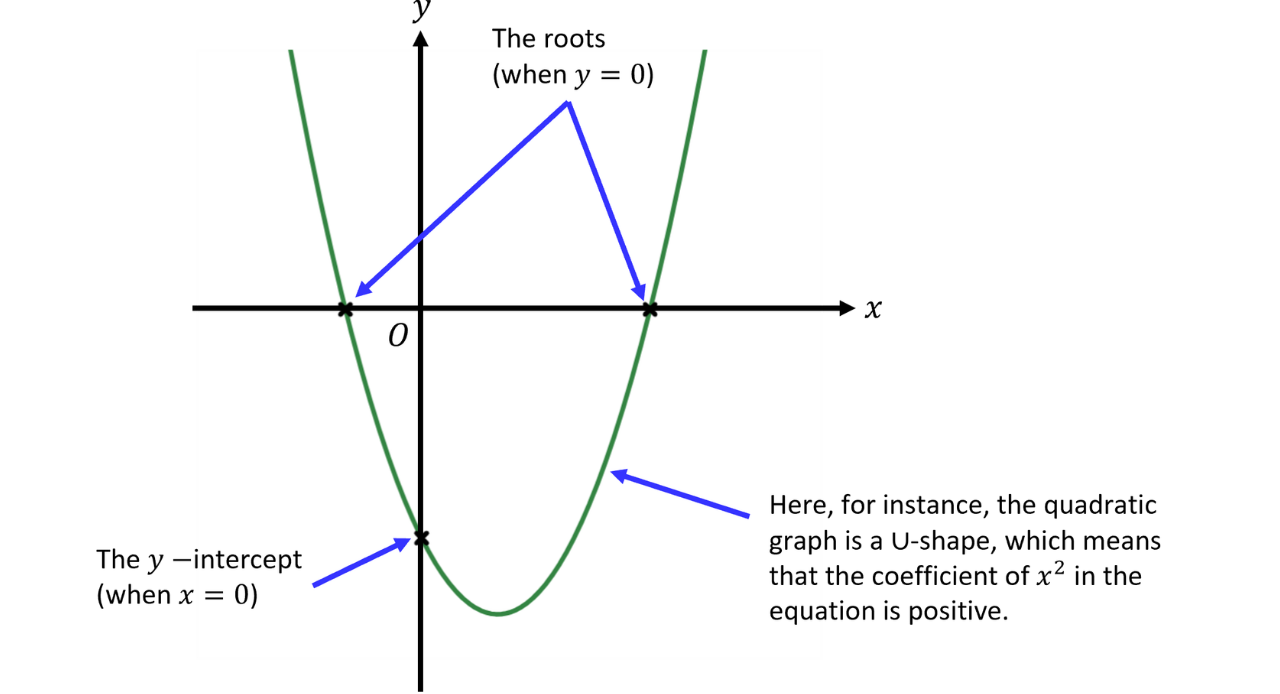
1) The roots
These occur when and we can find them using methods such as factorising the quadratic equation, completing the square, or using the quadratic formula.
2) The intercept
This is where the graph intersects the axis (when and is represented by in the equation.
3) The shape
We determine whether the quadratic graph would be like a U-shape or an ∩-shape by looking at whether the coefficient of is positive or negative.
Example 1:
Sketch
Step 1: Determine the roots of the quadratic, the intercept, and the shape of the curve.
The roots occur when so we set
This quadratic can be factorised, so we will use this method to find the roots. For more information on factorising quadratics, please read our Factorising Quadratics notes.
When we factorise the above equation, we get
Now, we set each bracket equal to and then solve each one for Starting with the first bracket,
Adding to both sides,
Next, we solve
Subtracting from both sides,
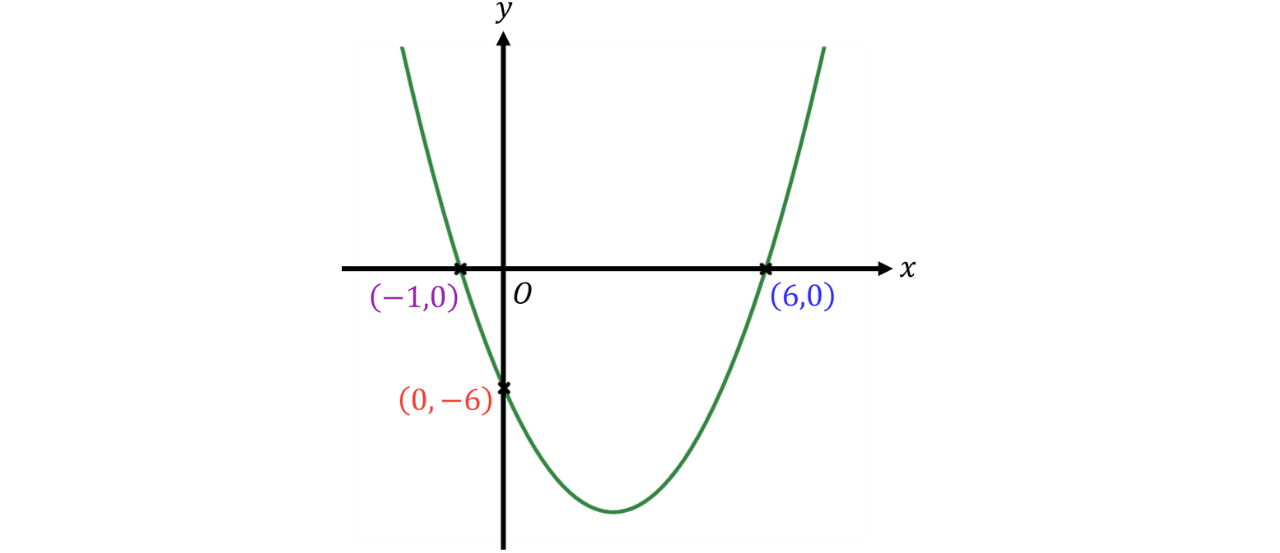
Therefore, the roots of the quadratic occur when and
Next, we determine the intercept. This occurs when which we substitute into the quadratic equation to find the coordinate.
Therefore, the intercept is Notice that the coordinate of the intercept is equal to the constant at the end of the quadratic, independent of (the value of Going forward, this is how we will find it rather than setting
Finally, to determine the shape of the curve, we look at the coefficient of In this case, the coefficient is which is positive, so the quadratic will have a U-shape.
Step 2: Use the information determined in step 1 to sketch the graph of the quadratic.
Using the three pieces of information from above, we would get the following sketch:
Example 2:
Sketch
Step 1: Determine the roots of the quadratic, the intercept, and the shape of the curve.
The roots occur when so we set
Firstly, we can move all the terms from the left-hand side to the right-hand side so that the is positive.
So,
This quadratic can be factorised using the difference of two squares principle and in doing so, we get
Now, we set each bracket equal to and then solve each one for Starting with the first bracket,
Subtracting from both sides,
Next, we solve
Adding to both sides,
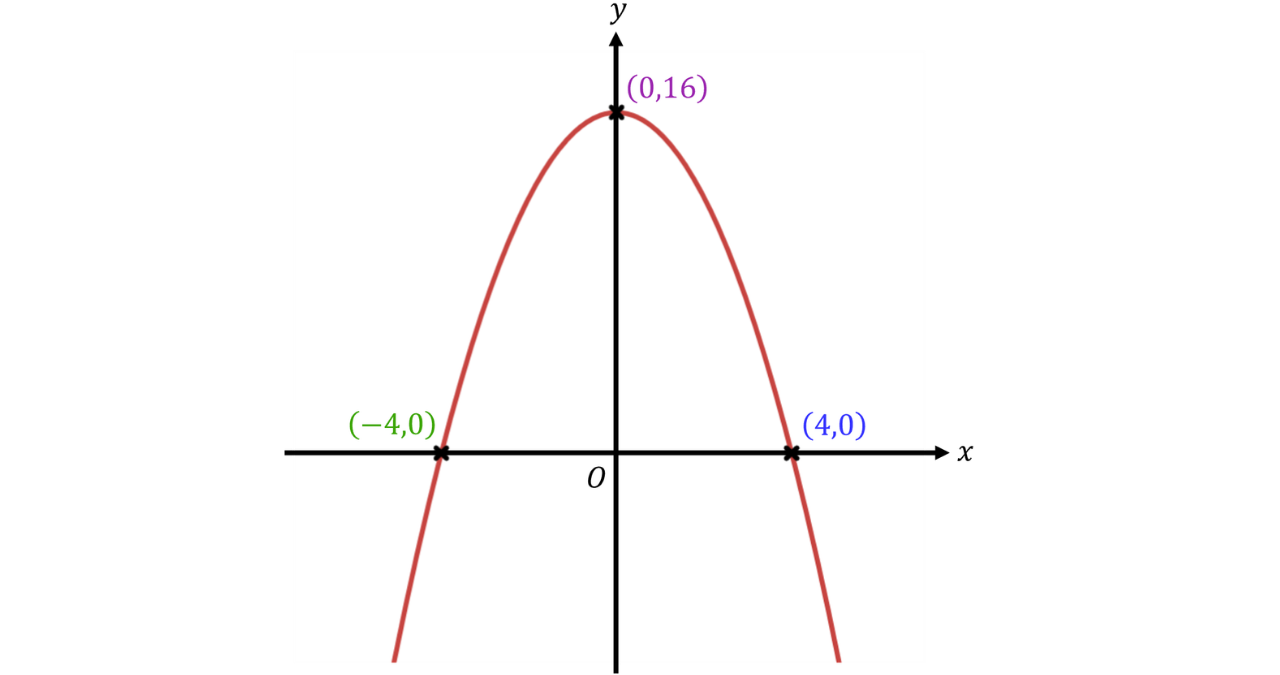
Therefore, the roots of the quadratic occur when and
Alternatively, we could have solved this by rearranging the equation Firstly, we’d move the to the right-hand side so it goes from negative to positive.

Then, we square root both sides to get
Next, we determine the intercept. This is represented by the value of in the quadratic. Remember that we refer the equation is and not any rearranged one as the signs would have changed. In this case, so the intercept is
Finally, to determine the shape of the curve, we look at the coefficient of In this case, the coefficient is which is negative, so the quadratic will have an ∩-shape.
Step 2: Use the information determined in step 1 to sketch the graph of the quadratic.
Using the three pieces of information from above, we would get the following sketch:
Example 3:
Sketch
Step 1: Determine the roots of the quadratic, the intercept, and the shape of the curve.
The roots occur when so we set
We can factorise this quadratic using the OI-OI method, coined by NeilDoesMaths. For more information on this method, please read our Factorising Quadratics note. Factorising the quadratic, we get
Now, we set each bracket equal to and then solve each one for Starting with the first bracket,
Adding to both sides,
Dividing both sides by
Next, we solve
Adding 1 to both sides,
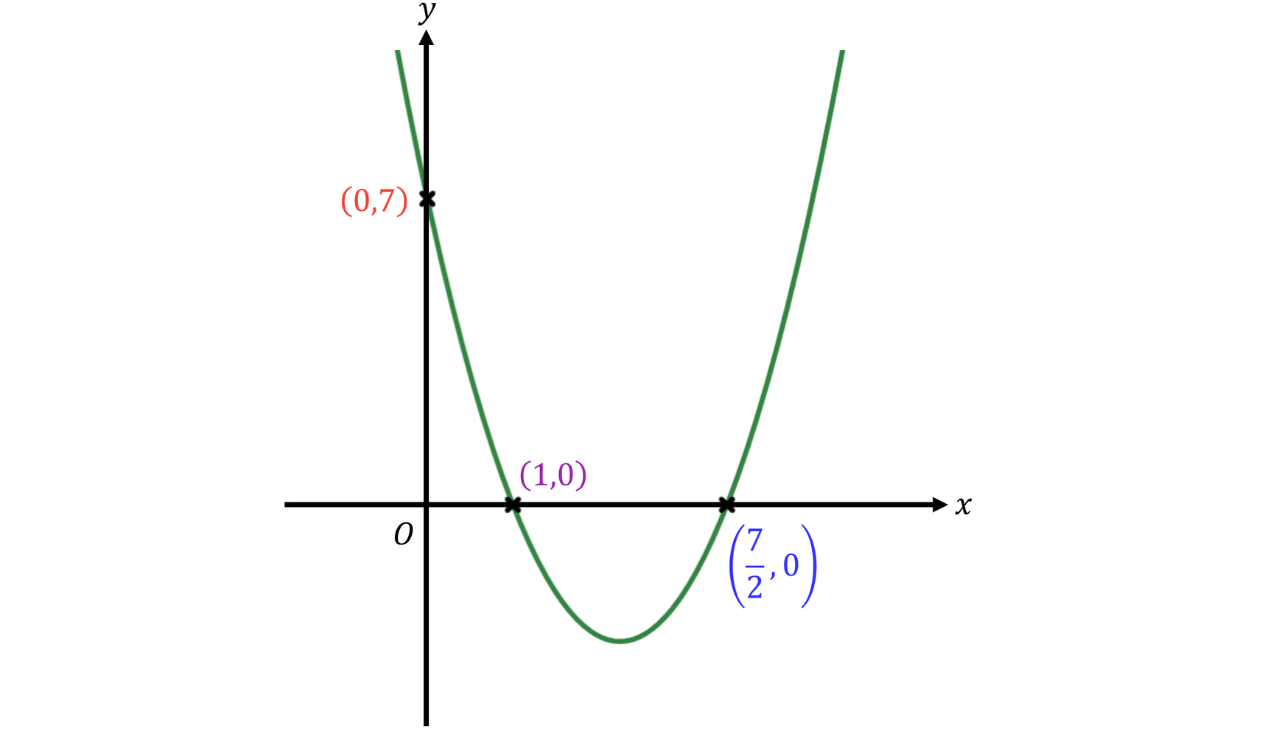
Therefore, the roots of the quadratic occur when and
Next, we determine the intercept. This is represented by the value of in the quadratic. In this case, so the intercept is
Finally, to determine the shape of the curve, we look at the coefficient of In this case, the coefficient is which is positive, so the quadratic will have a U-shape.
Step 2: Use the information determined in step 1 to sketch the graph of the quadratic.
Using the three pieces of information from above, we would get the following sketch:
Sometimes, we get quadratics that we cannot factorise easily, as the roots are surds, or find the roots of because the graph does not cross the axis.
In these cases, we can use the completing the square method. This allows us to find the roots that cannot easily be found by factorising, as well as identify the turning point of the graph and determine whether the quadratic has any real roots.
The turning point of a quadratic is the minimum or maximum point of the graph. When sketching quadratics, the turning point becomes another important feature to consider alongside the roots, the intercept, and the shape of the graph.
Here is a general quadratic graph with the turning point included.
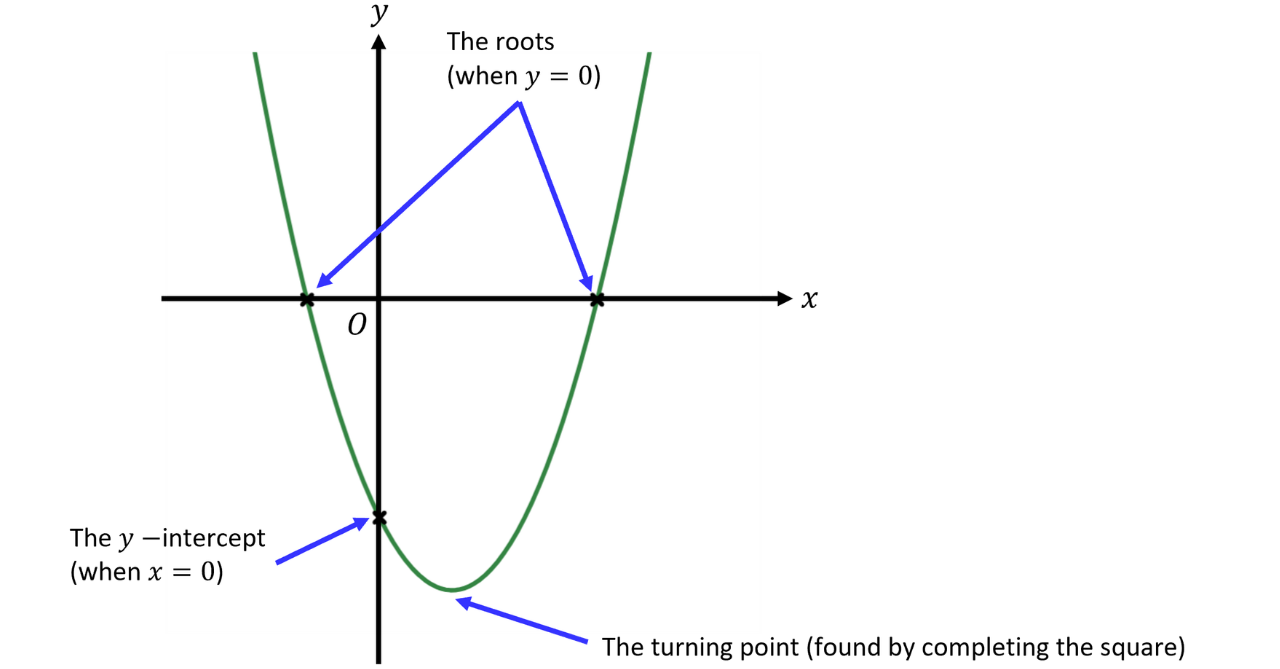
For example, consider the quadratic We write this quadratic in completed square form. For more information on the process, please read our Completing the Square study note.
The quadratic in completed square form will be
The coordinate of the turning point is found by taking the value that’s inside the brackets and flipping the sign. Here, we have inside the brackets. We just flip the sign, and we would get the coordinate to be
The coordinate of the turning point is just the constant term outside the brackets. In this case, the constant term is so the coordinate is
Therefore, the coordinates of the turning point are
Notice that we have effectively transformed the graph to create the quadratic
Firstly, the inside the brackets translates the graph unit to the left, then the translates the graph units downwards.
The turning point of the graph of is After applying the transformations of left and down, the turning point moves to
For more information on transformations, please read our Transformation of Functions study note.
Transformations to Sketch Quadratics
We can sketch quadratics by considering transformations of the graph of
When transforming quadratic graphs, it is important to remember the following rules:
Changes inside the brackets affect the values and work in the opposite direction.
Changes outside the brackets affect the values and work in the same direction.
For example,
1) translates the graph units to the right. This increases all values by while the values remain the same.
2) translates the graph units downwards. This decreases all values by while the values remain the same.
Example 4:
Sketch the graphs of the following, indicating the turning point and any points of intersection with the coordinate axes:
a)
Step 1: Write down the transformation that changes the graph of to the graph of
Here, we have inside the brackets and outside. So, both the and values are affected. The graph shifts units to the right and units upwards. This is a translation by the vector
Step 2: Sketch the graph of by applying the transformations from step 1 to the graph of
Firstly, here is the graph of
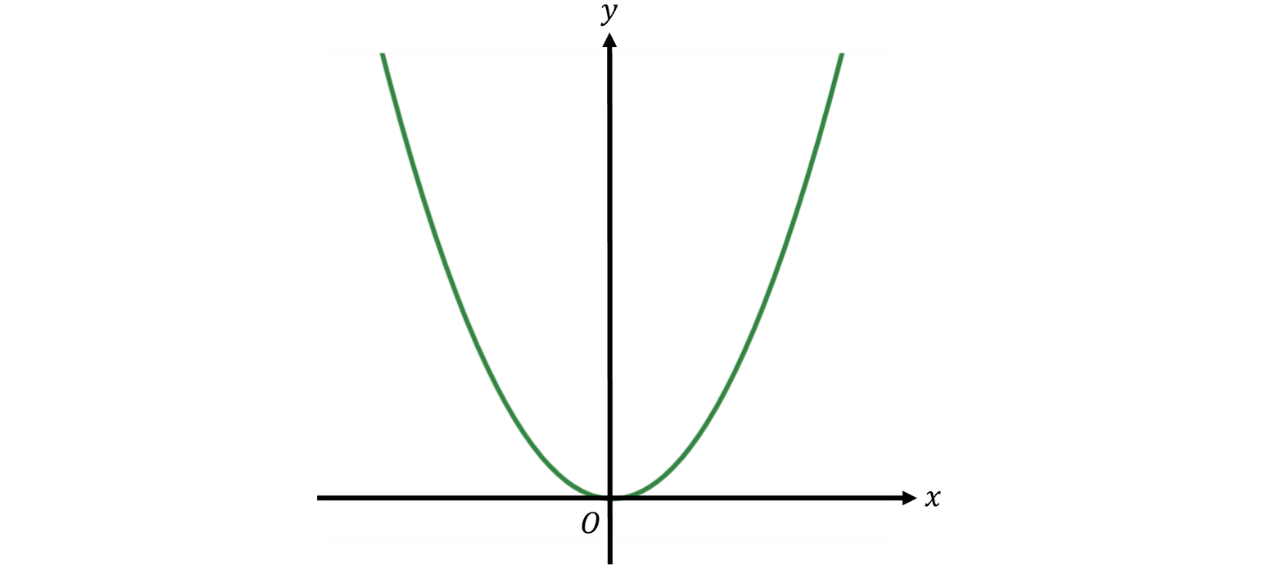
The turning point of this graph is
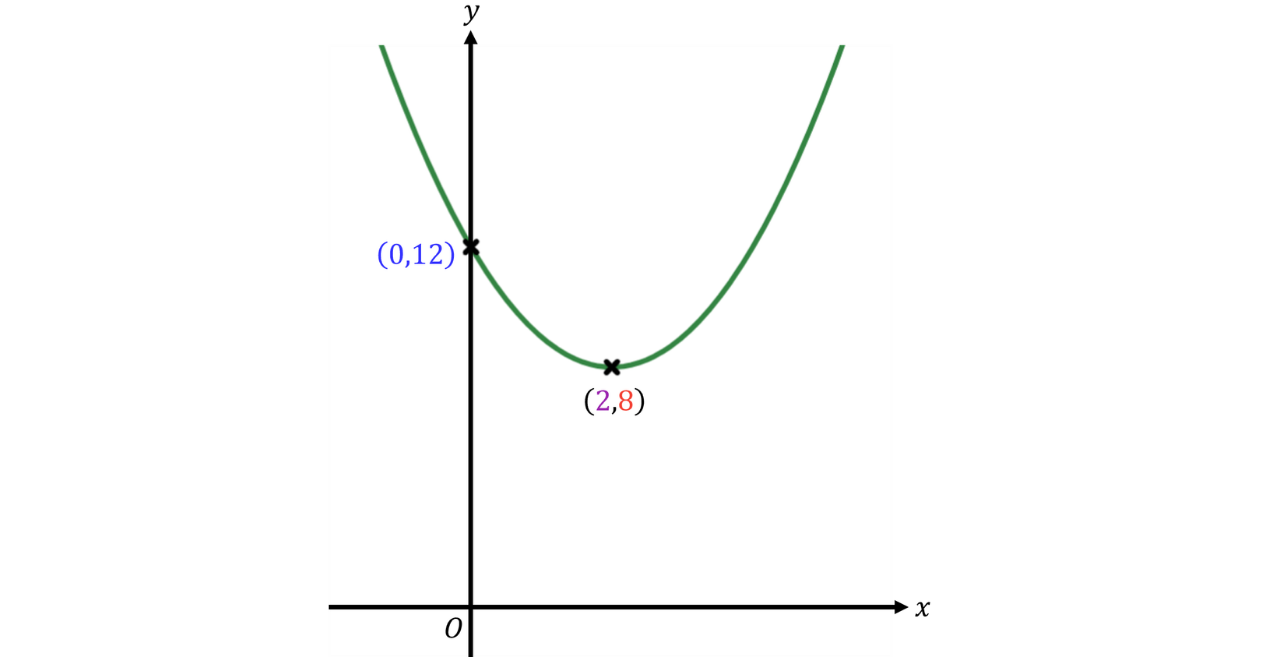
Due to the translation, the turning point moves from to The shape and orientation of the graph do not change, only its position.
To find the intercept, we substitute into the equation.
Therefore, the intercept is
Once we translate the graph by the vector we get the following sketch.
b)
Step 1: Write down the transformation that changes the graph of to the graph of
For clarification, we can rewrite the quadratic as
Here, we have inside the brackets and outside. So, both the and values are affected.
For the graph shifts units to the left. This is a translation by the vector and all values decrease by
For we are multiplying all values by so this is a reflection in the axis.
Step 2: Sketch the graph of by applying the transformations from step 1 to the graph of
Firstly, here’s the graph of
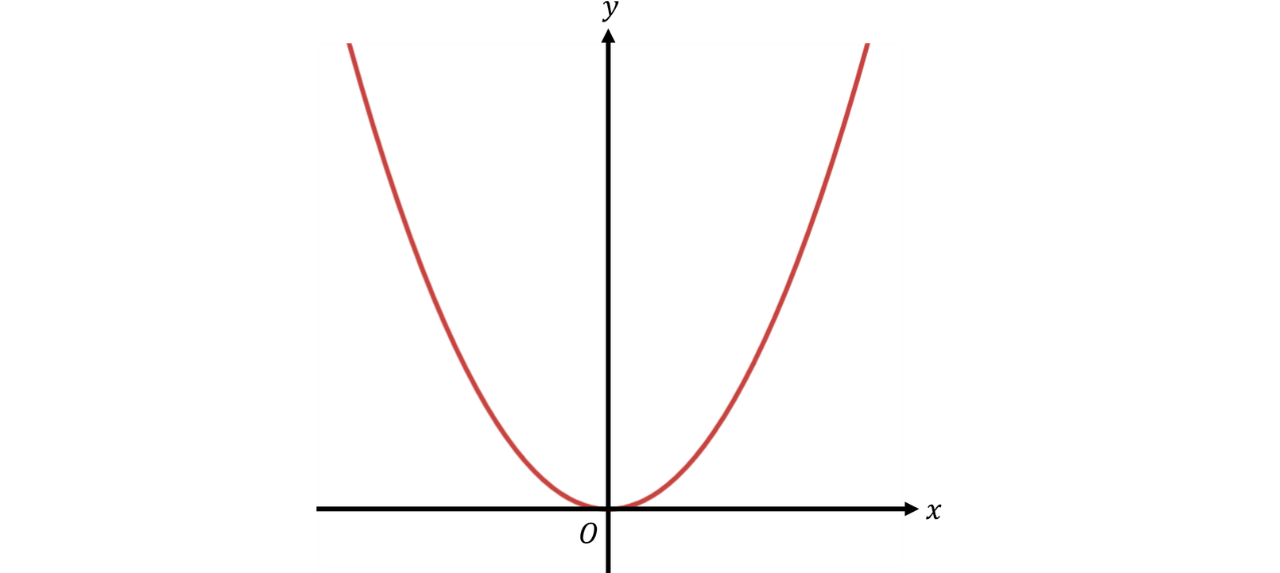
The turning point of this quadratic is
To go from to we translate the graph units to the left. Hence, the turning point shifts from to
To find the intercept, we substitute into the equation.
Therefore, the intercept is
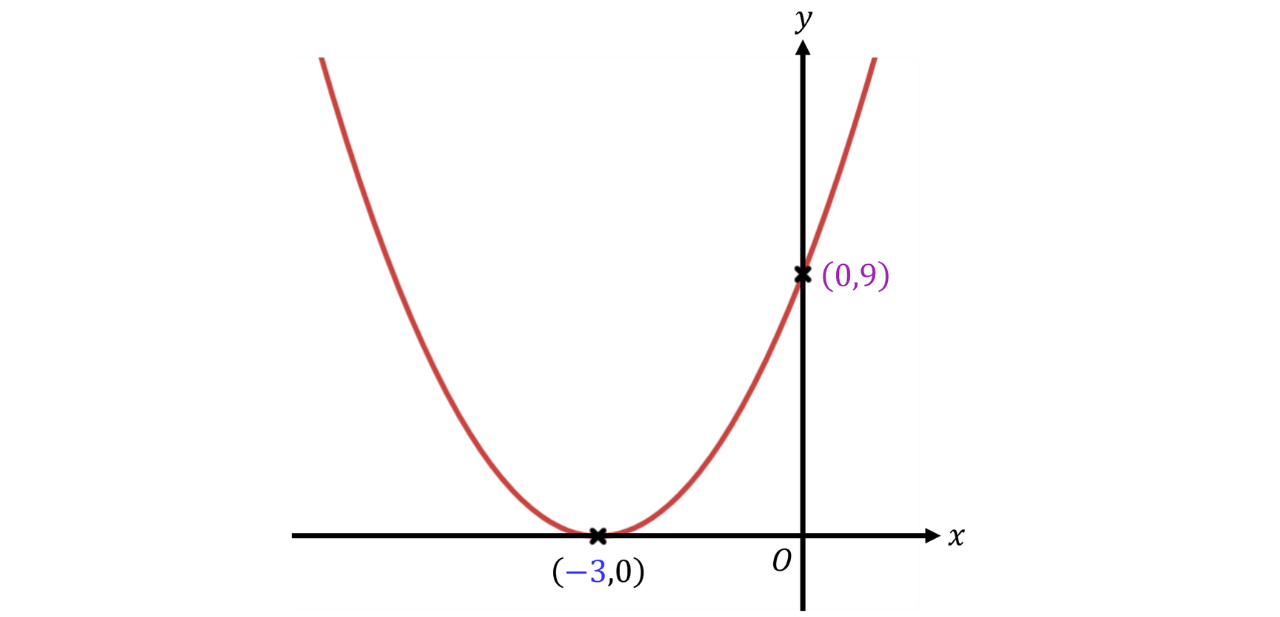
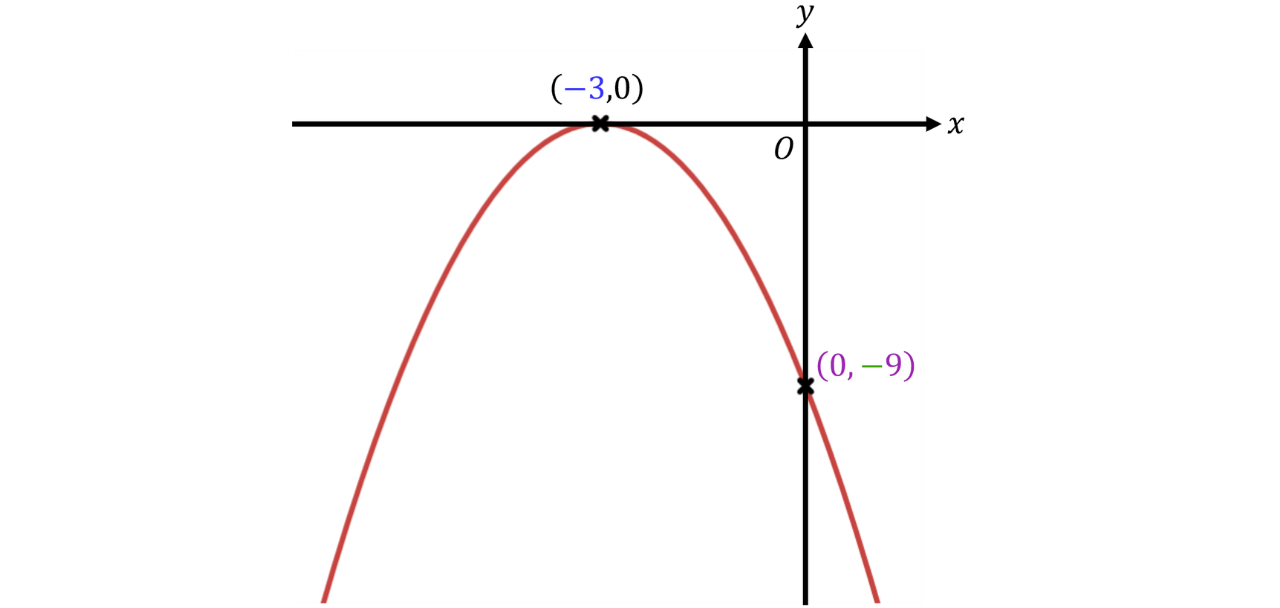
Finally, to go from to we reflect the graph in the axis. The coordinate of the turning point doesn’t change because it’s right on the mirror line (the axis).
However, for the intercept, we multiply its coordinate by to give us a new intercept of Also, the orientation of the graph flips, changing from a U-shape to an ∩-shape.
Therefore, once we applied the transformations, we get the following sketch:
Example 5:
Sketch the graph of indicating the intersections with the coordinate axes and the turning point.
Step 1: Determine the roots of the quadratic (if any), the intercept, the shape of the curve, and the turning point.
Firstly, we can identify, from the quadratic equation, that the intercept of the graph is
We can also identify that the shape of the quadratic will be like a U-shape because the coefficient of which is is positive.
Now, to find the roots and the turning point, we must complete the square. For more practice on this, please read our Completing the Square notes. After completing the square, we’d get
The quadratic is now in completed square form. To find the roots, we make and then solve for
We have
Adding to both sides,
Dividing both sides by
Square rooting both sides,
Adding 3 to both sides,
Typing in the calculator, we get
Therefore, the roots of the quadratic are or
It is important to type these values in the calculator to know if they are positive or negative for our sketch. Alternatively, we can deduce this by recognising that so both roots must be positive.
Finally, we identify the turning point.
The coordinate of the turning point is the opposite of the value inside the brackets, which gives
The coordinate is the constant term outside the brackets, which is The that’s outside of the brackets does not affect the turning point.
Therefore, the coordinates of the turning point are
Step 2: Use the information obtained in step 1 to sketch the quadratic.
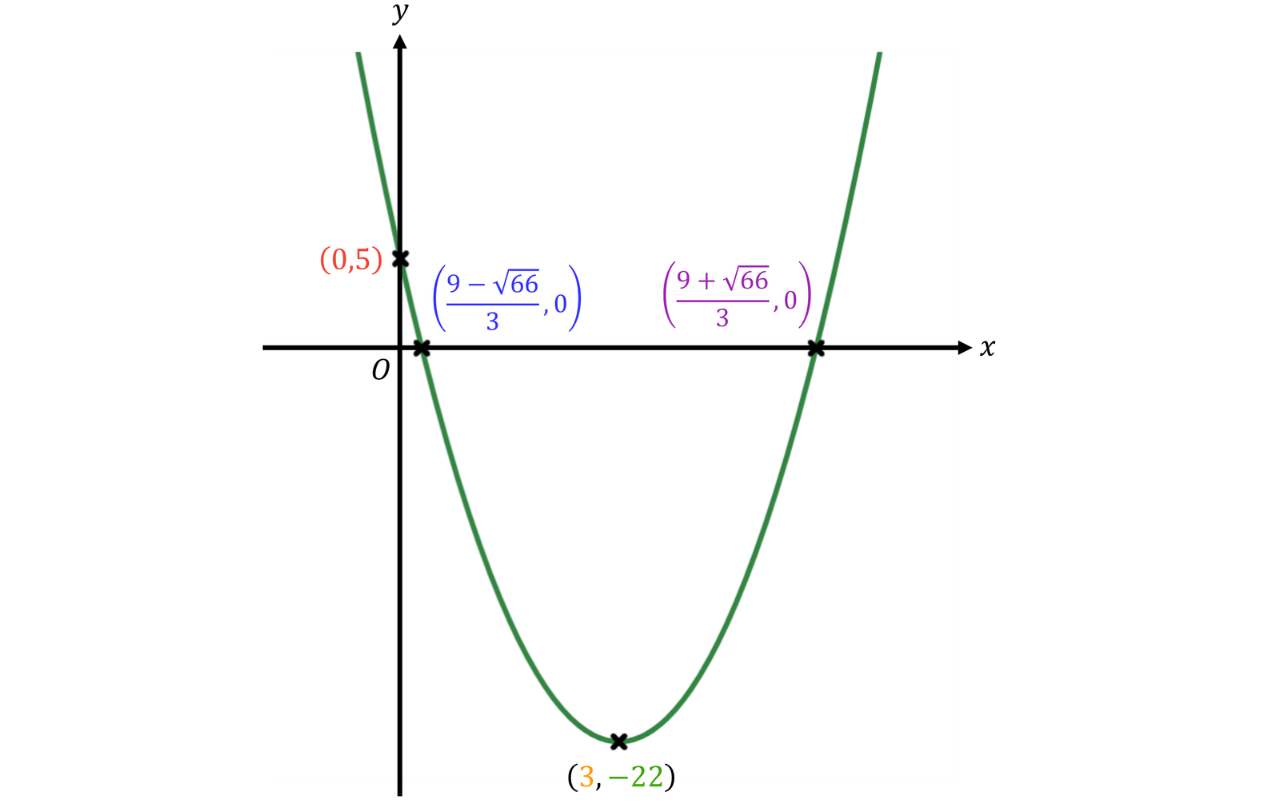
Using the information gathered:
The quadratic has a U-shape.
The intercept is
The roots of the quadratic are and
The turning point is
We can sketch the following quadratic graph:
Challenging Questions