Data Interpretation (Tables, Graphs, Charts)
Dr. Davinder Bhachu & Nick Featherstone
Teachers


Contents
Introduction - Data Interpretation
What are data interpretation questions?
You are provided with a table, graph and chart and asked to make calculations based on the data provided.
Why is data interpretation tested in the UCAT?
Assesses a candidate’s ability to quickly analyse and accurately interpret numerical information, including performing conversions, which students often find challenging.
Explainer Video
Filmed by our Maths department, this video walks through data interpretation from first principles.
Worked Examples
Question 1 - Easy
School Election Results
How many students voted in the school election in 2022?
Answer
Worked Solution
Eligible students in 2022
Turnout in 2022
Votes in 2022
Question 2 - Medium
A research project analyses how the percentage of time spent on sponsored messages varies with the length of workout videos. The graph below shows the percentage of video time used for sponsored messages across different video lengths. The shortest video in the study is 5 minutes long and the longest is 70 minutes long.
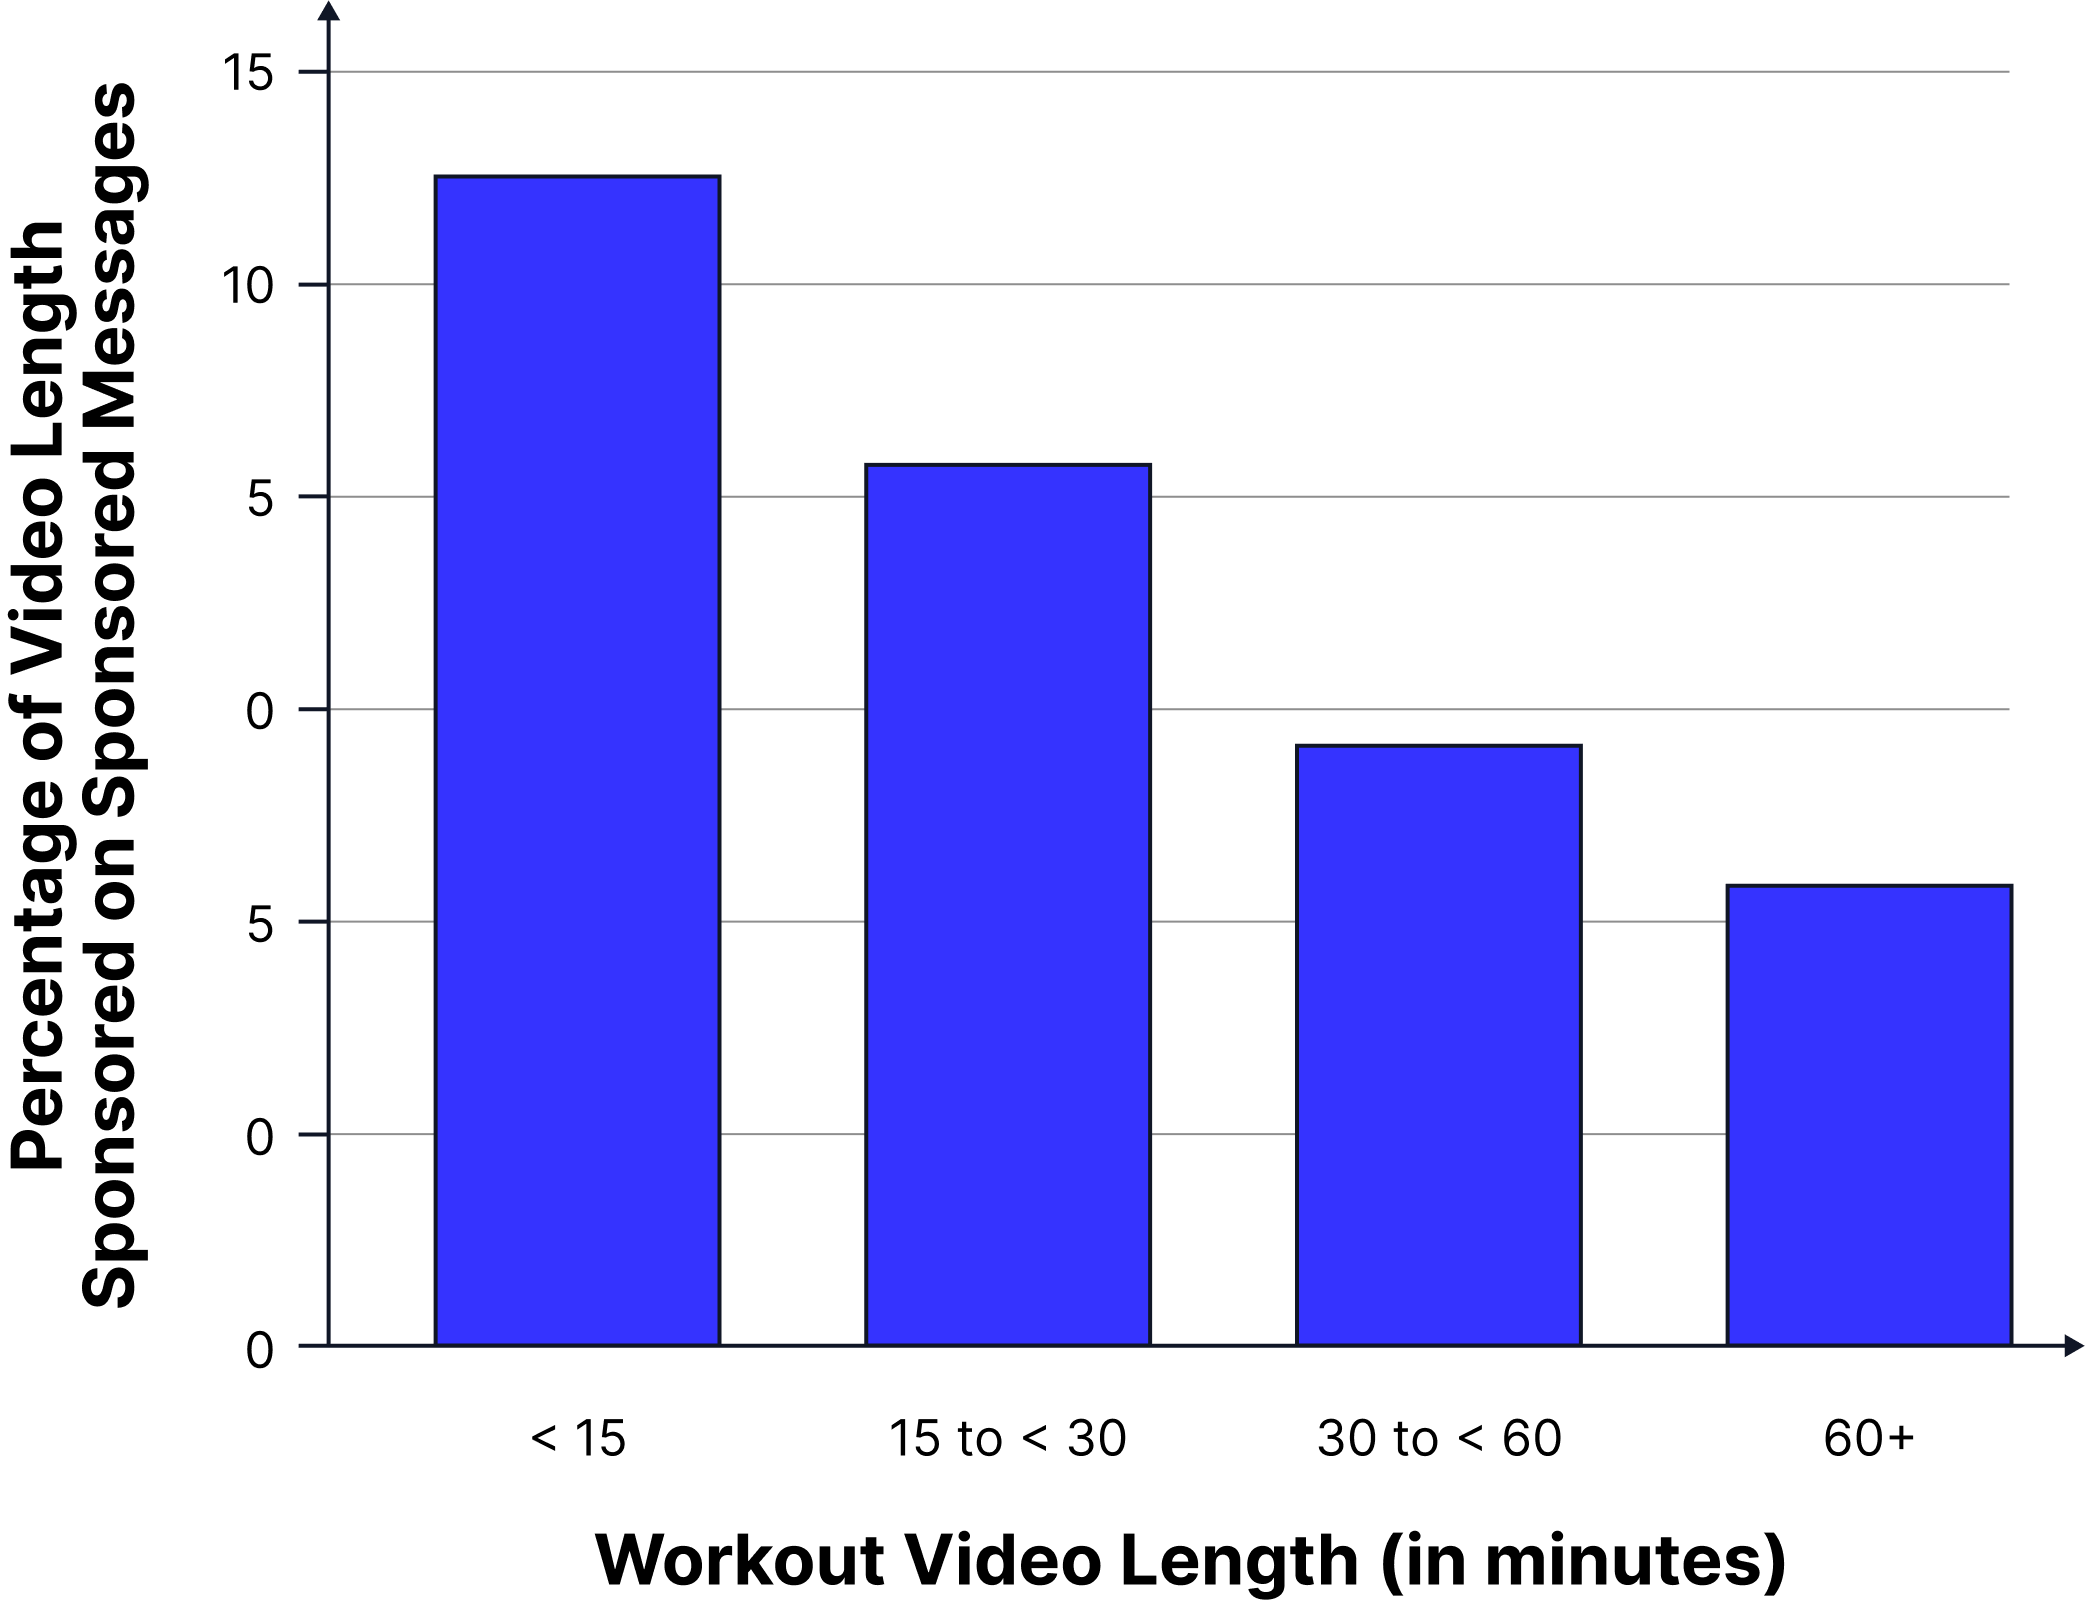
How much longer is the sponsored message time in a 36-minute workout video than in a 22-minute workout video?
Answer
Worked Solution
A 22-minute video falls in the 15 to <30 category
A 36-minute video falls in the 30 to <60 category
Sponsored message time for 22-minute video
Sponsored message time for 36-minute video
Difference
Question 3 - Hard
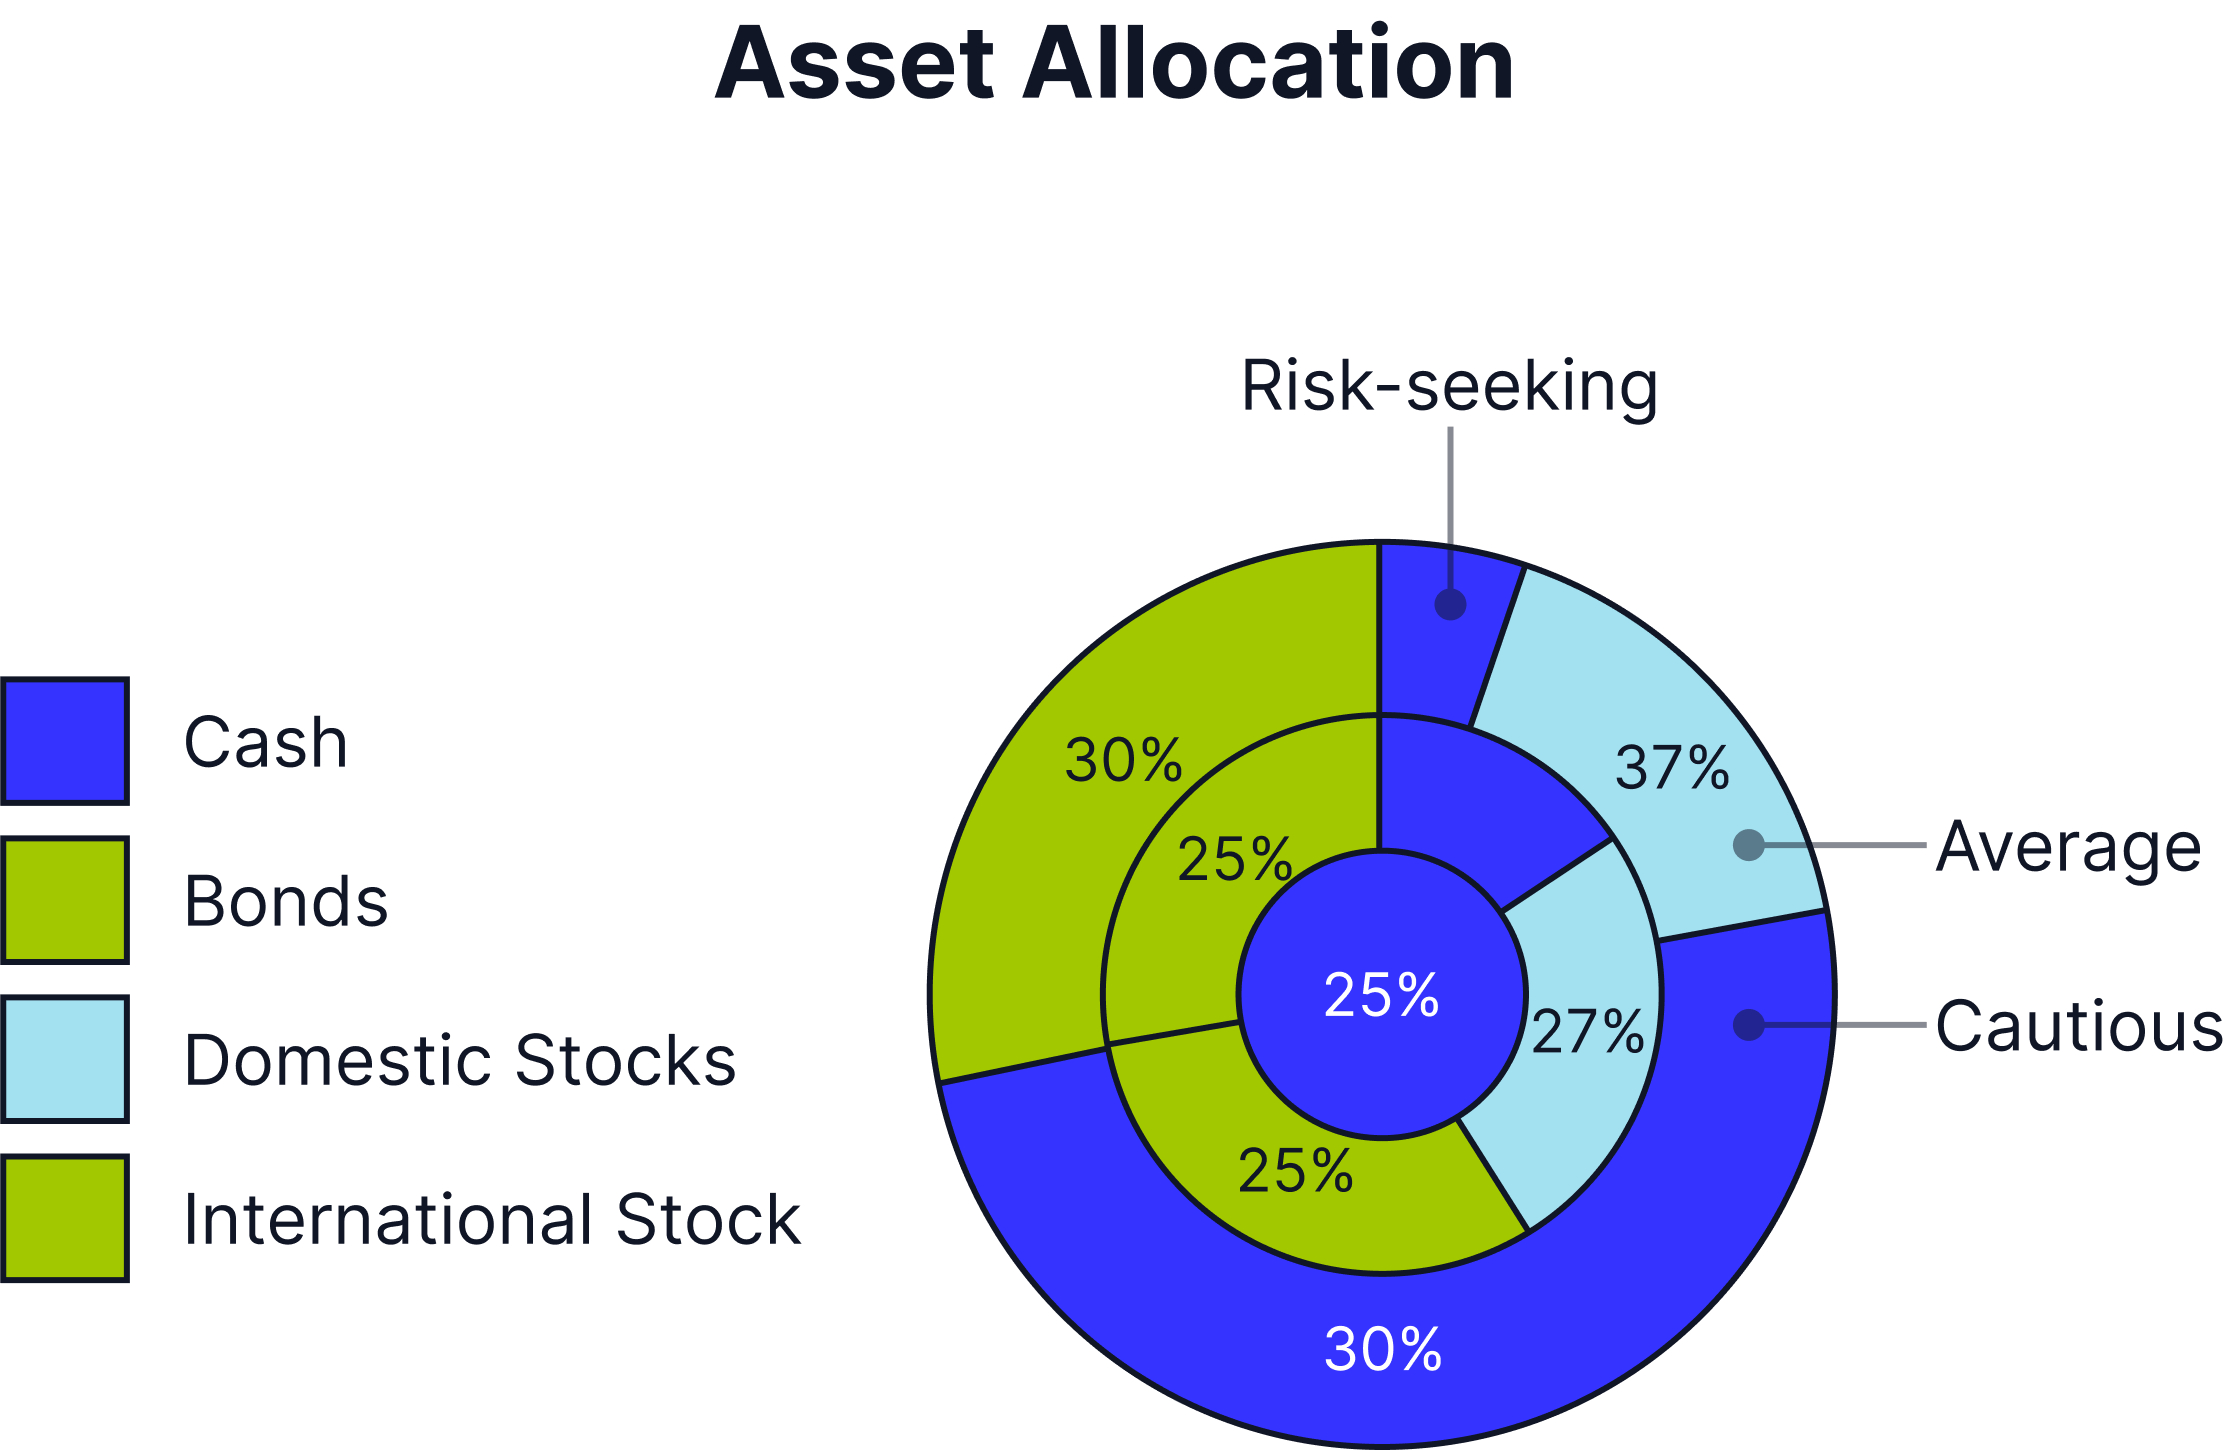
An investor with a cautious risk profile invested a total of $18,400 according to the asset allocation shown in the chart.
Another investor with an average risk profile invested a total of $16,500 according to the asset allocation shown in the chart.
Based on the cautious investor’s allocation, what is the difference in the amount of money invested in cash compared to the average investor in domestic stocks?
Answer
Worked Solution
Cautious investor in cash
Average investor in domestic stocks
Difference
Worked Examples Video