¹H NMR
Dr. Davinder Bhachu
Teacher

Contents
What is ¹H NMR?
NMR spectroscopy is used to identify and investigate the structure of organic molecules by analysing the environments of hydrogen atoms in a compound.
Only detects hydrogen nuclei (protons) with a spin (i.e., ).
Produces a spectrum with peaks representing distinct proton environments.
Key Features of a ¹H NMR Spectrum
1. Number of Peaks
Each peak = one unique proton environment.
Chemically equivalent protons produce a single peak.

e.g. environments so 4 peaks on the spectrum.
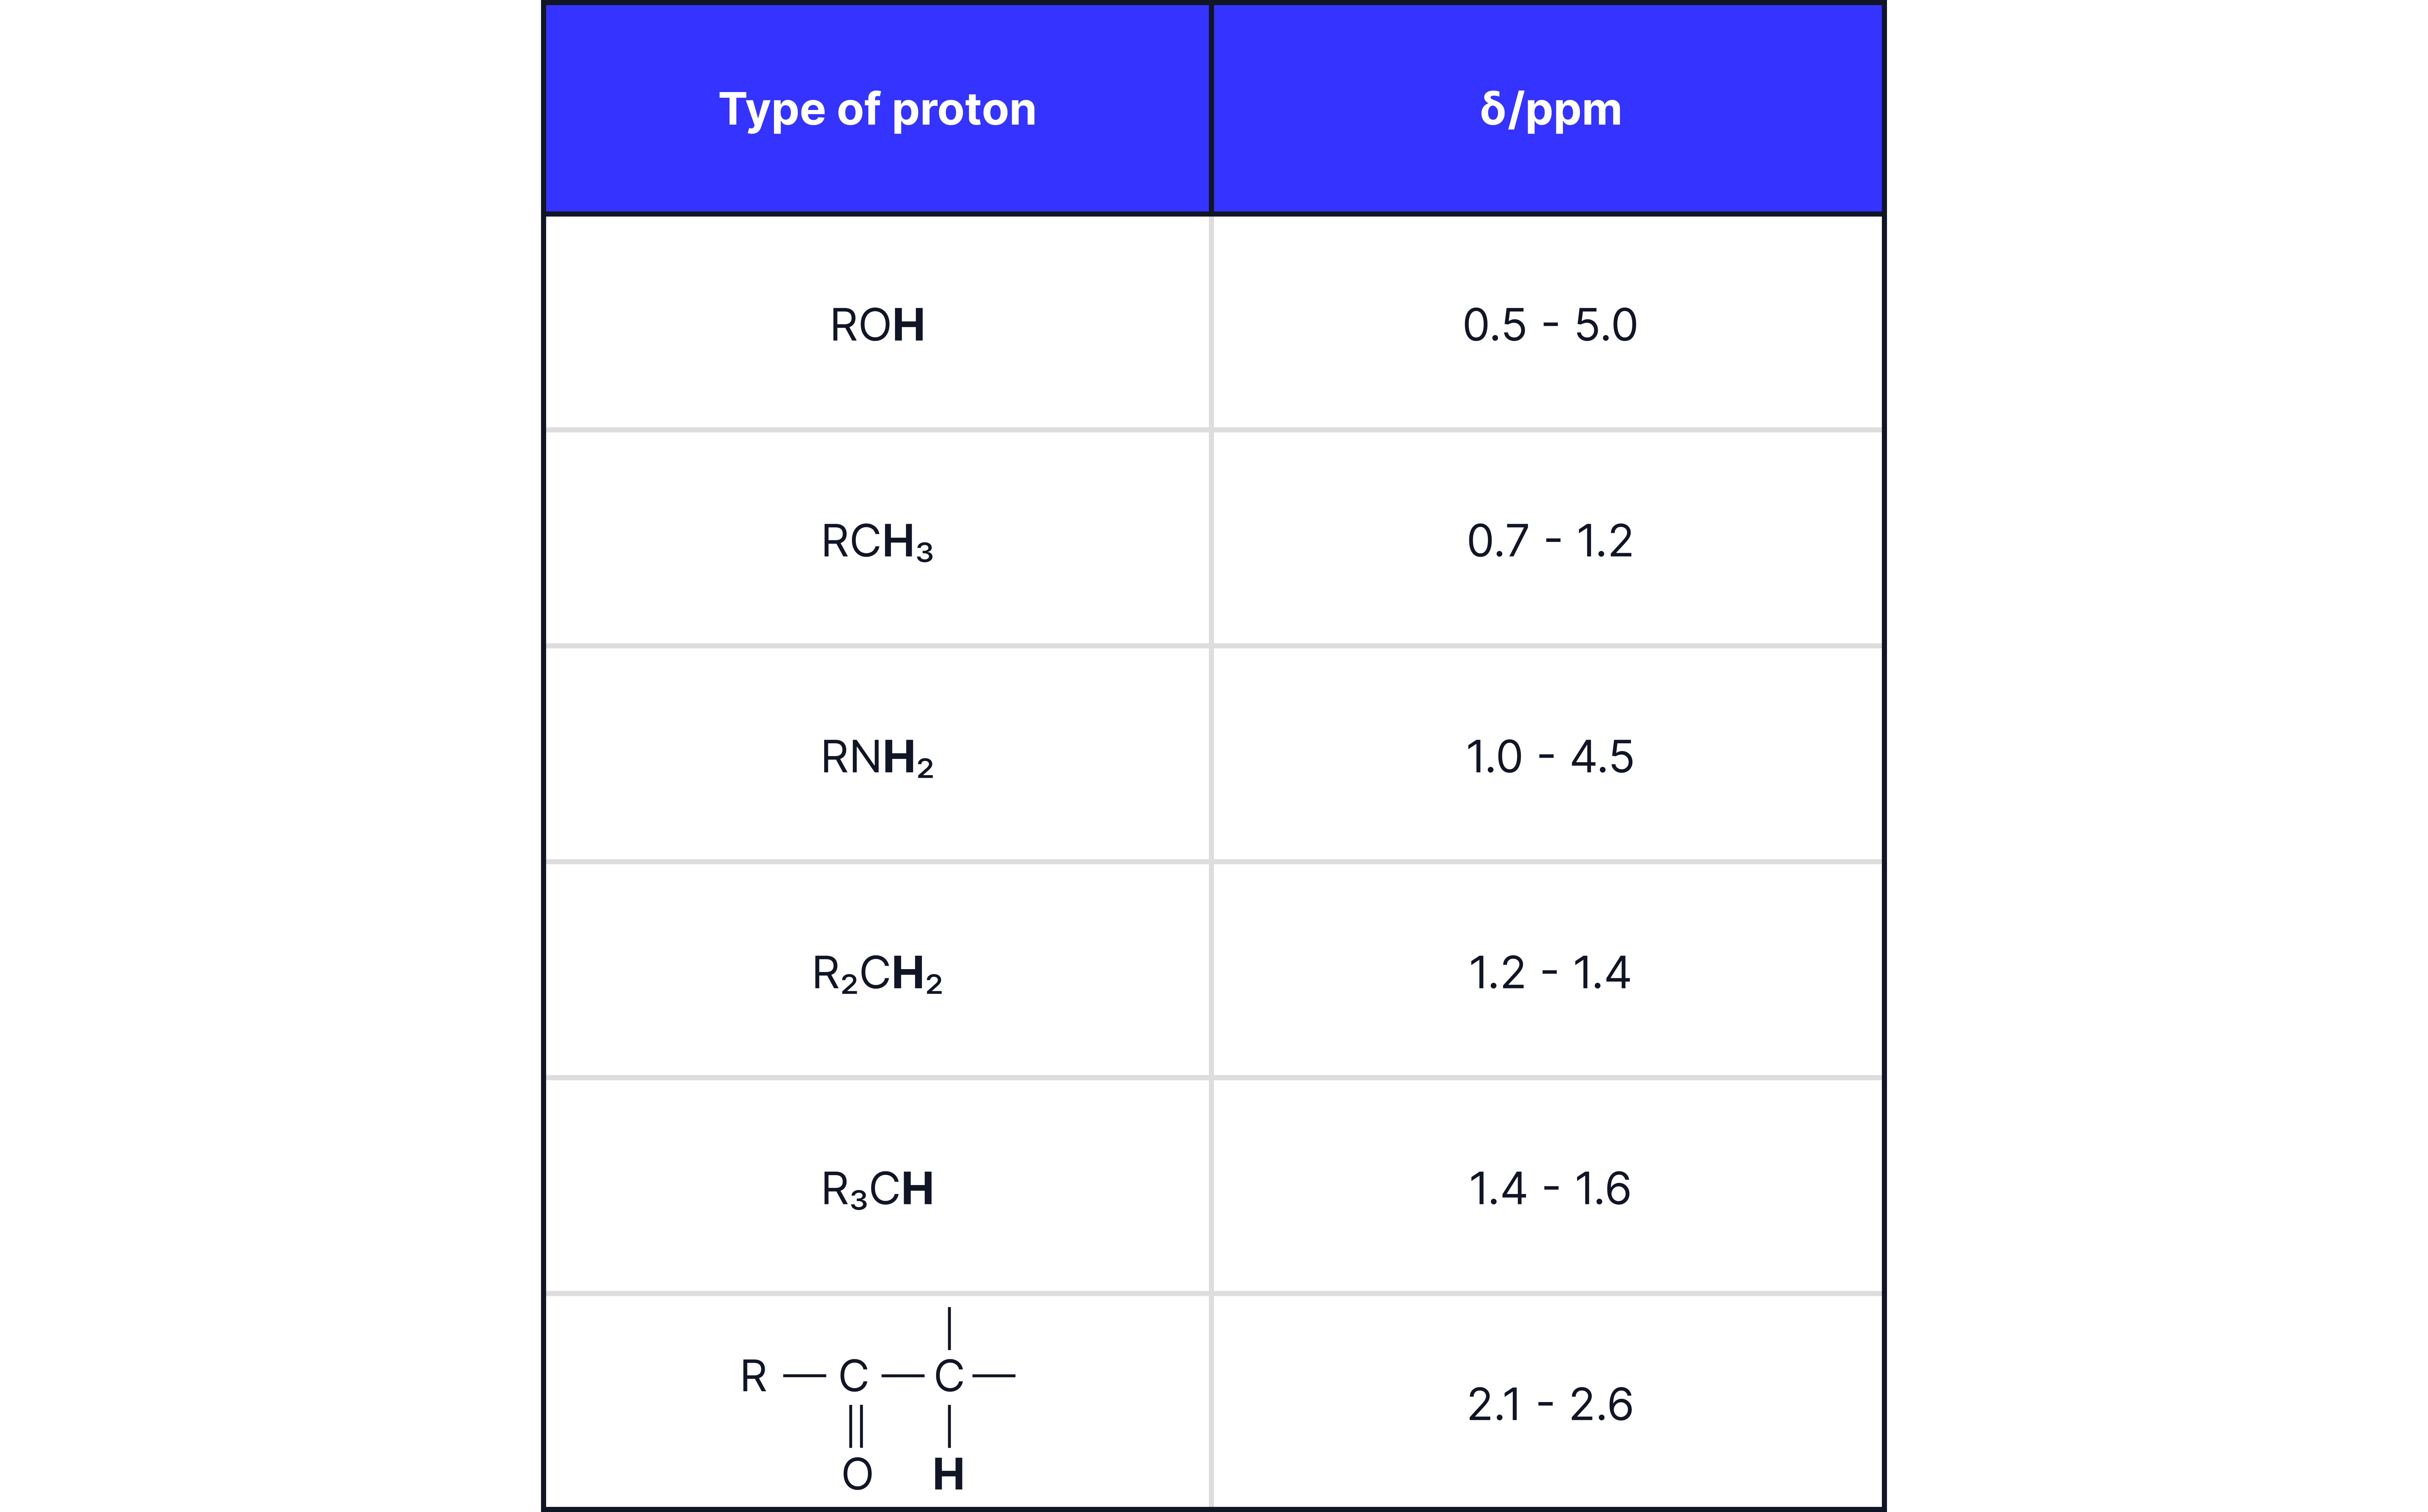
2. Chemical Shift ()
Measured in parts per million ().
Indicates its chemical environment.
Affected by:
Nearby electronegative atoms (e.g., ).
π bonds (, benzene rings).
TMS (Tetramethylsilane) is used as the standard reference producing a peak at .
3. Integration
Area under each peak = number of protons in that environment.
Spectra often show integral values (ratios) to help determine the relative number of protons.
The values given are ratios and sometimes need to be scaled up to the actual number of H atoms in the compound.

4. Spin-Spin Splitting (Multiplicity)
Caused by spin of neighbouring protons.
Follows the n + 1 rule:
A proton with n adjacent protons will split into n + 1 peaks.
Example: A peak next to a splits into a quartet (3+1).
Splitting Patterns:
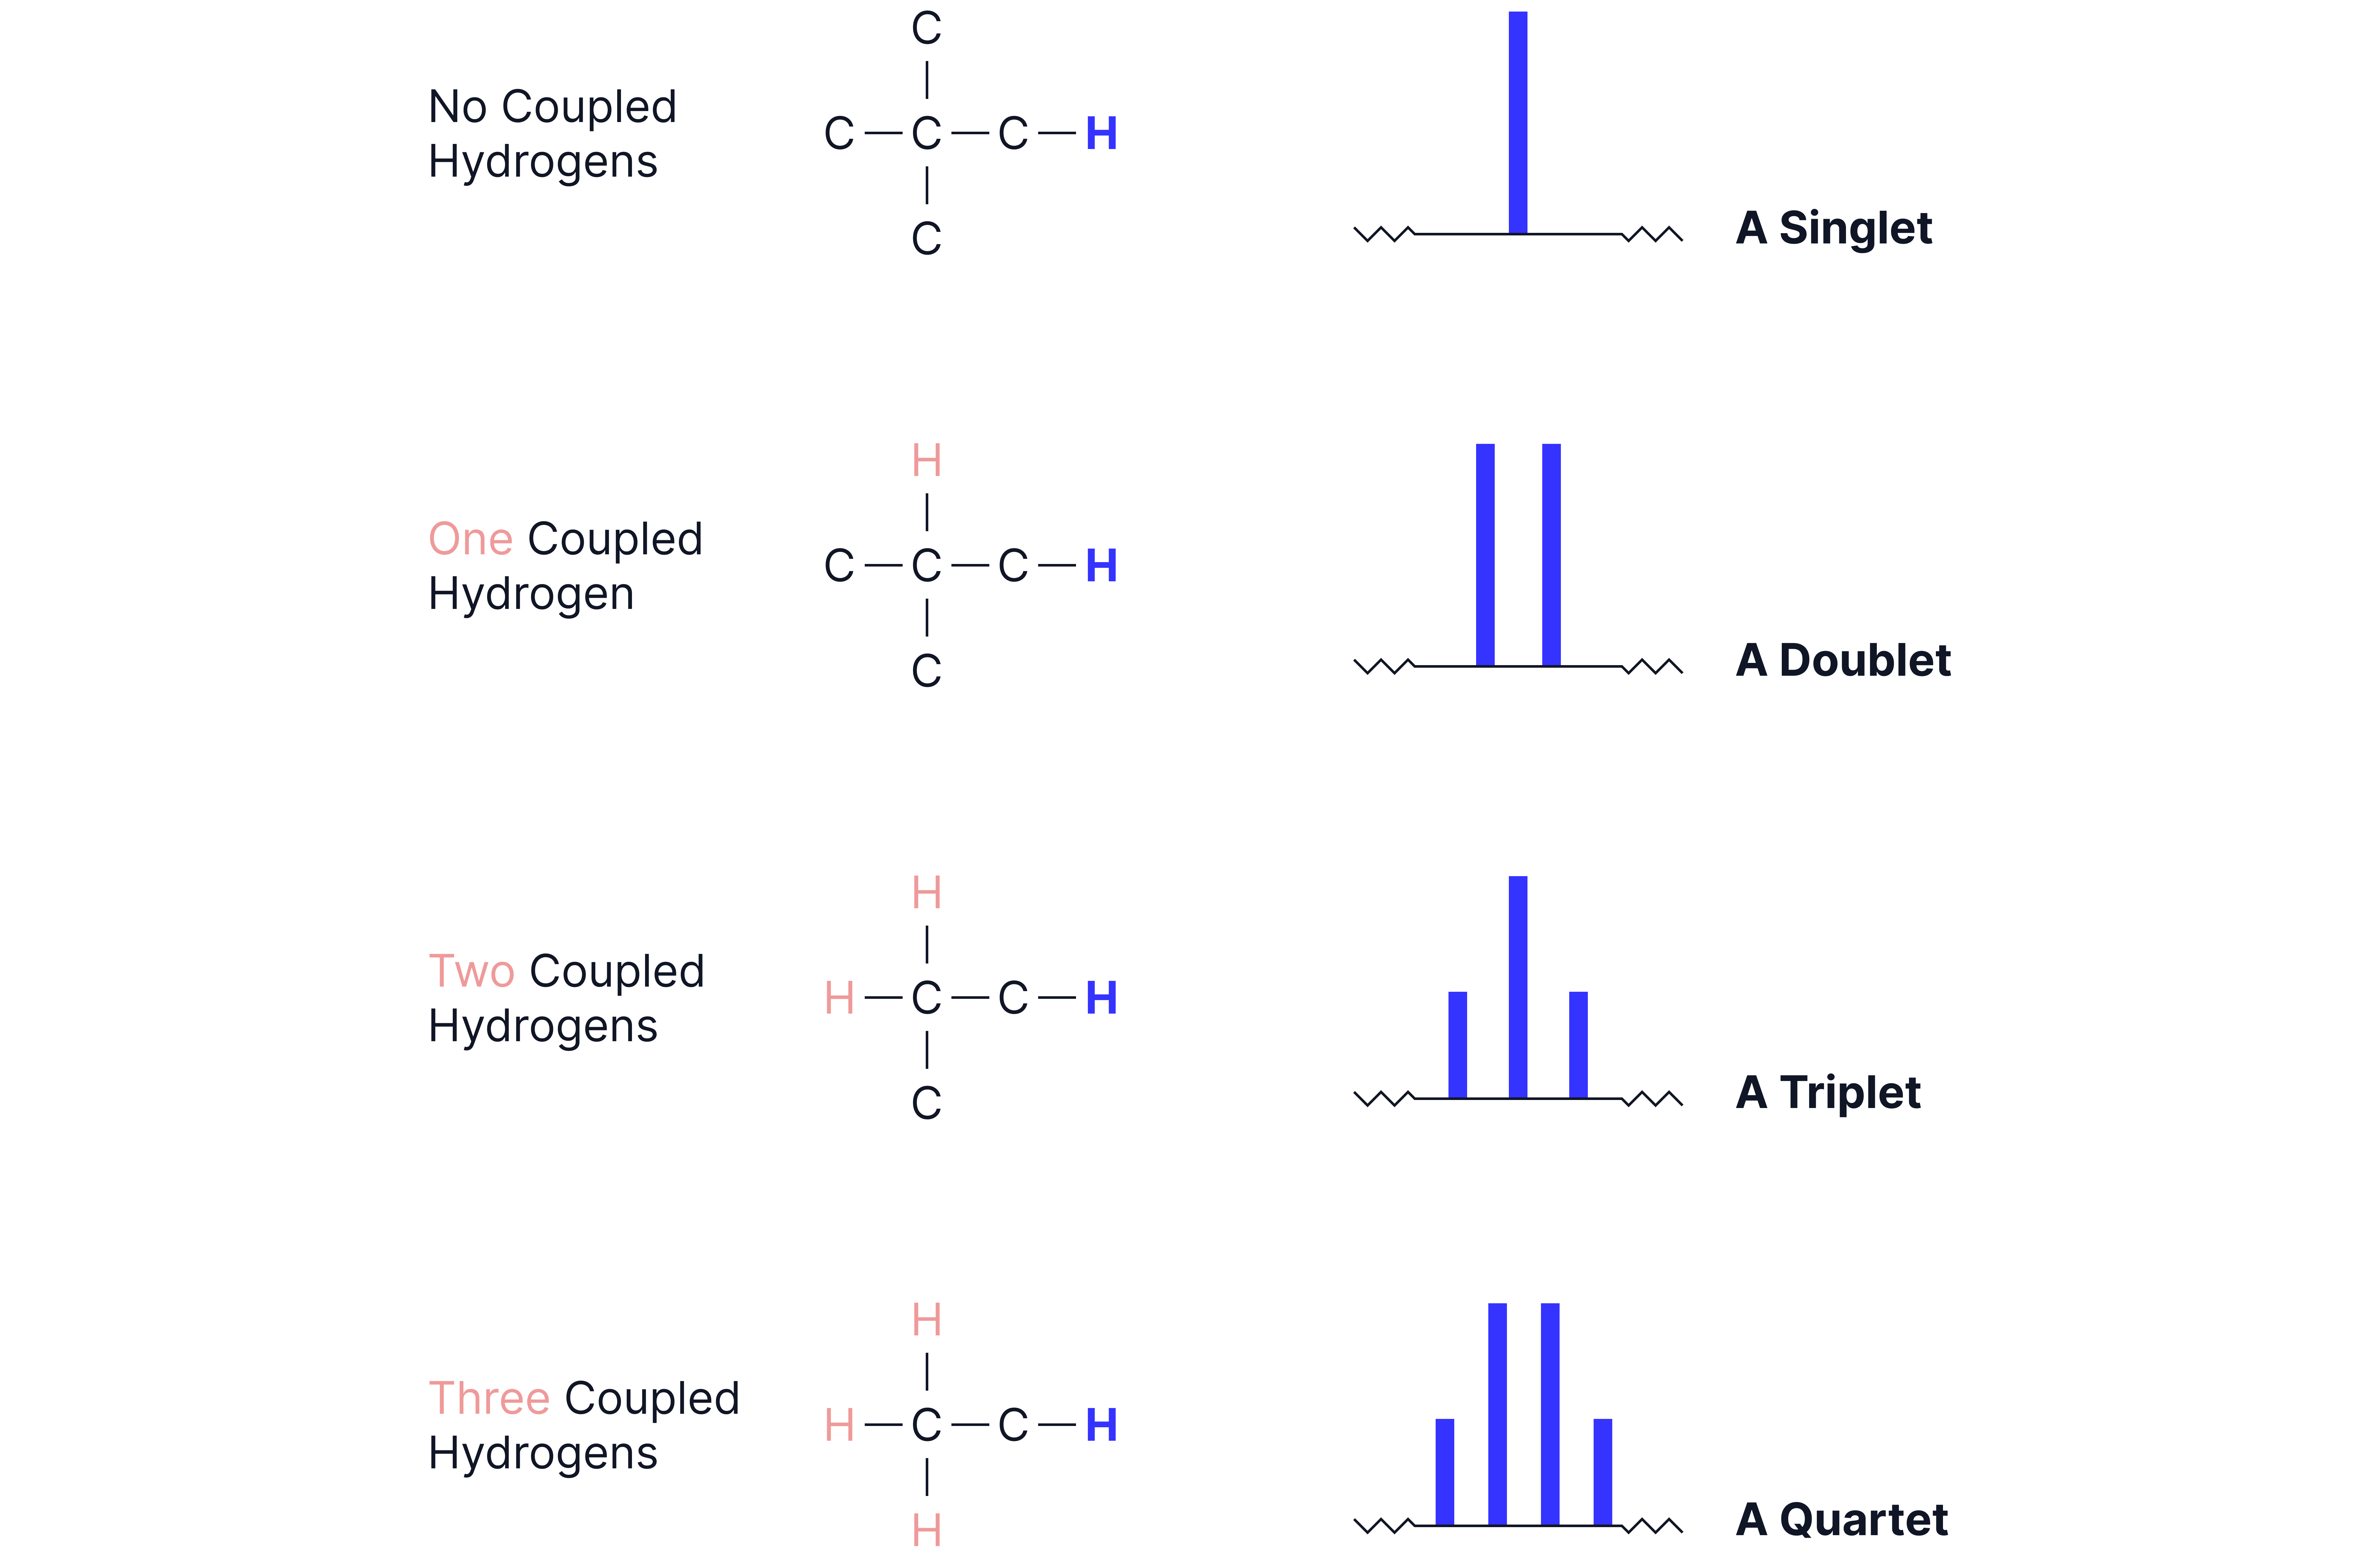
Splitting patterns for any more than 3 neighbouring H’s can be classified as a ‘multiplet’
Patterns to look out for:

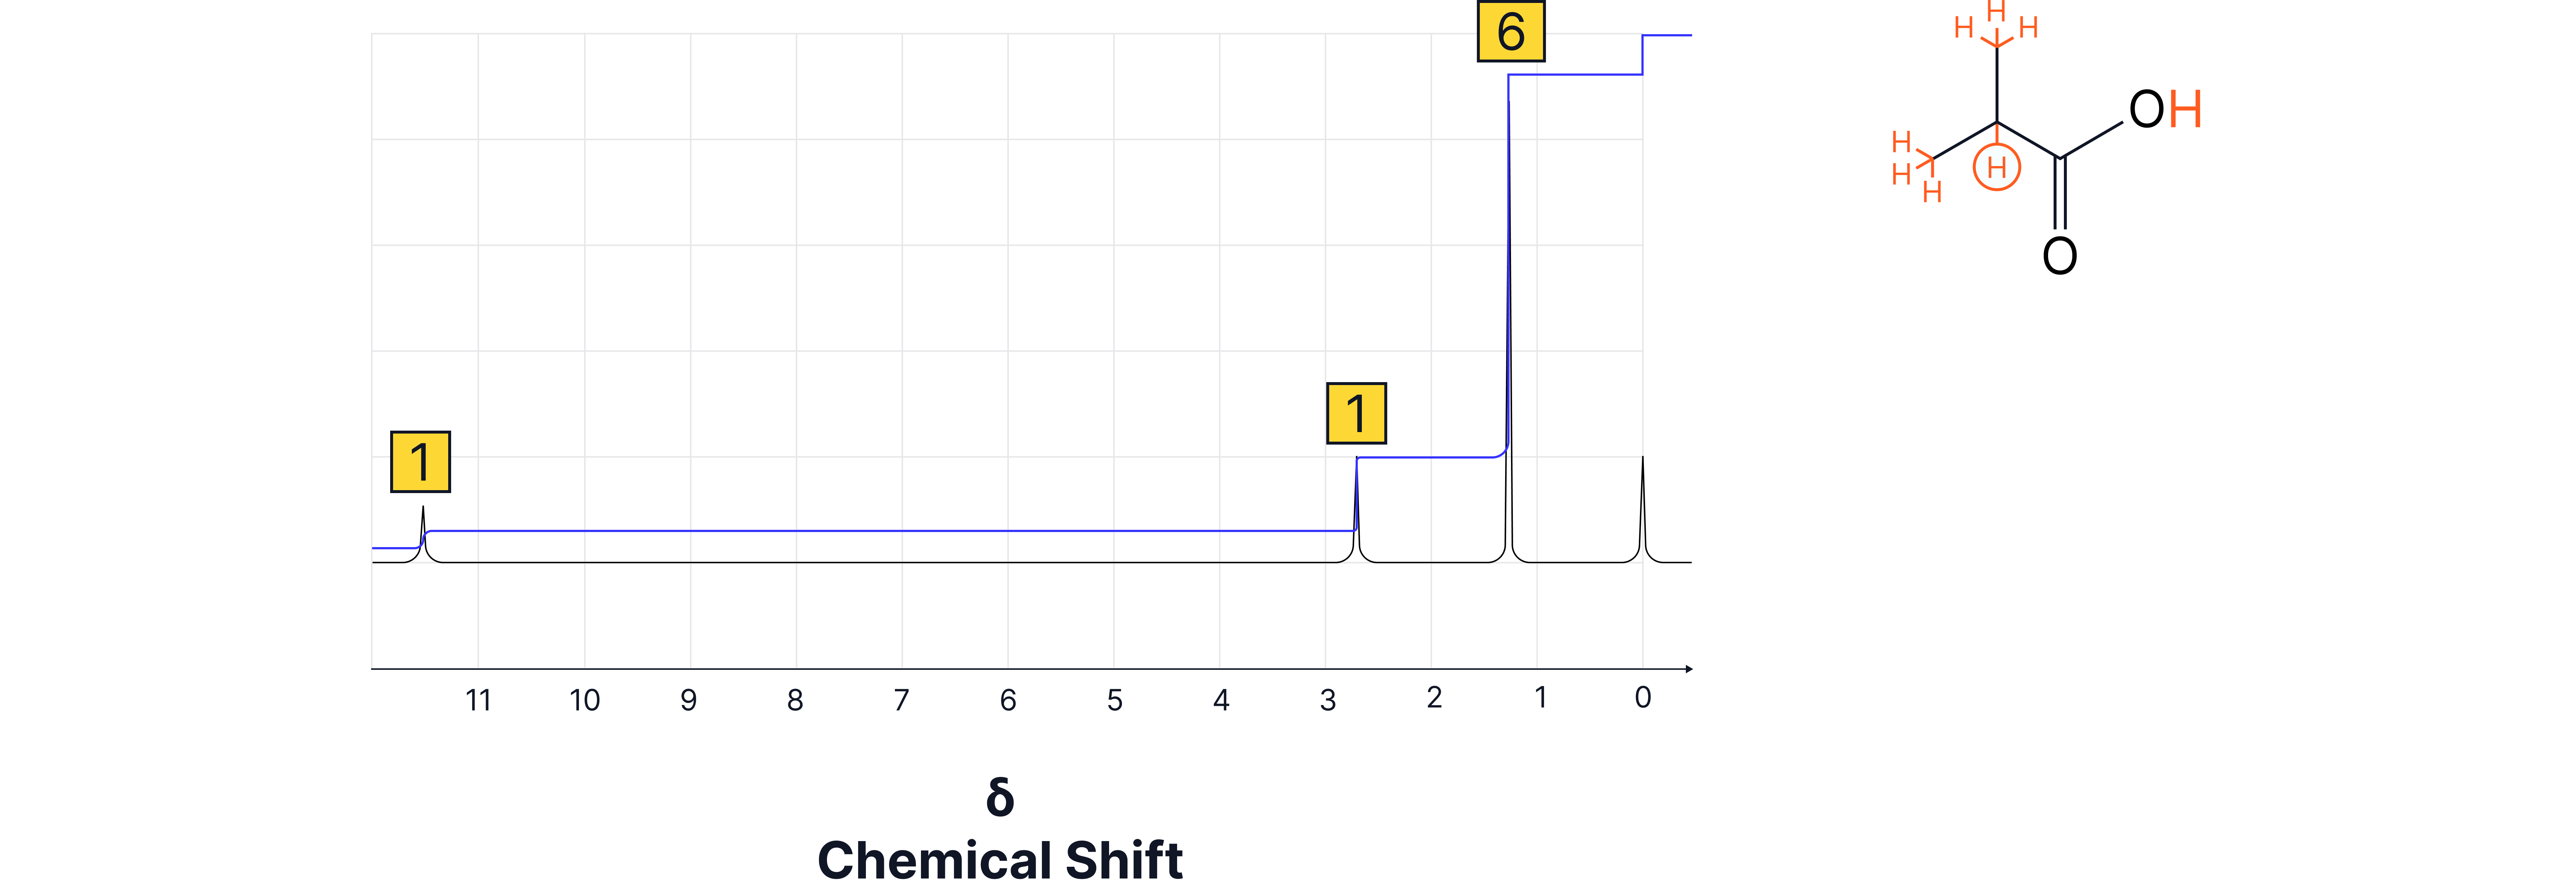
Worked Example
Give the number of peaks, relative intensities, and splitting patterns expected in the high resolution spectrum of the compound below.

Answer

Number of peaks = number of H environments | 2 |
Relative intensities = ratio of H in each environment | 3:2 (6:4) |
Splitting pattern = number of H on adjacent C atom | Triplet and Quartet |
Tips for Interpreting
1. Count number of peaks → unique environments.
2. Use chemical shift table to match environment types.
3. Look at integration for proton ratios.
4. Apply n + 1 rule to identify splitting patterns.
5. Combine clues to suggest a possible structure.
No answer provided.
Practice Questions
Question 1: Identifying Environments
A molecule shows three peaks with relative integrals of 3:2:1.
a) How many proton environments are present?
b) What does the ratio suggest about the structure?
Answer
a) 3 different proton environments.
b) The protons are in relative ratios of 3, 2, and 1.
Question 2: Predicting spectra
From the structure of 2-ethoxypropane (shown below), give the expected chemical shifts, relative peak areas, and splitting patterns for each peak in the high resolution spectrum.
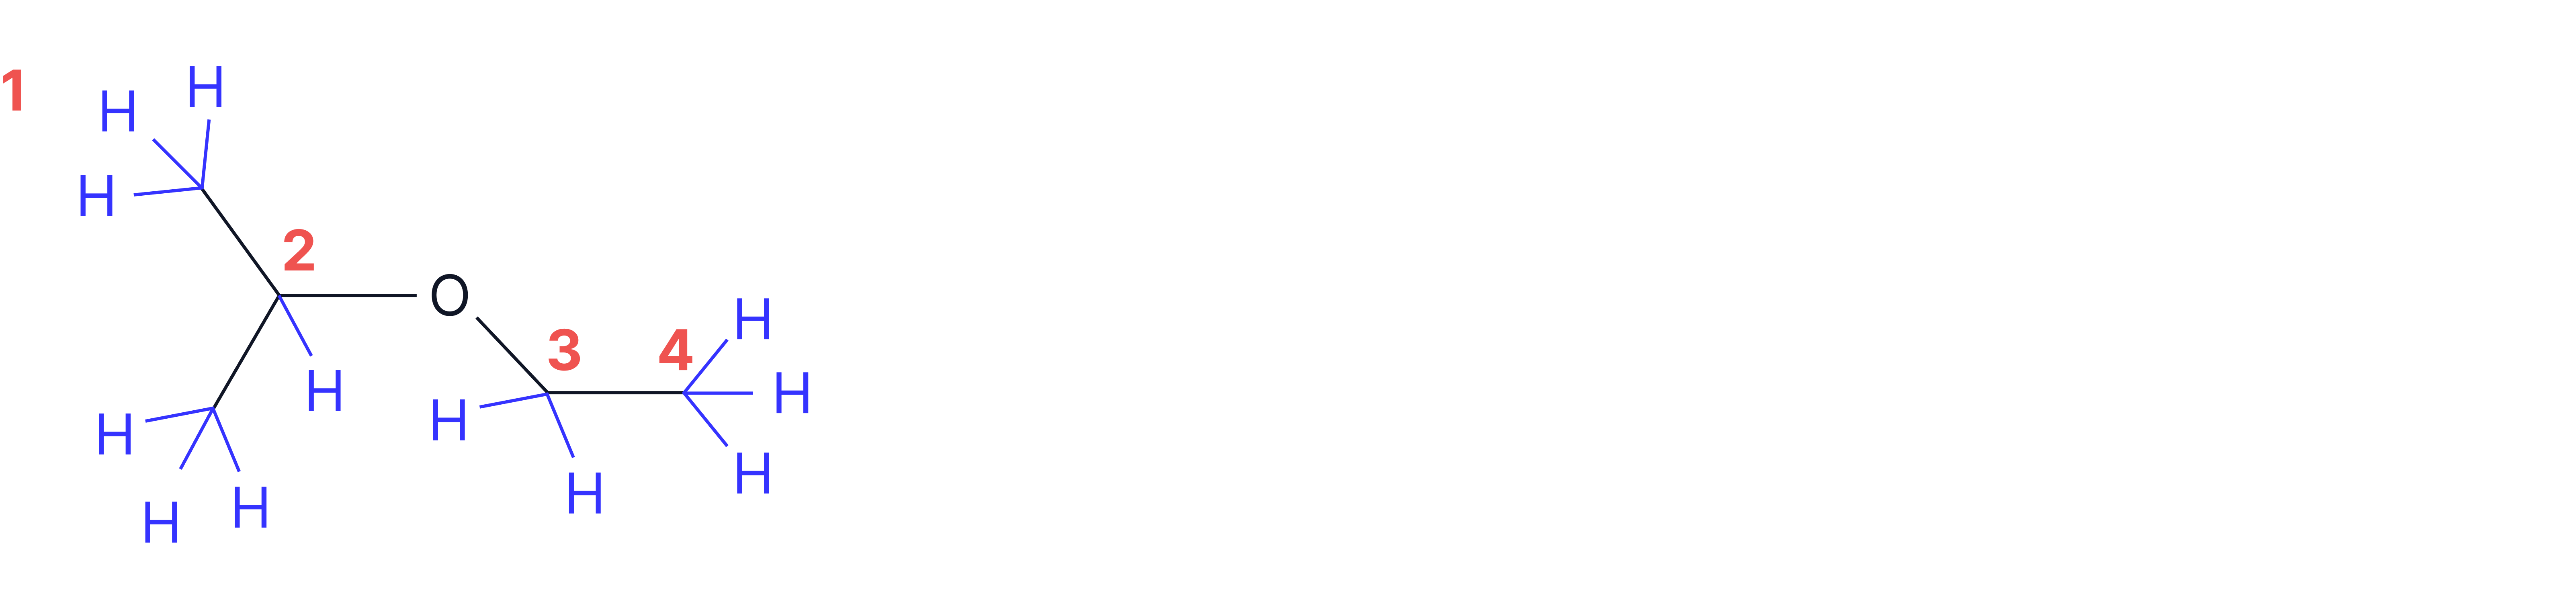
Answer

Chemical shift, δ / ppm | Relative peak area | Splitting pattern |
|---|---|---|
0.7 – 1.2 | 6 | Doublet |
3.1 – 3.9 | 1 | Multiplet (septet) |
3.1 – 3.9 | 2 | Quartet |
0.7 – 1.2 | 3 | Triplet |
Question 3: Structure Deduction
A compound has the formula . Its spectrum shows:
Singlet at 2.1
Triplet at 1.2
Quartet at 4.1
Deduce the structure of the compound.
Answer
Singlet with suggests group with no neighbouring protons.
indicates .
Triplet and quartet suggest ethyl group.
(quartet) indicates next to .
Molecular formula matches ethyl ethanoate .
Correct full structure drawn or named.