Monitoring Rates of Reaction
Dr. Davinder Bhachu & Lajoy Tucker
Teachers


Contents
What is the Rate of a Reaction?
The rate of reaction describes how quickly the concentration of a substance changes over time.
The rate of a chemical reaction is the change in concentration of a reactant or product per unit time.
Standard Unit:
Interpreting Graphs: Concentration vs Time
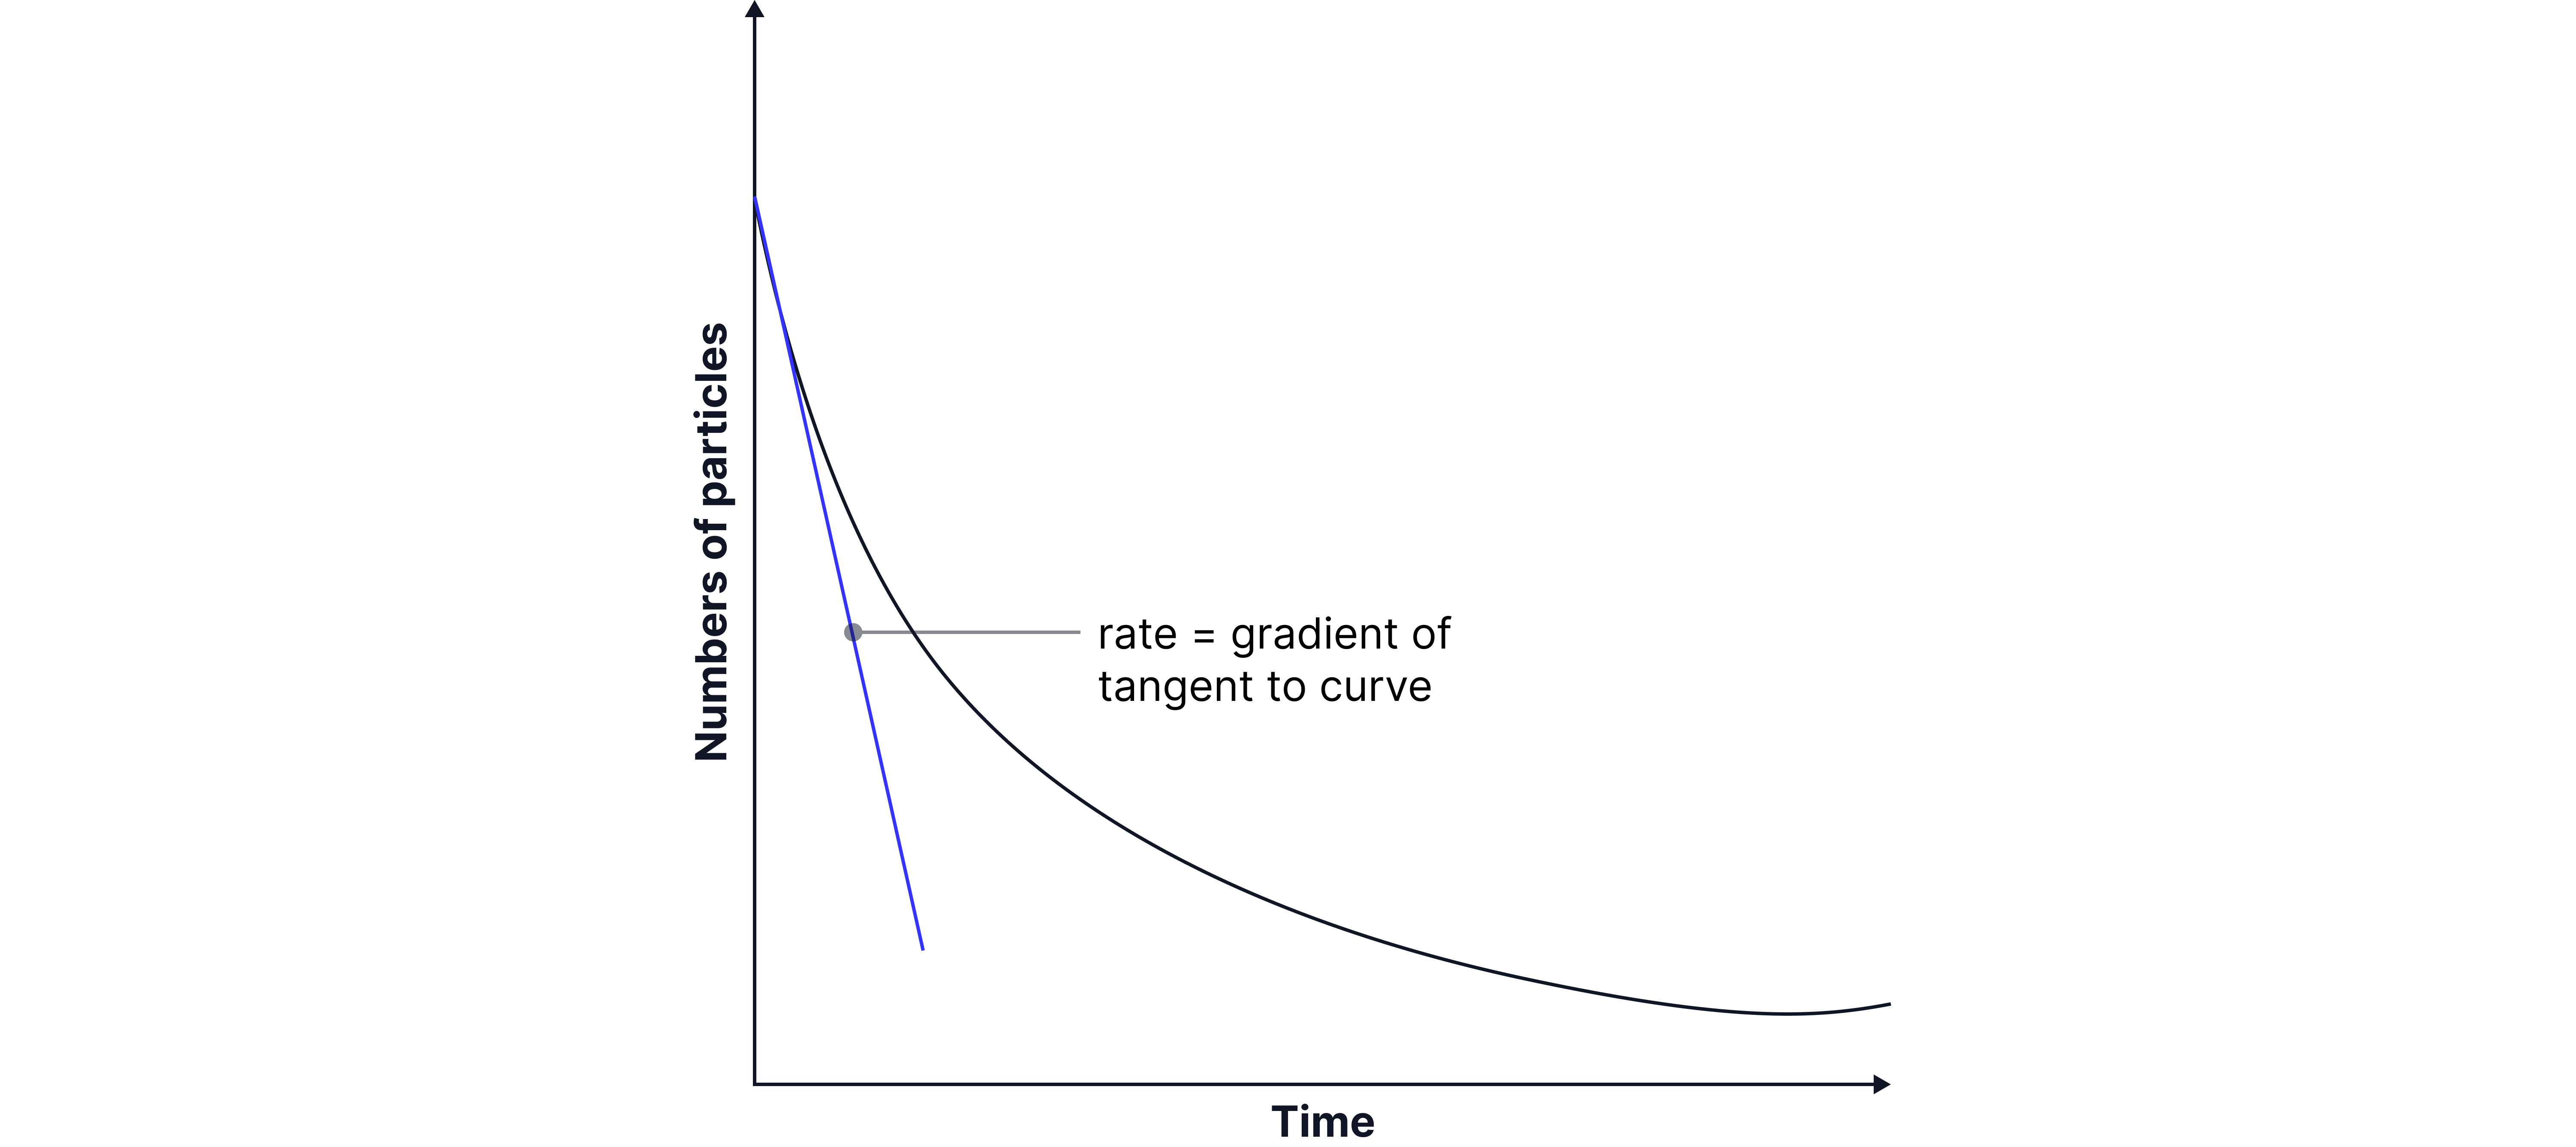
When you plot the concentration of a reactant against time, the steepness of the curve (the gradient) tells you the rate at that moment.
Initial rate: This is the rate at the very beginning of the reaction – it is always the fastest, as reactant concentrations are at their highest.
How to find the rate: Draw a tangent to the curve at the point you're interested in, then calculate the gradient (Δconcentration ÷ Δtime)
Tip: Use units consistently and make sure you're clear whether you're using reactant loss or product formation.
Using Graphs to Show Reaction Progress
Comparing Rate Graphs
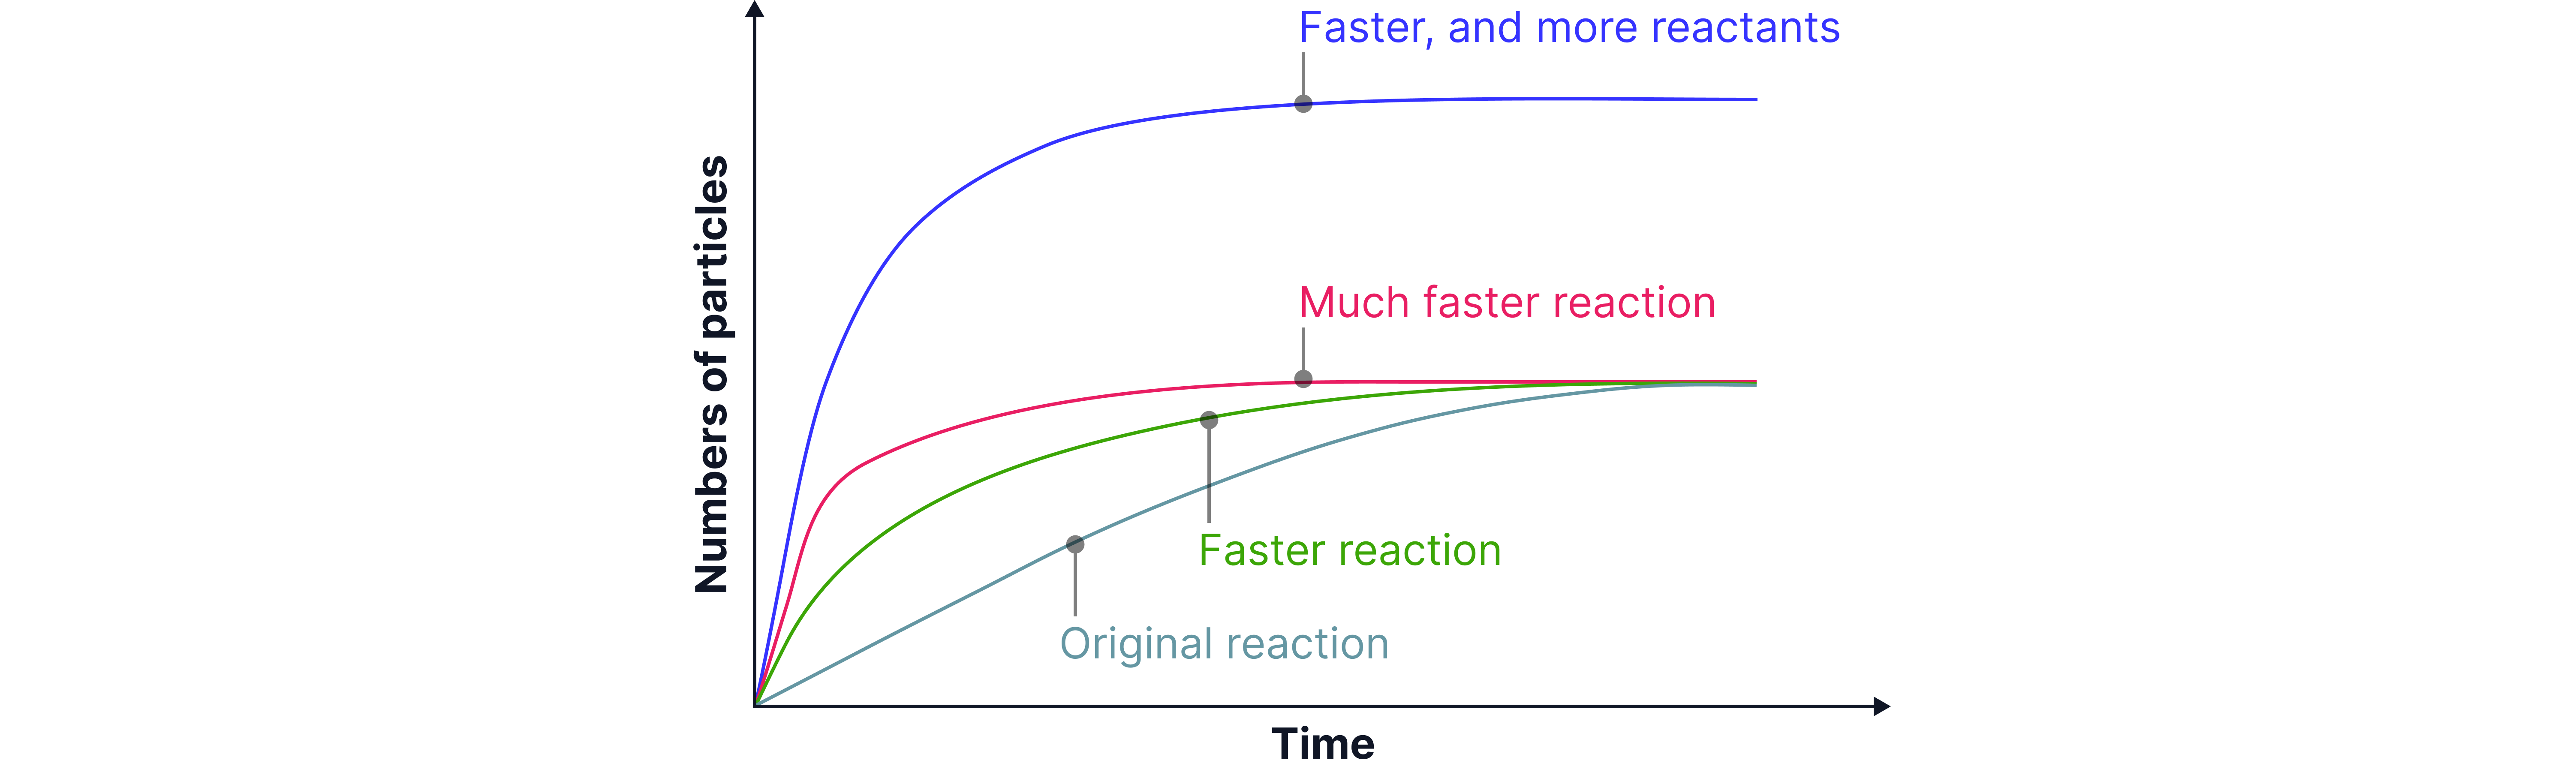
Once you’ve plotted data for how much reactant is used up or product is formed, you can compare different reaction rates on the same axes.
Key Idea: The steeper the curve, the faster the reaction.
Each curve shows how conditions like temperature, concentration, or surface area affect the reaction rate.
Step-by-Step Comparison
1. Look at the slopes:
The steepest line = the fastest initial rate (reaction starts quickly).
Lines that start steep but flatten quickly show reactions finishing faster
2. Check where they level off:
If all lines finish at the same height, the total amount of product formed is the same.
A line finishing higher means more product was formed, usually because more reactants were present.
3. Interpret the shape:
Curves that rise steeply then flatten show that the reaction slowed down as reactants were used up.
A horizontal line means the reaction has stopped completely.
Example: Comparing Reactions
A student reacted magnesium with hydrochloric acid at different temperatures:
30°C → slow reaction (gentle slope)
40°C → faster reaction (steeper curve)
50°C → even faster reaction
50°C with double the magnesium → fastest and highest curve (more product overall)
Interpretation: Increasing temperature or reactant quantity increases the reaction rate and, in some cases, total yield.
No answer provided.
Finding Mean Rate from Graphs
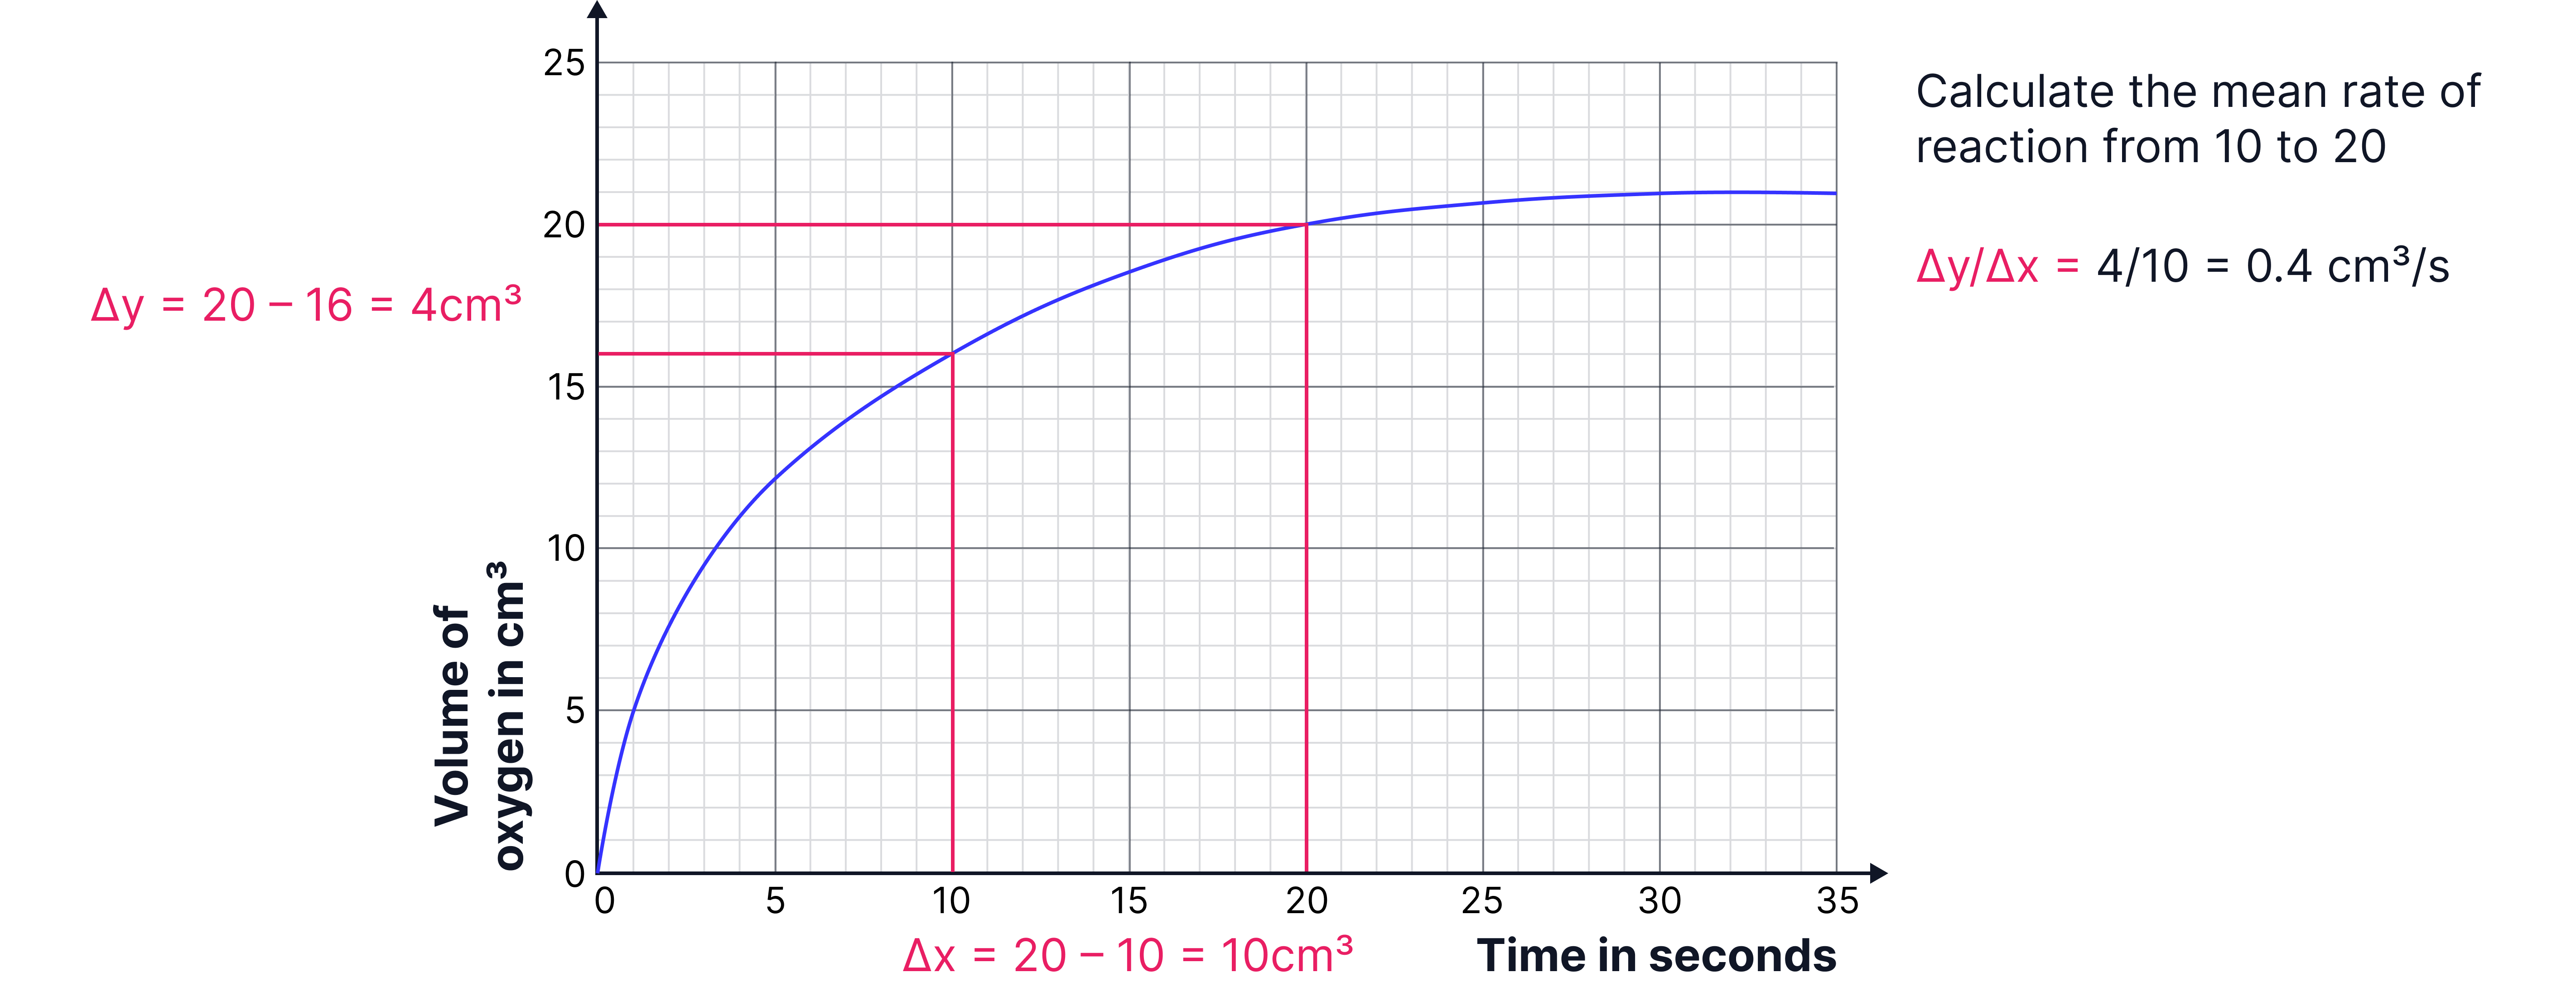
You can calculate the mean rate of reaction using any two points on your graph:
Example:
Between 10 s and 20 s, the volume of gas increased from 16 cm³ to 20 cm³
Interpreting rate graphs:
A graph of “quantity of product formed” or “reactant used up” against time shows how fast the reaction occurs.
A steep slope → fast reaction (high rate)
A gentle slope → slow reaction (low rate)
A flat line → reaction complete
Key idea: The slope (gradient) of the graph at any point represents the rate at that moment.
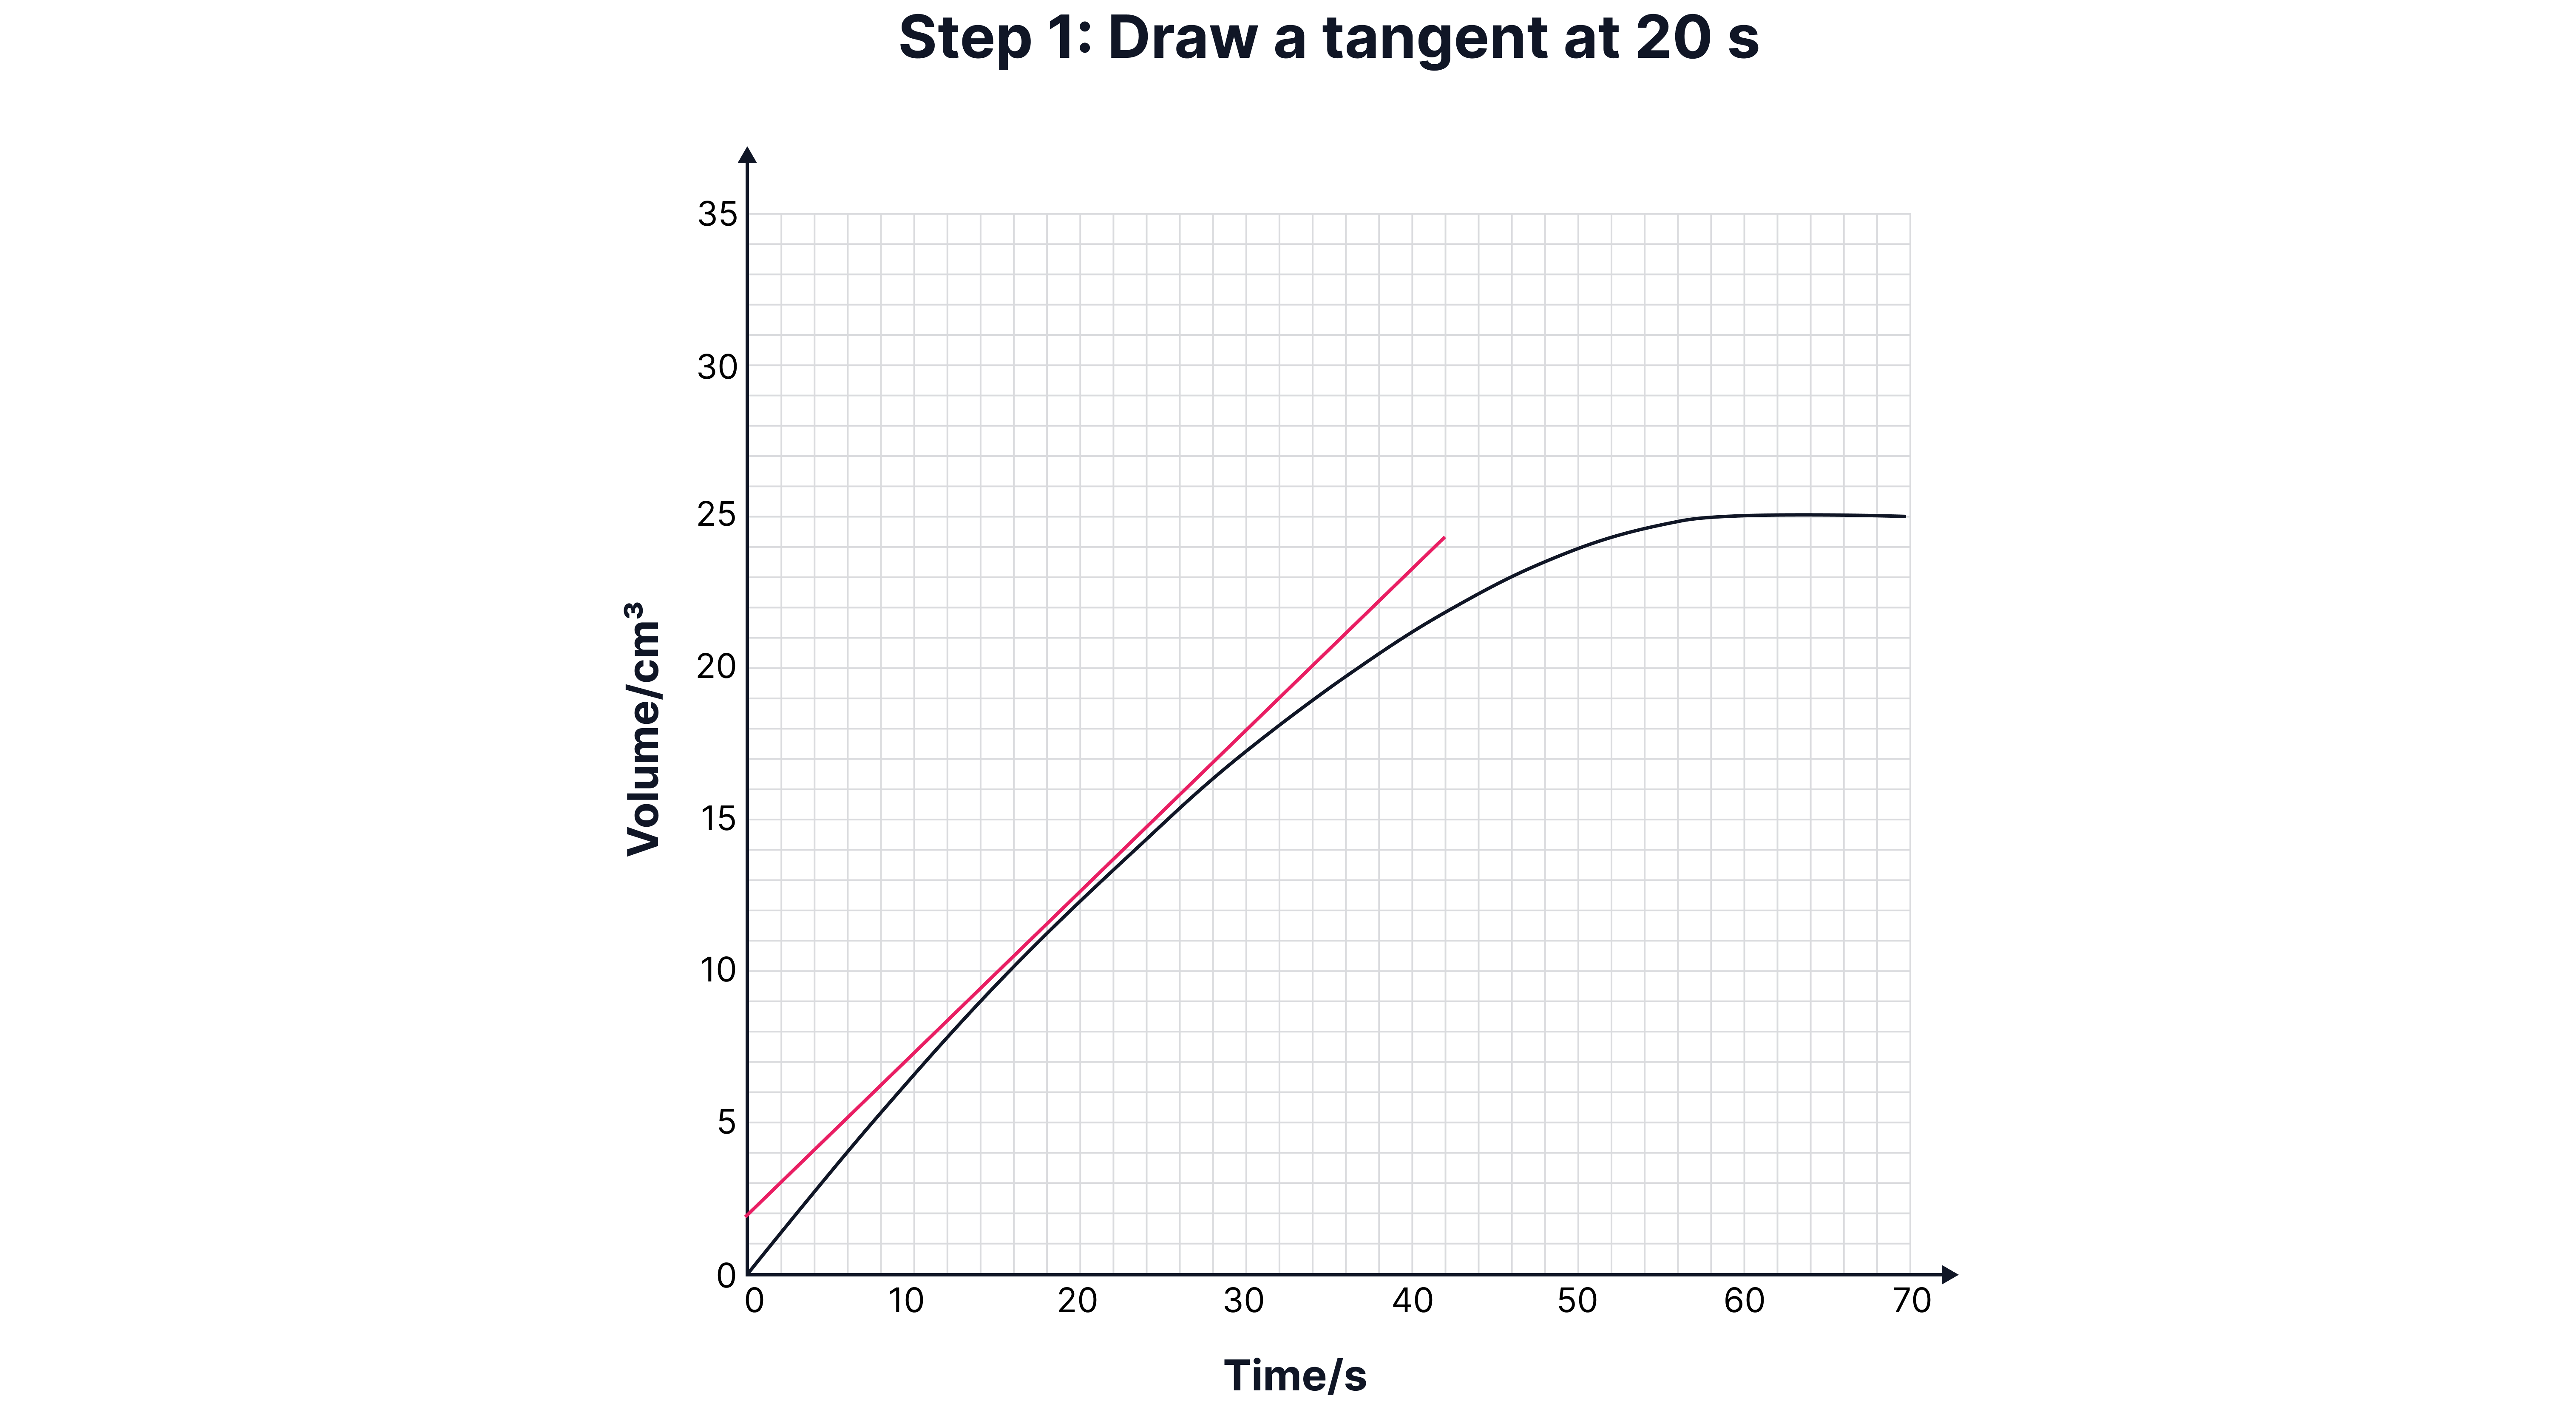
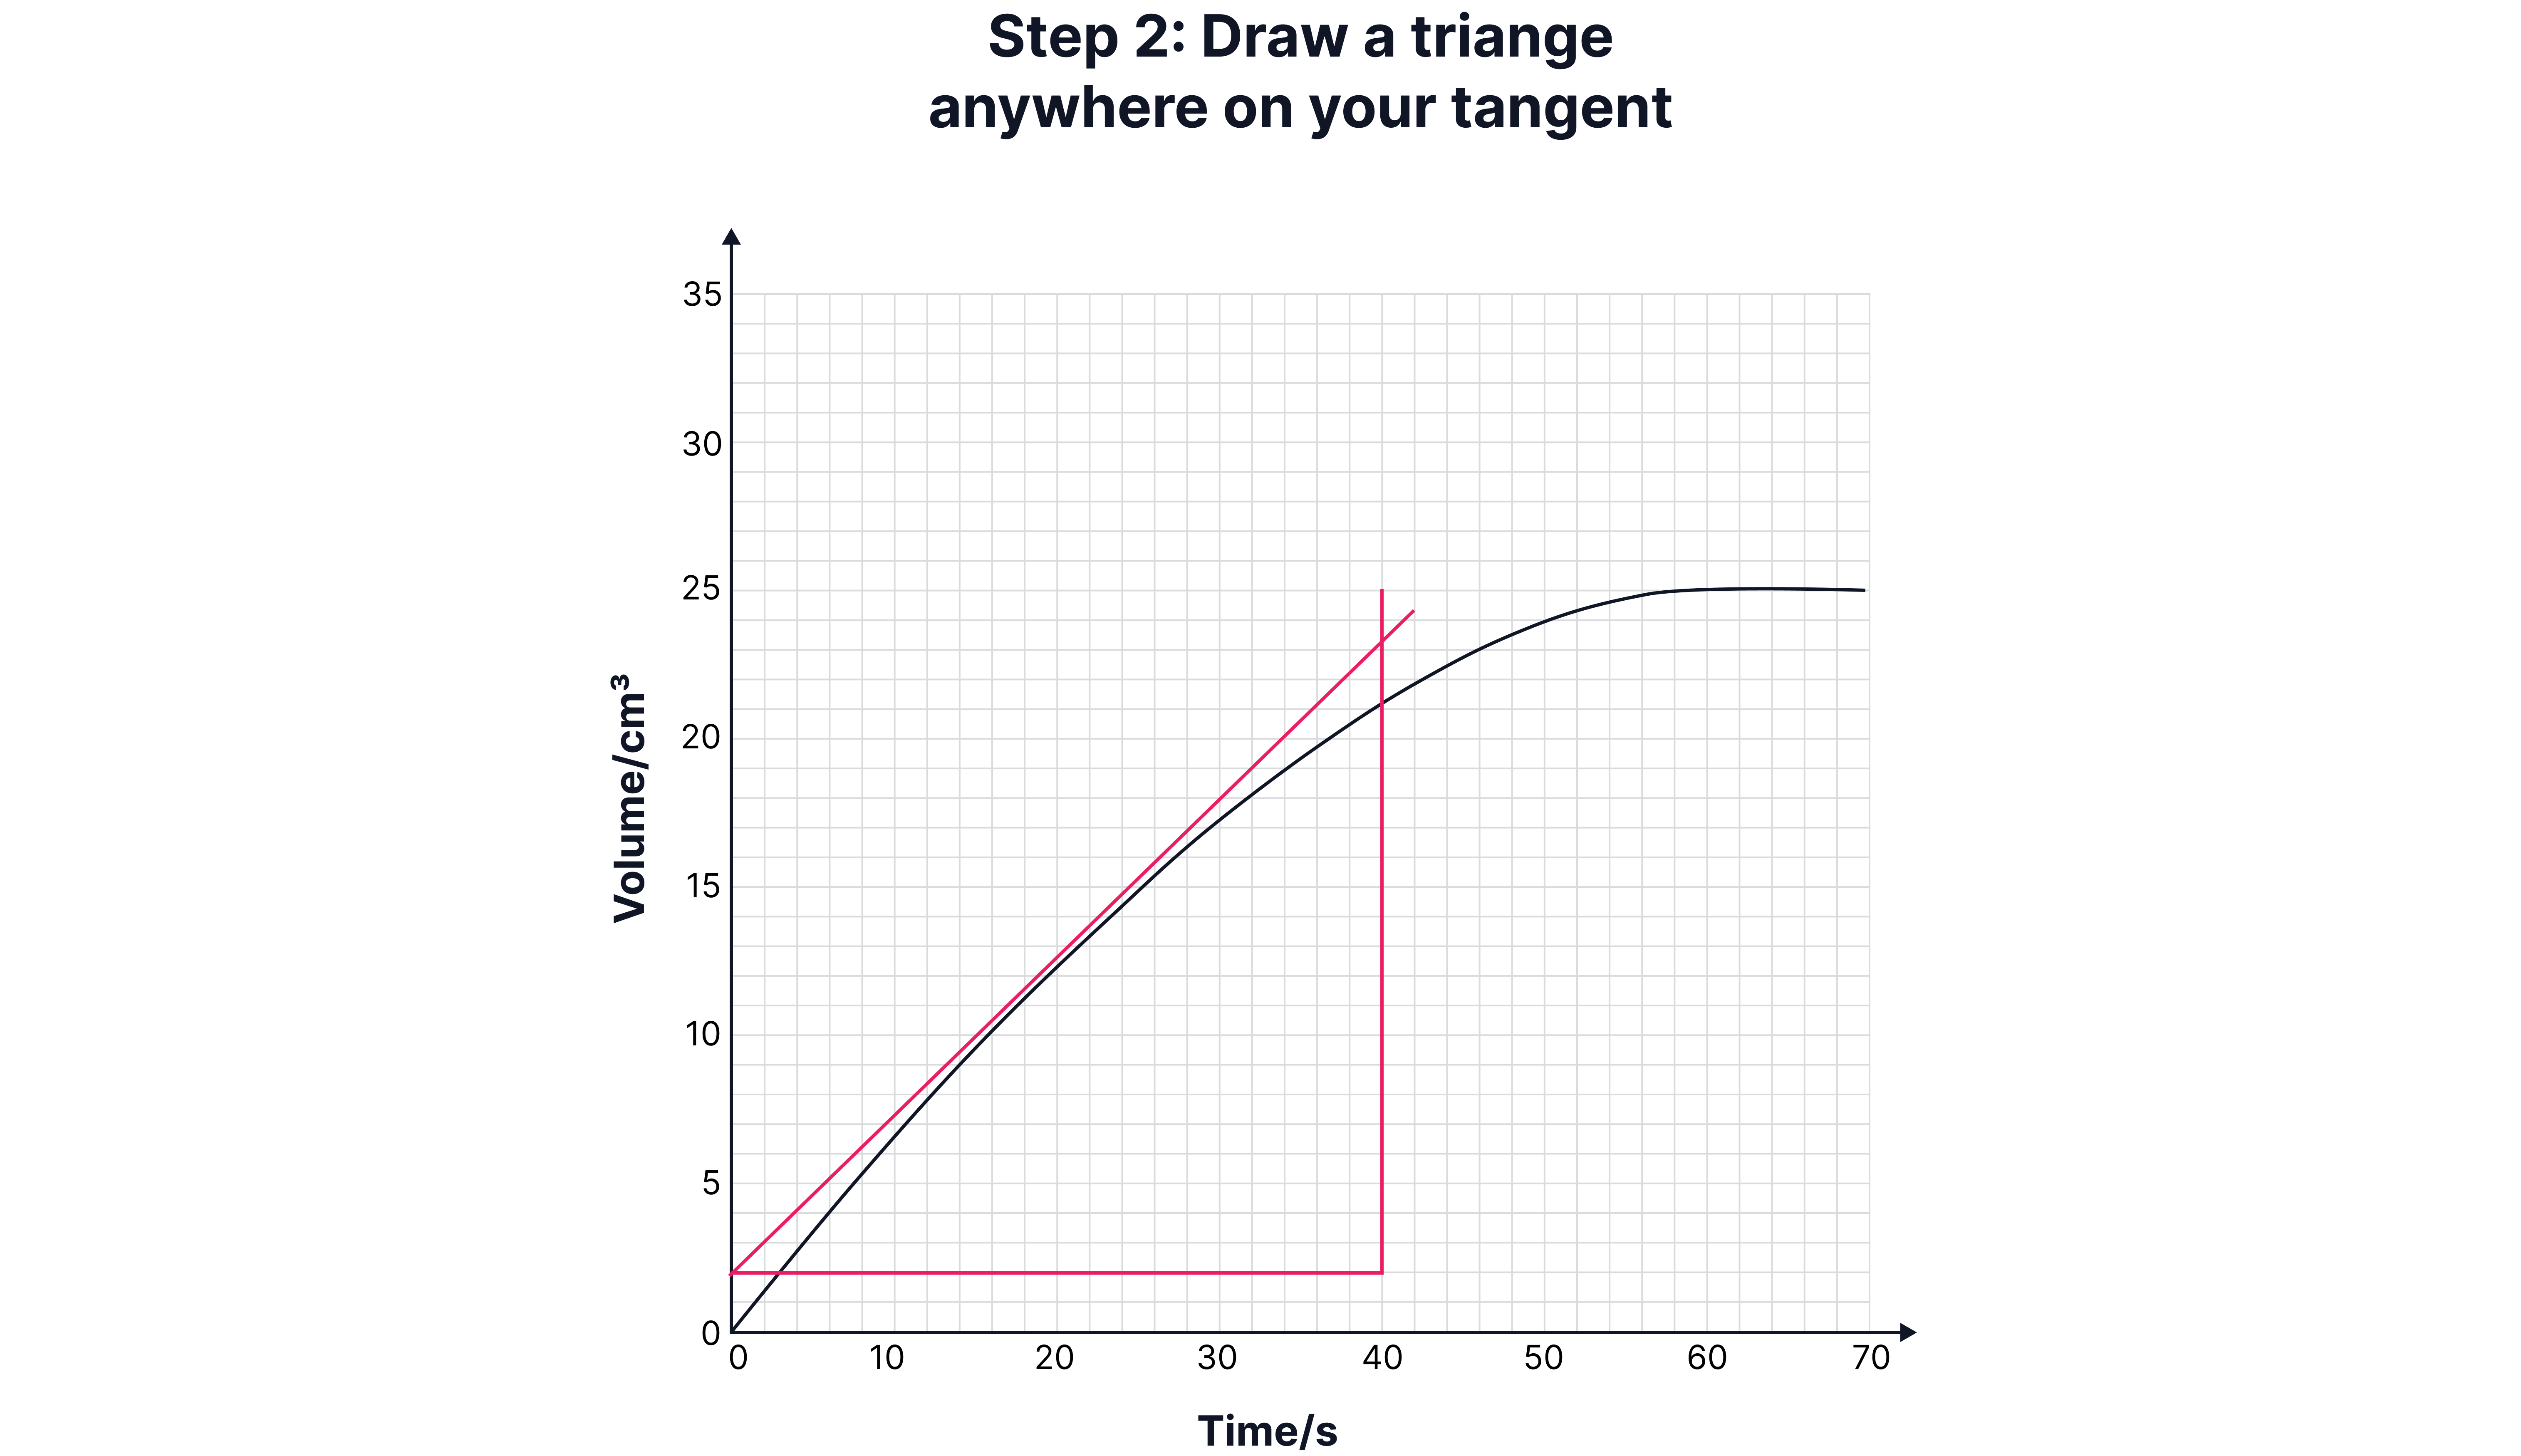
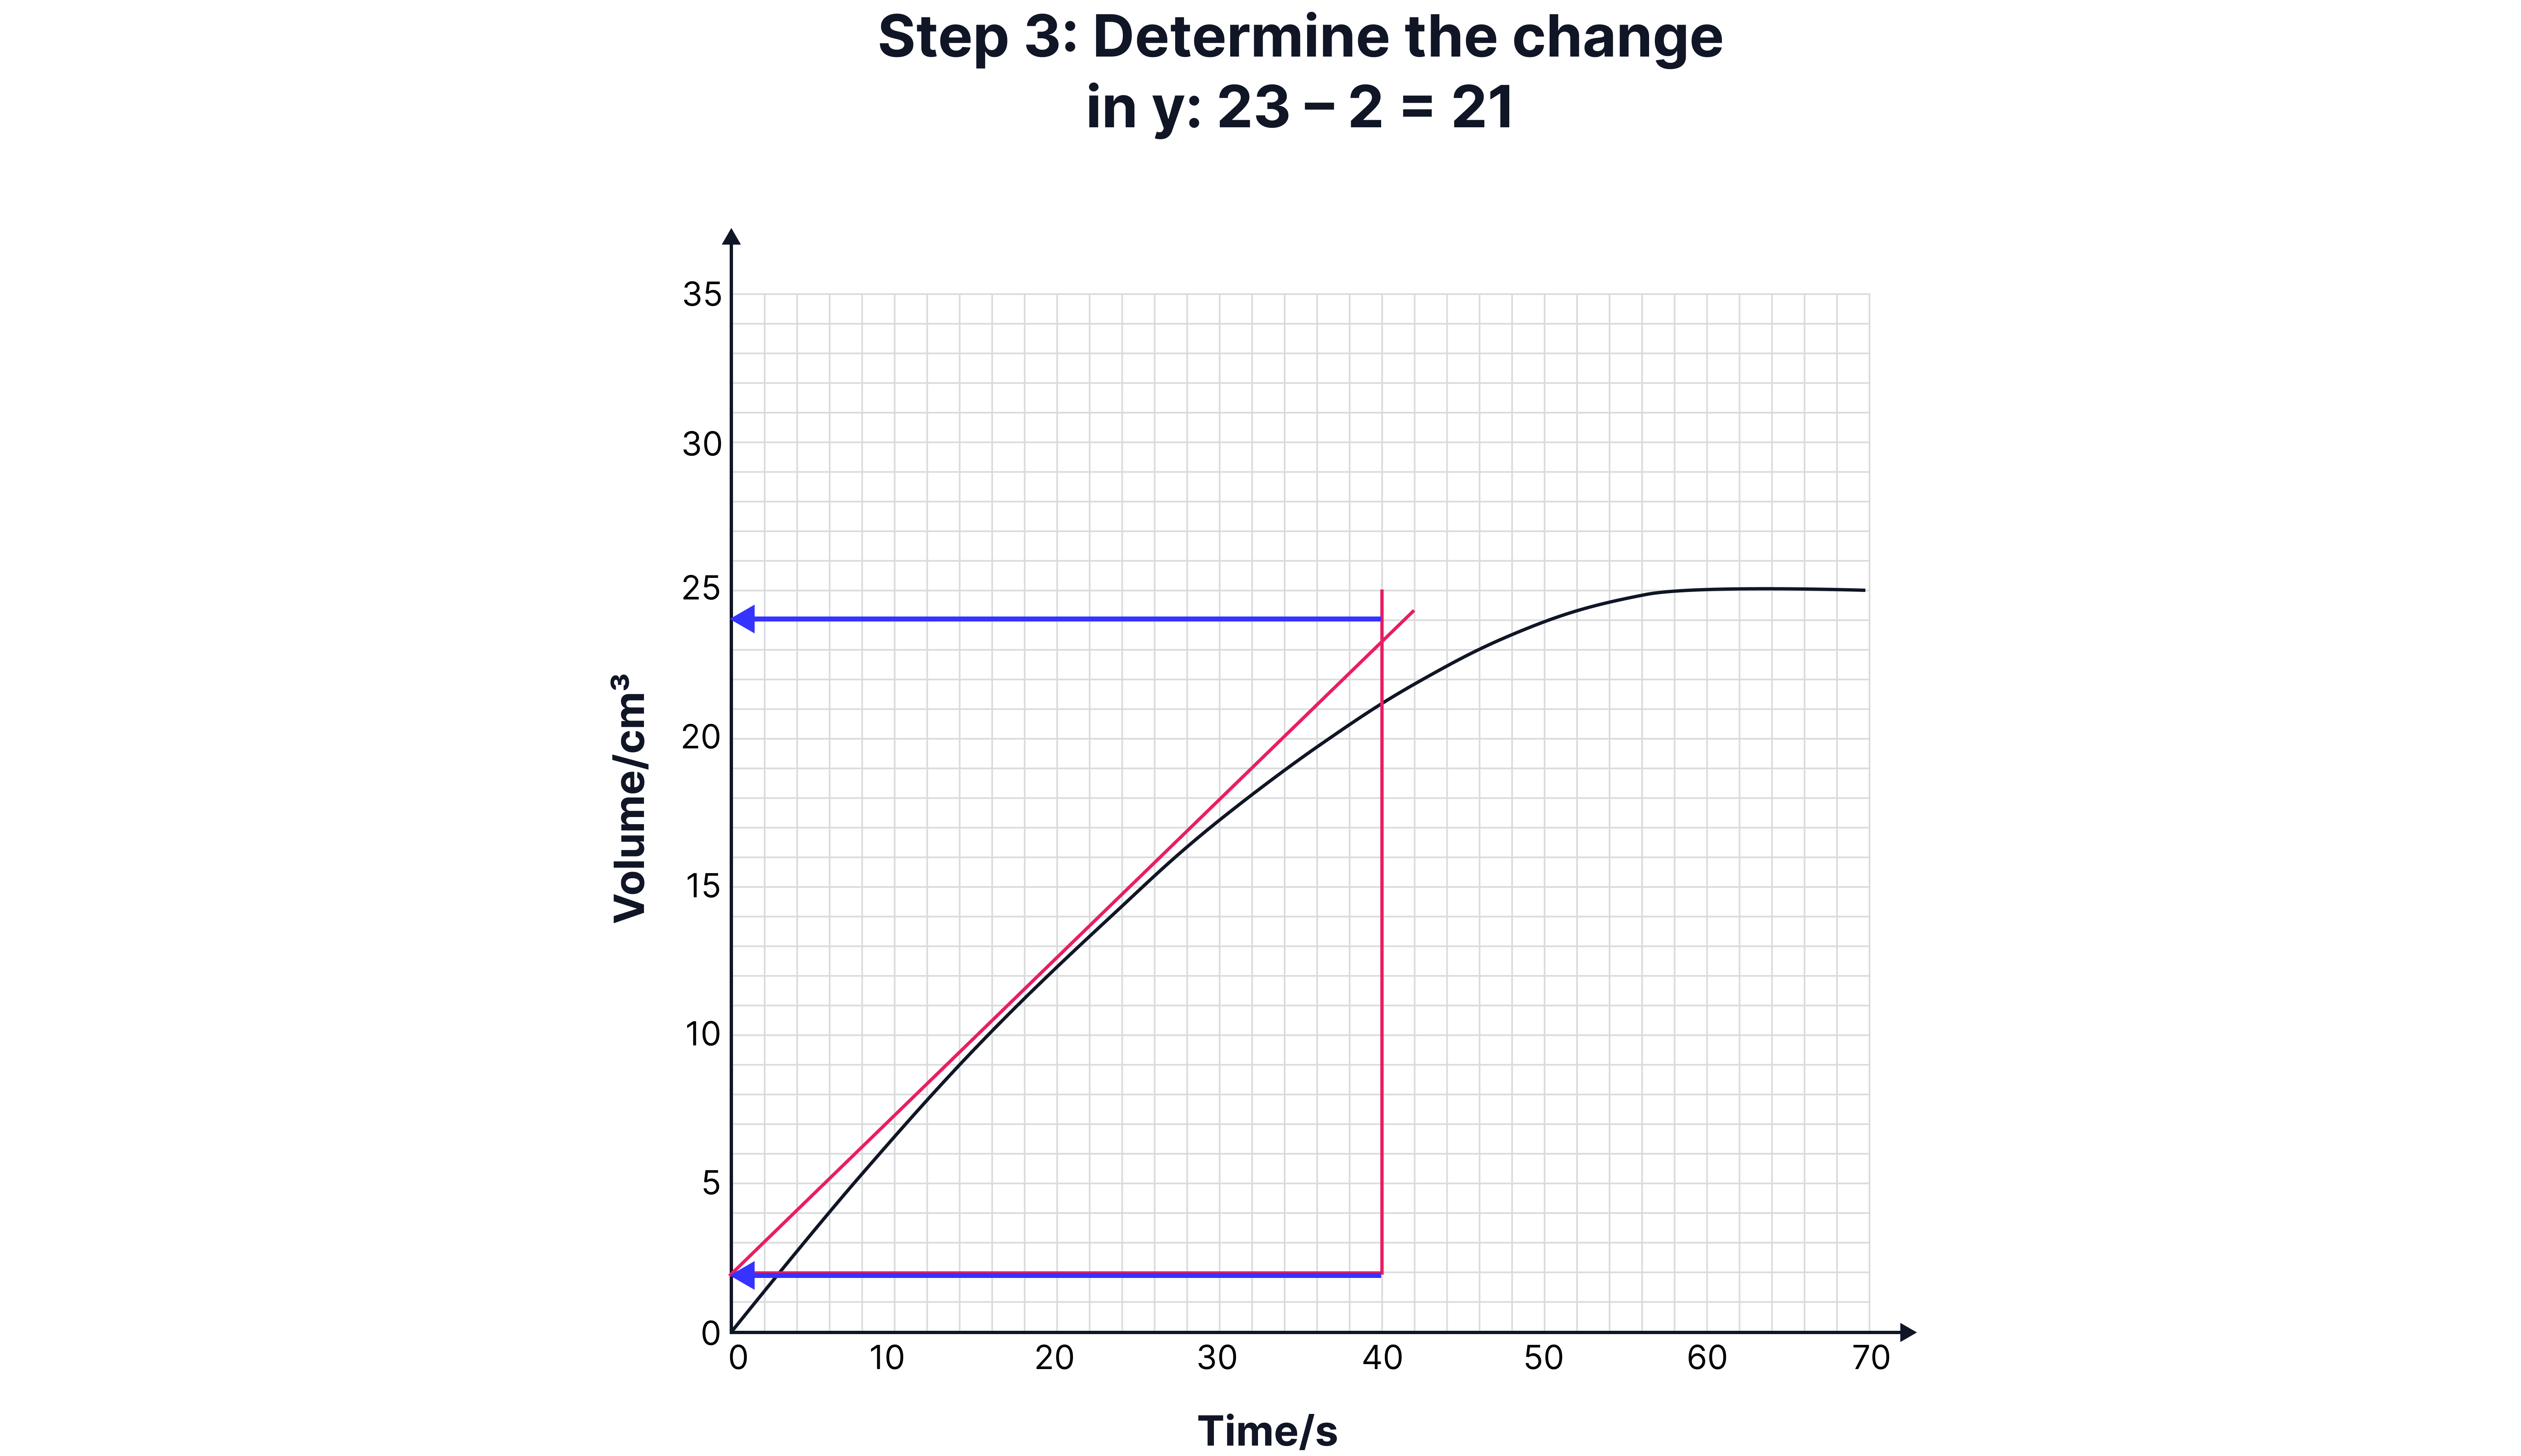
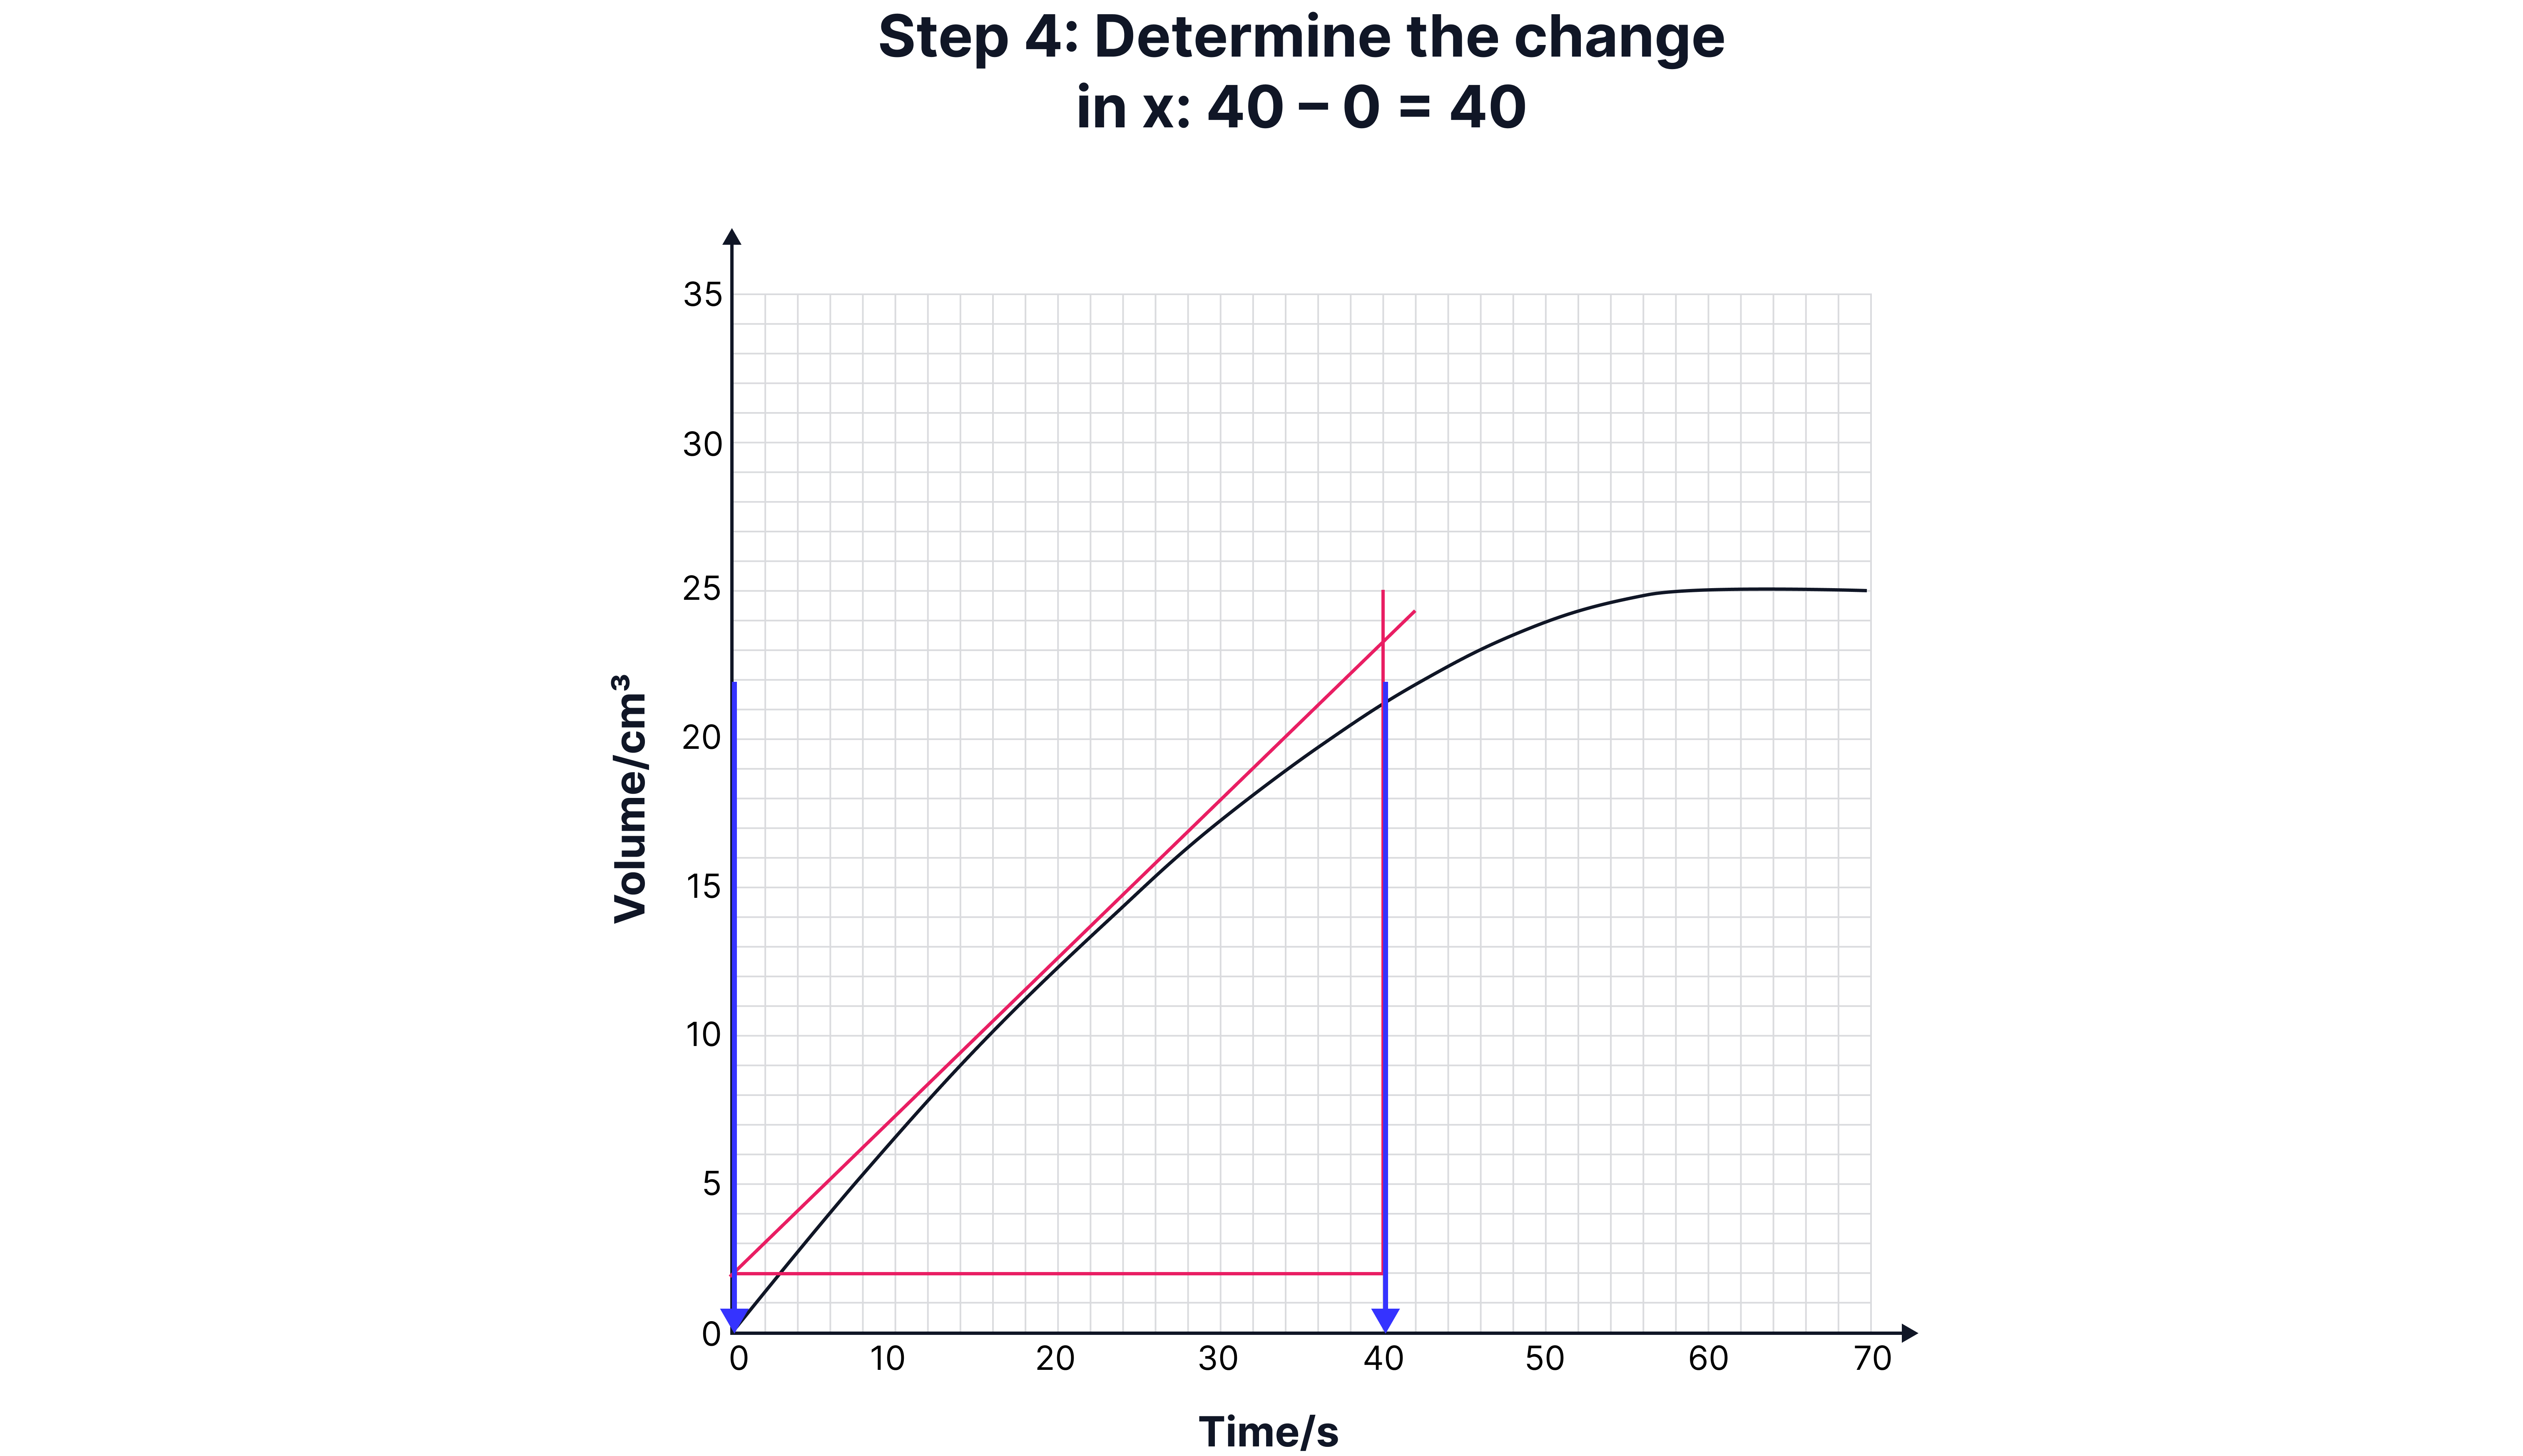
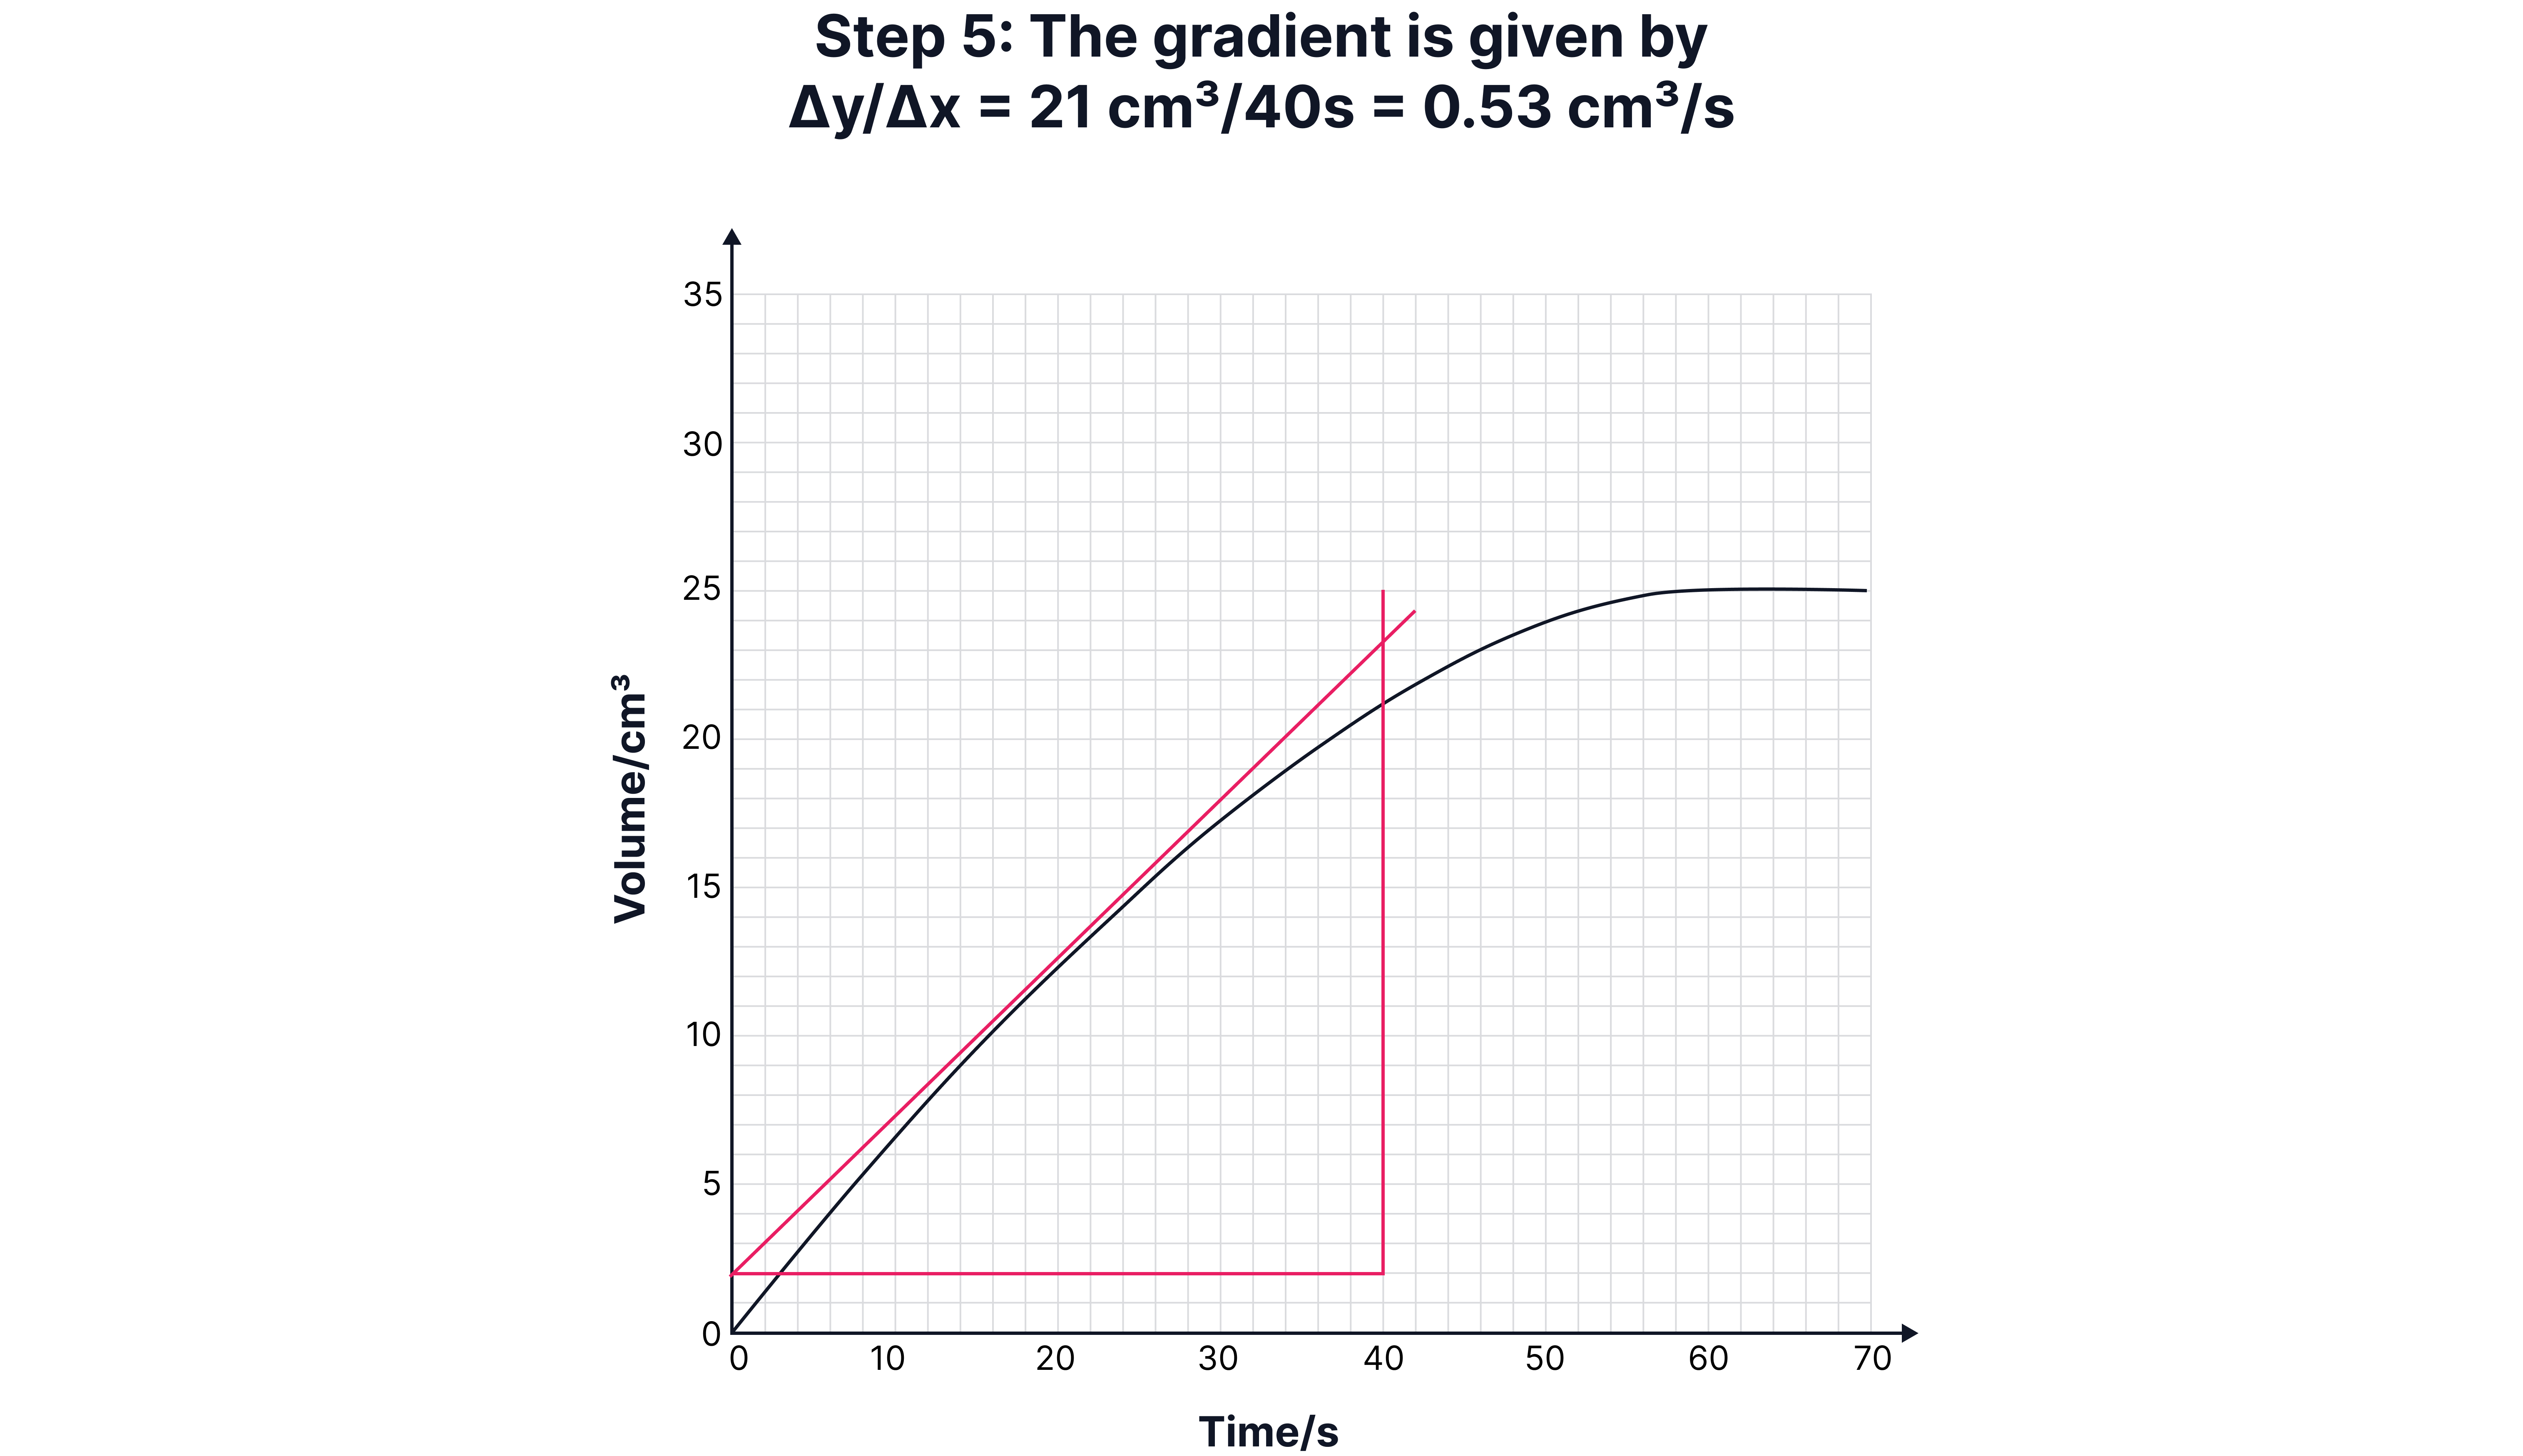
Calculating Instantaneous Rate (Using a Tangent)
Sometimes, you need the rate at a specific time (e.g., 15 seconds).
Draw a tangent to the curve at that point.
Construct a right-angled triangle under the tangent.
Calculate the gradient:
Worked Example:
No answer provided.
Ways to Measure the Rate
| What You Measure | How It’s Done | Example | Units |
| Mass loss | If a gas is released, the mass of the container decreases. | Calcium carbonate + acid → CO₂ | g/s |
| Gas volume | Use a gas syringe or an inverted measuring cylinder. | Magnesium + acid → Hydrogen | cm³/s |
| Colour change / cloudiness | Measure how long it takes for a mark to disappear through a mixture. | Sodium thiosulfate + acid | s⁻¹ (time taken used for comparison) |
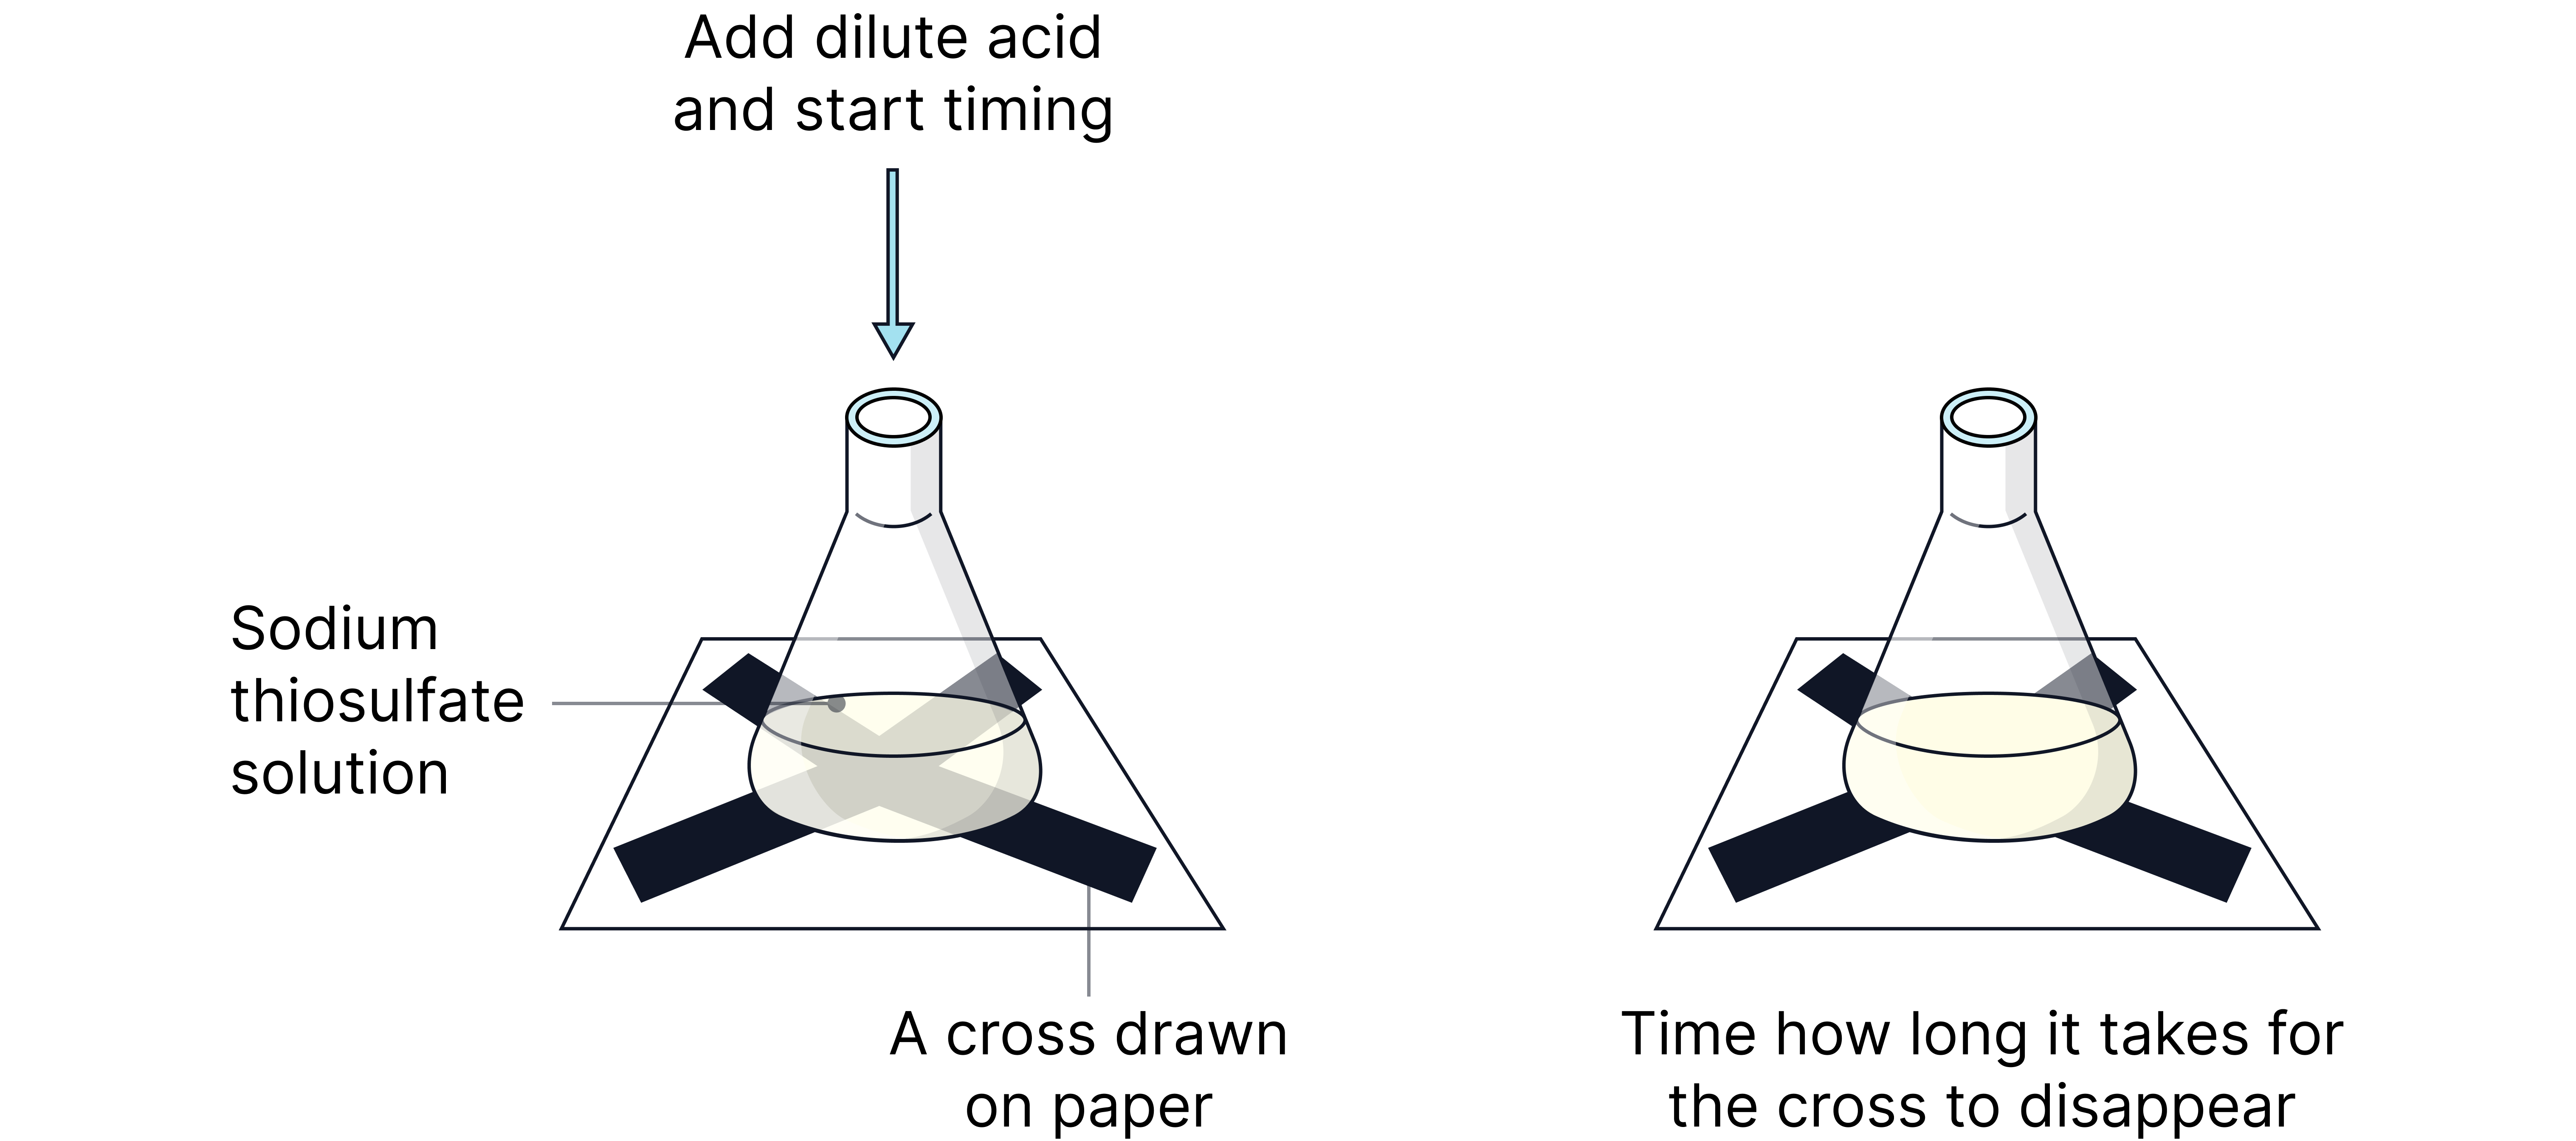
Method 1 – Disappearing Cross
A classic method to compare rates without using concentration directly:
Reaction:
In this reaction:
- Sulfur forms as a cloudy precipitate.
- A cross drawn beneath the reaction vessel becomes obscured over time.
- The time taken for the cross to disappear is recorded.
Rate estimation:
Use 1 ÷ time taken as a simple approximation for the rate.
Why this works:
We assume the same amount of sulfur is produced each time. Since that value is fixed and constant, a shorter time means a faster rate.
Note: This method doesn’t involve concentration, so it gives a relative rate, not an absolute one.
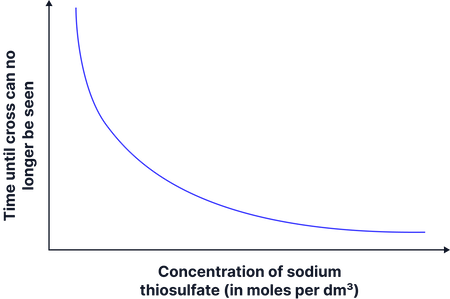
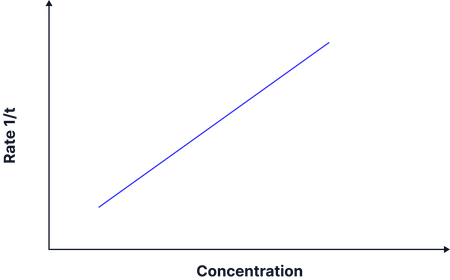
Typical graphs from the disappearing cross experiment:
The graphs below shows the time taken for the cross to disappear. When sodium thiosulphate of higher concentration is used then less time is taken for the cross to disappear, so the rate of reaction is higher. We can also see the corresponding rate (1/t) vs concentration graph.
No answer provided.
Method 2 - Volume of gas produced over time
Both downward delivery of gas and gas syringe collection are valid methods for monitoring how quickly a gas is produced in a chemical reaction. They each suit different types of gases, but follow the same core principle:
Measure the volume of gas produced over time to calculate the rate of reaction.
Gas Syringe Method
How it works:
-
A gas syringe is connected to a sealed reaction vessel.
-
As gas forms, it pushes the plunger outward.
-
Volume is recorded at regular time intervals.
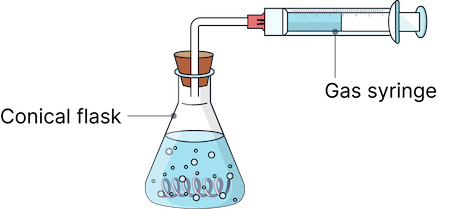
Suitable for:
-
Most gases
-
Accurate volume measurement (up to 100 cm³ or more)
Ideal for:
-
Insoluble gases like hydrogen, oxygen, or carbon dioxide.
Rate determined by:
Plotting volume vs time, then calculating gradient.
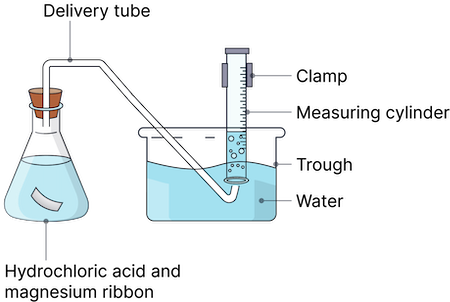
Displacement of Water
How it works:
-
Gas is directed into an inverted measuring cylinder filled with water and placed in a water trough.
-
The gas displaces the water downward as it collects at the top of the cylinder.
-
The volume of gas collected can be measured using the cylinder’s graduations.
Examples:
-
Chlorine (Cl₂)
-
CO₂
-
H₂
-
Hydrogen chloride (HCl)
Rate determined by:
Tracking volume collected vs time, then finding gradient.
e.g
This reaction produces hydrogen gas, making it ideal for monitoring rate by measuring gas volume over time.
Fastest Rate at the Start
-
At the start of the reaction, the concentration of H⁺ ions is at its maximum.
-
There is a high frequency of collisions between the acid particles (H⁺) and the surface of the magnesium metal.
-
More collisions per unit time = higher frequency of successful collisions (i.e. collisions with energy ≥ activation energy, Eₐ).
-
This leads to the maximum rate of hydrogen gas production at the beginning.
Why the Rate Decreases Over Time
-
As the reaction proceeds, H⁺ ions are consumed, so their concentration decreases.
-
Fewer acid particles are available to collide with the magnesium surface.
-
Therefore, the frequency of successful collisions decreases, and the rate of reaction slows.
-
This is visible as a flattening gradient on a graph of gas volume vs time.
Why the Reaction Eventually Stops
-
The reaction stops when one of the reactants is fully consumed – usually the magnesium or the acid (depending on which is in excess).
-
At this point, no further collisions can occur between the two reactants, so no more product (H₂) is formed.
-
On a graph, this appears as a plateau, where gas volume remains constant over time.
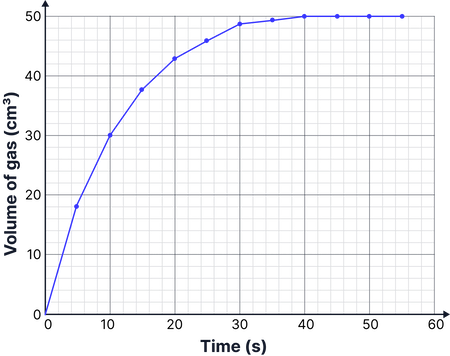
-
Start of curve (0–10 s):
Reaction rate is highest here – reactant particle concentration highest so the collision frequency is highest -
Middle of curve (10–30 s):
Gas is still being produced but at a slower rate as reactants are being used up so fewer successful collision -
Plateau (after 40 s):
No further gas produced – all the acid has reacted (limiting reagent fully used)so no more successful collisions are possible
No answer provided.
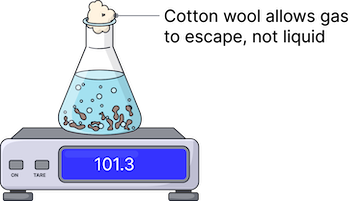
Method 3 - Monitoring Rate Using the Mass Loss Method
Reaction:
How the Mass Loss Method Works
-
A conical flask containing magnesium and hydrochloric acid is placed on a digital balance.
-
As the reaction proceeds, hydrogen gas escapes from the flask.
-
The mass of the flask decreases over time due to the loss of gas.
-
The mass is recorded at regular time intervals (e.g. every 10 seconds).
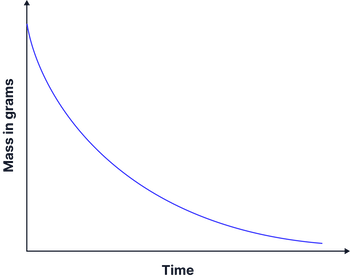
How It Measures Rate
-
The faster the mass decreases, the faster the reaction is occurring.
-
A graph of mass lost vs time can be plotted.
-
The gradient of the curve at any point gives the rate of reaction.
-
The initial gradient (at t = 0) represents the initial rate.
No answer provided.