RP2 - Measurement of an Enthalpy Change
Lajoy Tucker
Teacher

Contents
Key Terms:
Enthalpy change : The change in heat energy at a constant pressure.
Exothermic reaction: Releases heat energy, is negative.
Endothermic reaction: Absorbs heat energy, is positive.
Calorimetry: Technique used to measure heat energy changes in chemical reactions.
Specific heat capacity : Amount of energy needed to raise the temperature of of a substance by .
No answer provided.
Basic Principles
The heat transferred to the surroundings (usually water) is calculated using:
where:
heat energy
mass of solution
specific heat capacity (usually for water)
temperature change ( or )
To calculate ΔH per mole:
( in , convert to by )
Experimental Procedure Overview:
Objective: To determine the enthalpy change of a reaction using calorimetry.
Examples:
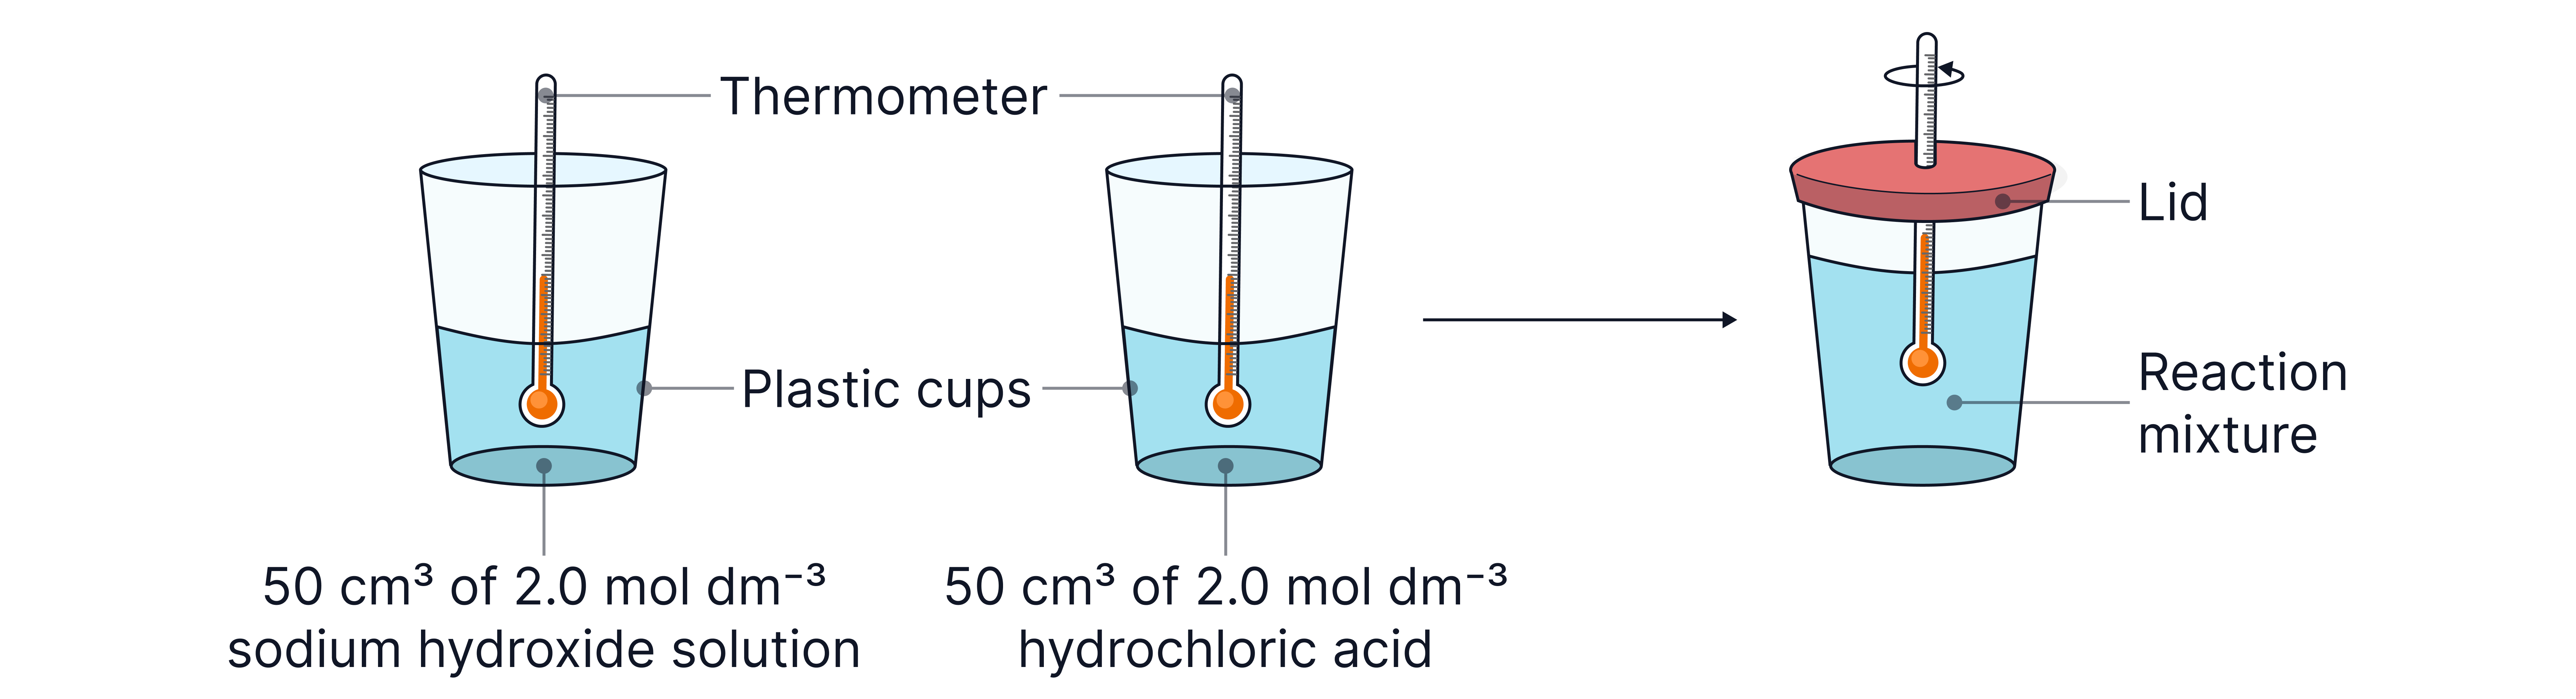
Neutralisation (e.g. )
Dissolution (e.g. in water)
Displacement (e.g. )
Apparatus Needed:
Polystyrene cup with lid – good thermal insulator to reduce heat loss
Thermometer ( divisions or better)
Measuring cylinders or pipettes
Balance (2 d.p.)
Beaker (for preparing solutions)
Diagram of set-up:
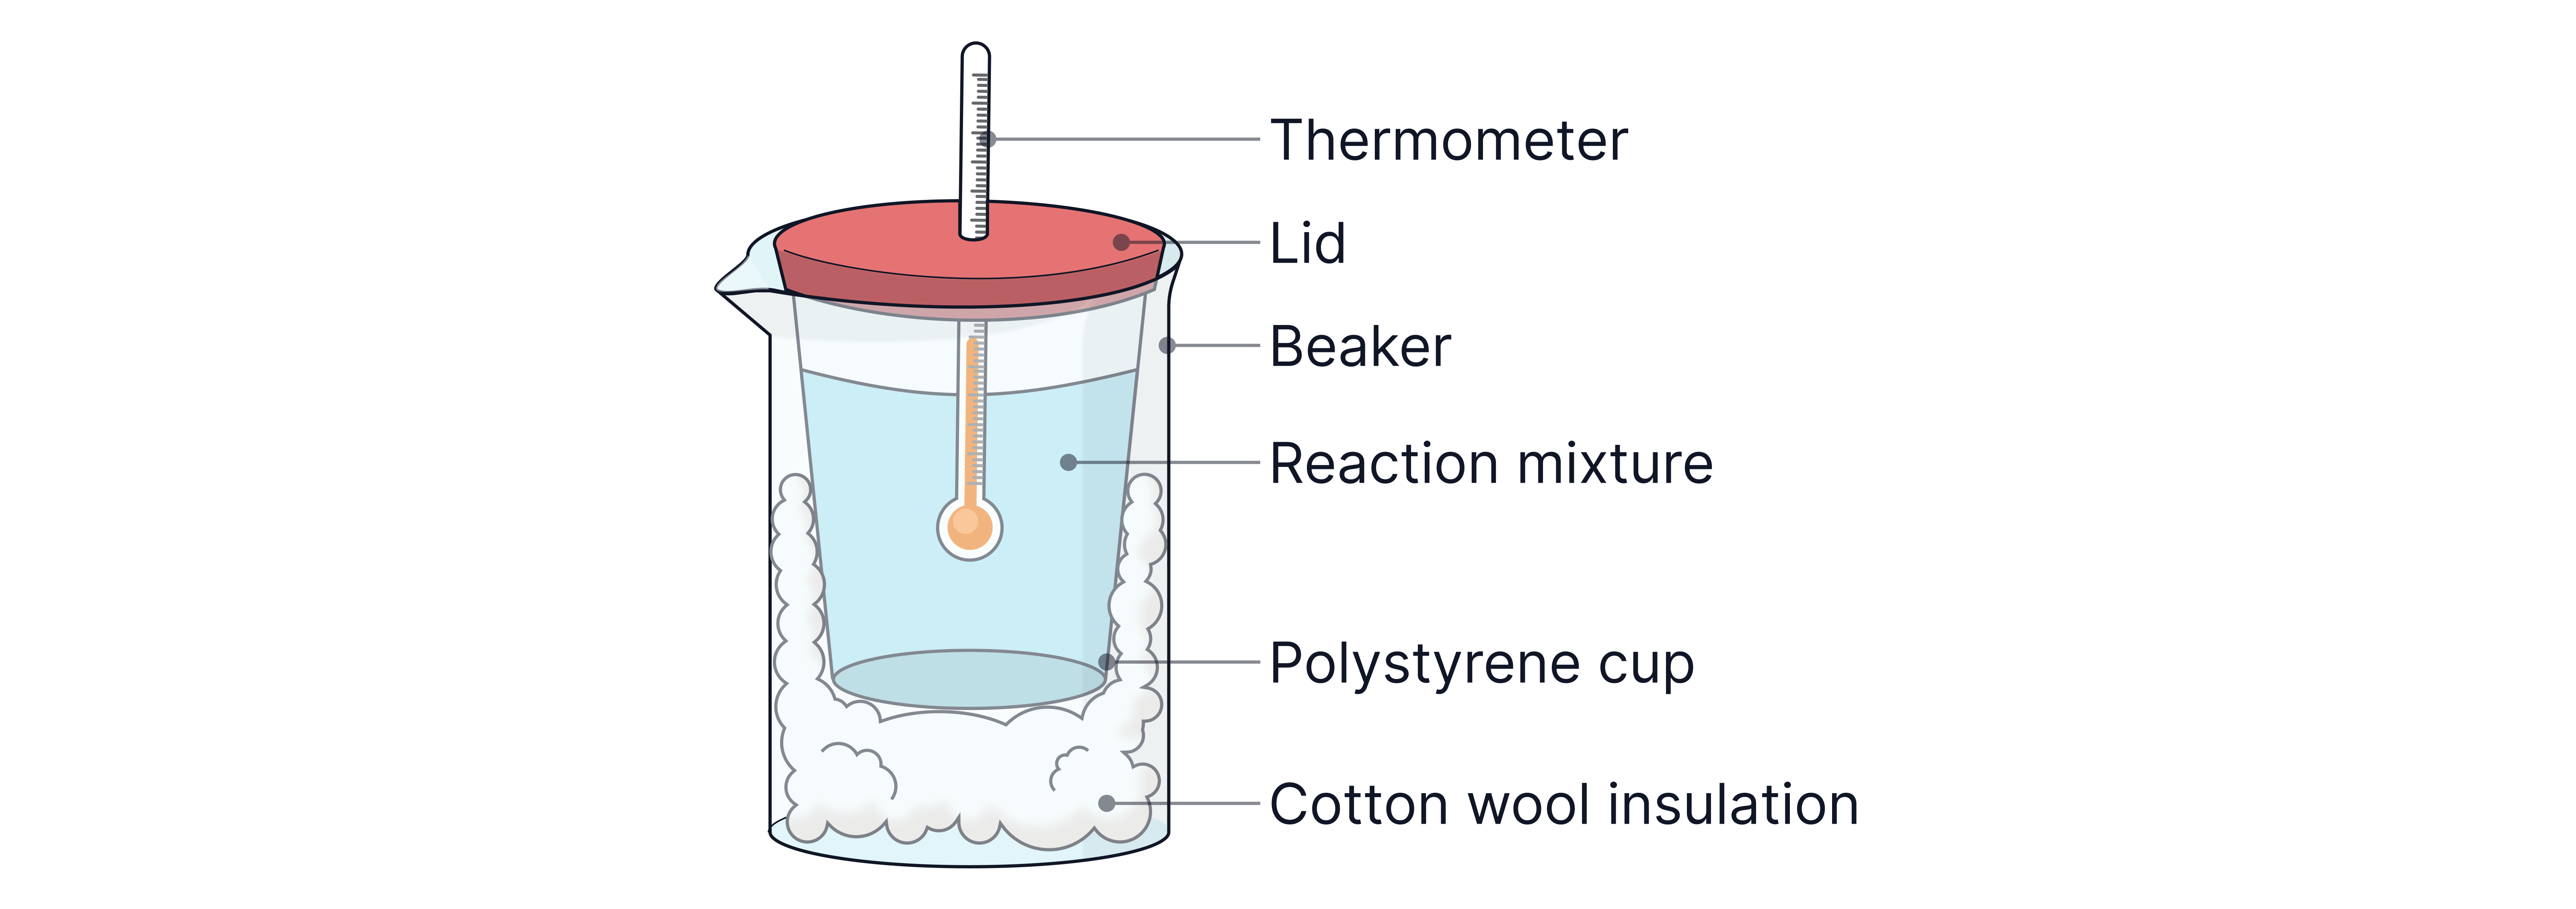
The bulb of the thermometer must be fully submerged in the solution.
The polystyrene cup can also be placed in a glass beaker with cotton wool for additional insulation.
No answer provided.
Method Steps (Dissolution example)
1. Measure out approximately of solid anhydrous copper (II) sulfate into a bottle. Record the mass of the bottle with its contents
2. Add of distilled water to dry, clean polystyrene cup using a measuring cylinder and record the initial temperature
3. Start the timer
4. Record initial temperature every minute for 3 minutes.
5. At minute 4, quickly add the solid to the water and stir (do not record the temperature)
6. Continue recording the temperature every minute for at least a further 10 minutes
7. Reweigh the empty copper(II) sulfate bottle and subtract from the first recorded mass. This allows determination of the accurate mass of solid added
8. Plot temperature vs time.
9. Draw two lines of best and extrapolate to the minute of mixing
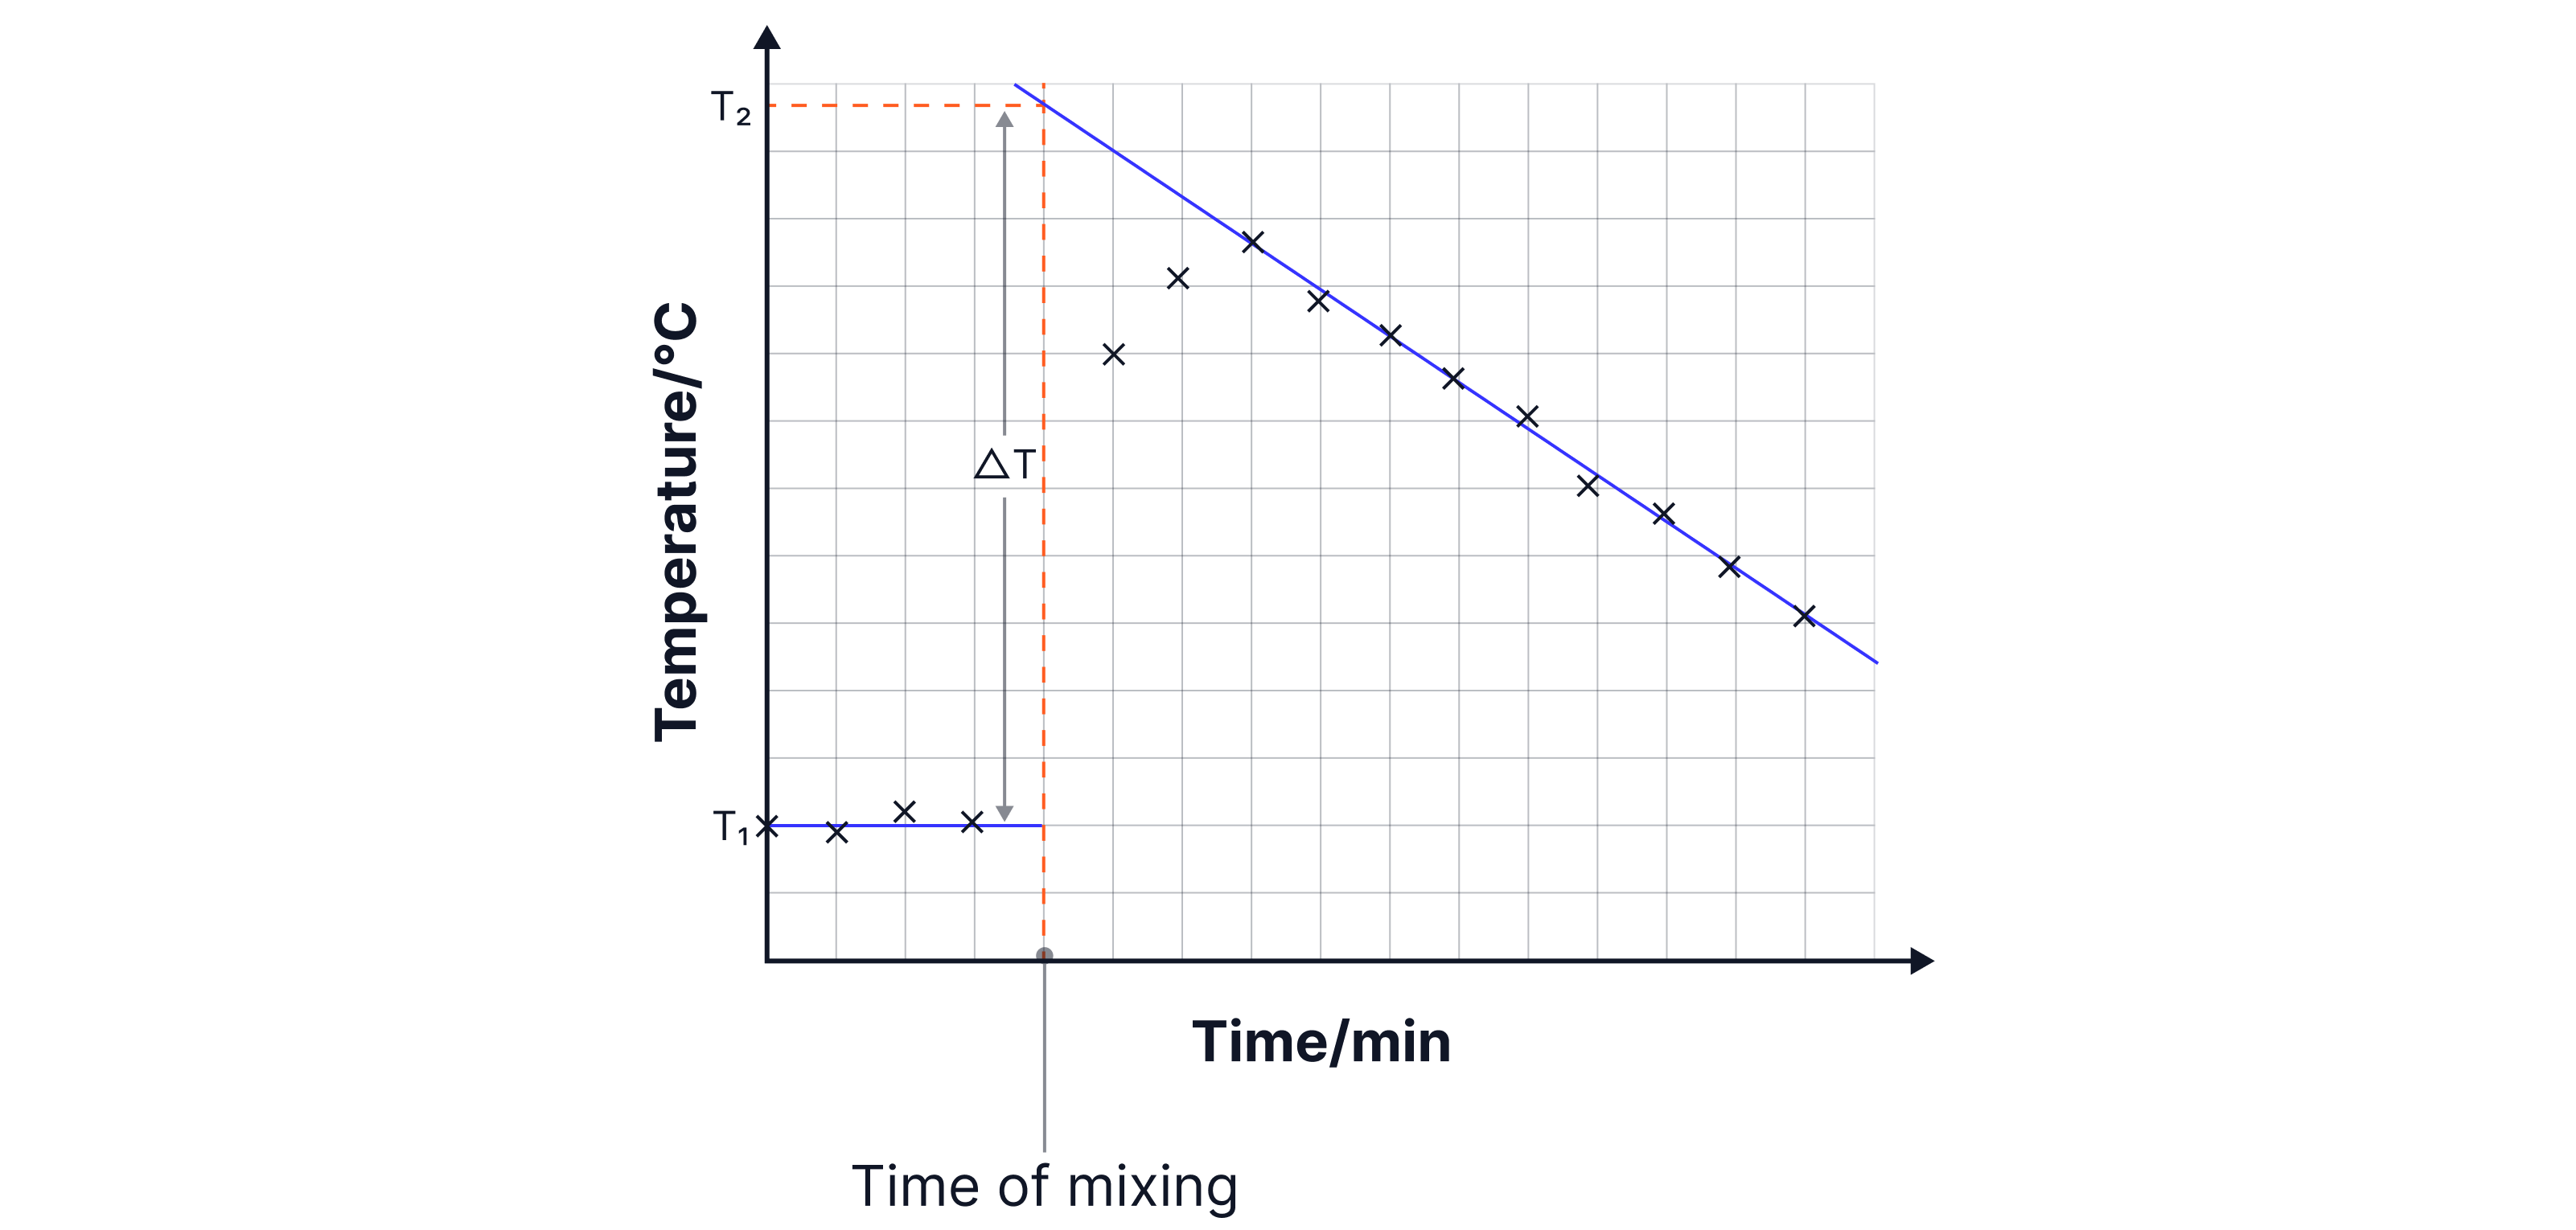
The vertical difference between the two extrapolated lines gives , the maximum temperature change.
Use to calculate heat energy transferred.
Calculate
Where is the number of moles of the limiting reagent.
The graph produced is a cooling curve and accounts for heat lost to the surroundings. Using the extrapolated lines to determine assumes that the maximum temperature change occurs at the minute of mixing, and the temperature decreases at a rate that follows the line of best fit.
Note – where two solutions are used, the initial temperatures of both must be measured prior to mixing.
No answer provided.
The mass of solution used in calculations would be the combined mass after mixing.
Further Assumptions:
No heat loss to surroundings.
Solution has same density & specific heat capacity as water.
The specific heat capacity of the container is ignored
Reaction/dissolution has gone to completion
Percentage uncertainty
Uncertainty is often assessed here related to the change in temperature.
Percentage uncertainty = [(absolute uncertainty x number of readings)/measure value] x 100
Absolute uncertainty is inherent to the thermometer itself e.g.
Number of readings = 2 (initial temperature and final temperature)
Measured value = temperature change
Worked Example
The absolute uncertainty in each thermometer reading is . Calculate the percentage uncertainty for a temperature increase of
Answer
Percentage uncertainty = [(absolute uncertainty x number of readings)/measure value] x 100
Reducing Percentage Uncertainty
Using the same apparatus, percentage uncertainty can only be reduced by increasing the measured value (the denominator).
To increase the temperature change, modifications would require an increased number of moles of the limiting reactant. This would result in more collisions between particles and therefore a greater change in temperature.
Therefore, to have a greater temperature increase and a lower percentage uncertainty, solutions of higher concentrations could be used.
Key Tips & Reminders
Always use mass of the total solution, not just one component.
Use appropriate sig. figs based on data provided.
Extrapolate temperature vs time graph to find most accurate.
Watch units: energy in , enthalpy in .
Further calorimetry calculation practice (including combustion calorimetry) can be found in the ‘Calorimetry’ revision note.
No answer provided.