Averages for Discrete Data
Neil Trivedi
Teacher

Contents
Averages for Discrete Data
Discrete data is data that can only take certain individual values, usually values we count, such as the number of goals scored, shoe sizes or test marks. This is different from continuous data, which is measured and can take any value in a range, such as height or time. Everything in this note applies to discrete data.
An average is a single value that summarises an entire data set, with one number chosen to represent all the values at once. Averages let us describe and compare data quickly. For example, instead of comparing every individual test score from two classes, we can simply compare one average mark from each class.
In GCSE Maths there are three averages, and each one is useful for different purposes.
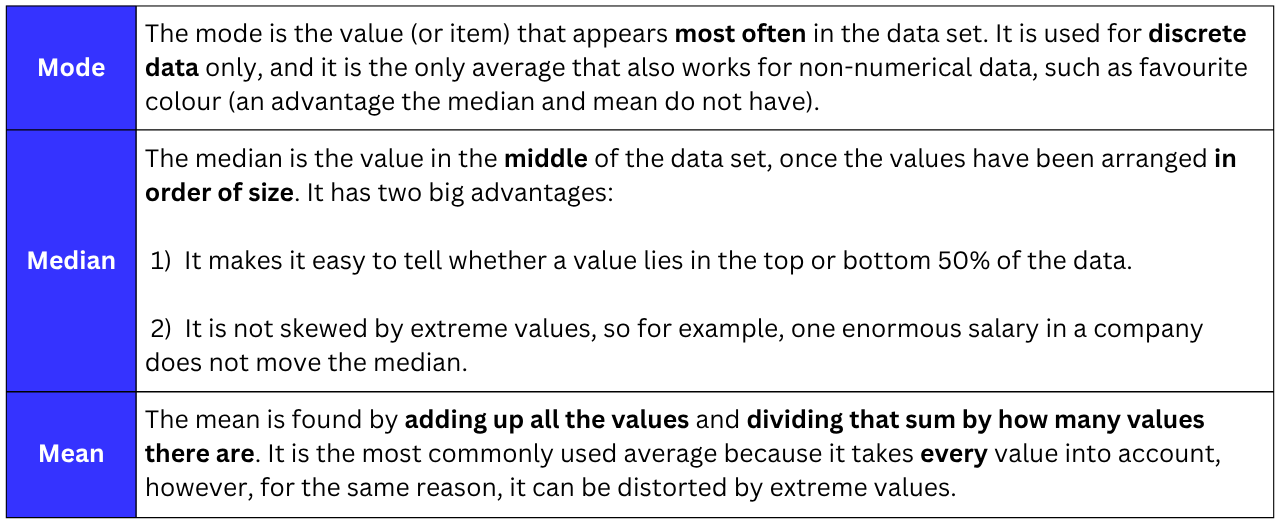
Alongside the three averages, questions frequently ask for the range. The range is not an average, but a measure of spread, telling us how spread out the values are rather than where their centre is.
The Range
Range Largest value Smallest value
A small range means the values are close together (consistent); a large range means they are more spread out.
Note: because the range only uses the two end values, a single extreme value can make it misleading. Later in the course, you will meet the interquartile range (see our Quartiles note), which is often a better measure of spread for exactly this reason.
Example 1:
Find the mode, median, mean and range of the following list of numbers:
Step 1: Check the data is in order of size.
The list is already written in ascending order (smallest to largest), so we can work with it straight away. Counting the values, there are of them.
Step 2: Find the mode, which is the value that appears most often.
The value appears twice, while every other value appears only once.
Therefore, the mode is
Step 3: Find the median: cross off pairs from the outside in.

Crossing off one smallest and one largest value at a time leaves the two middle values, and When two values are left in the middle, the median is halfway between them, so we add them and divide by
median
Therefore, the median is
Step 4: Find the mean: add up all the values and divide by how many values there are.
mean
Therefore, the mean is
Note: the mean does not have to be one of the values in the list. In fact, it does not even have to be a whole number.
Step 5: Find the range: largest value minus smallest value.
range
Therefore, the range is
Working Backwards from the Mean
In many exam questions, we are given the mean and are asked to find a missing value. The key to every one of these questions is the same: instead of thinking about the mean itself, think about the total. Since
multiplying both sides by the number of values gives us the most useful fact in this entire topic:
The Golden Rule for Mean Questions
total of all values mean number of values
Whenever a question mentions the mean, immediately work out the total as it unlocks nearly every question of this type.
Example 2:
The mean of the numbers and is Find the value of
Step 1: Write the mean as an equation.
There are numbers, and their mean is so adding the numbers and dividing the total by must give
Step 2: Solve for
Multiplying both sides by
Subtracting from both sides,
Therefore,
Note: the Golden Rule gives the same answer in one line: the total must be and the known numbers account for of it, so
Another exam favourite: a group has a known mean, then someone joins or leaves, and then the mean changes. The Golden Rule handles these perfectly: find the total before, find the total after, and then compare the two.
Example 3:
A rowing squad of athletes has a mean mass of kg. After a new athlete joins, the mean mass of the squad rises to kg. Find the mass of the new athlete.
Step 1: Find the total mass before the new athlete joins.
total mass of athletes kg
Step 2: Find the total mass after the new athlete joins.
There are now athletes, with a mean mass of kg, so
total mass of athletes kg
Step 3: The difference between the two totals is the new athlete's mass.
mass of new athlete kg
Note: sense-check: the mean went up when the athlete joined, so they must weigh more than the old mean of kg. An answer of kg fits; an answer below kg would signal a mistake.
Questions with More Than One Average
Harder questions describe a data set using several of the mode, median, mean and range at once, and ask us to reconstruct the numbers. A reliable strategy is to draw a blank space for each value, then use the clues, one at a time. The mode and median fix particular positions in the list, while the mean fixes the total.
Example 4:
Four numbers have a mode of a median of and a mean of Find the range of the numbers.
Step 1: Draw a blank space for each value, in order of size.
Step 2: Use the mode to fill in what we can.
The mode is so must appear at least twice. The median is smaller than so the middle of the list sits below meaning the two must be the two largest values:
Step 3: Use the median to find the value.
We can see above that the median of sits between the and values. We already know the value of so what must the value be?
It is easy for us to conclude that the value must be
Step 4: Use the mean to find the last value.
By the Golden Rule, the total of the four values is The three values we know account for so
value
Therefore, the numbers are
Step 5: Answer the actual question, which was to find the range.
range
Note: always re-read the question at the end. Here, all the work was reconstructing the list, but the question asked for the range.
Finding the Median from a List
Crossing numbers off from the outside in works fine for a short list but imagine doing it for a list of values. We need something quicker. Fortunately, there is a rule that tells us exactly which position the median sits in, without any crossing off.
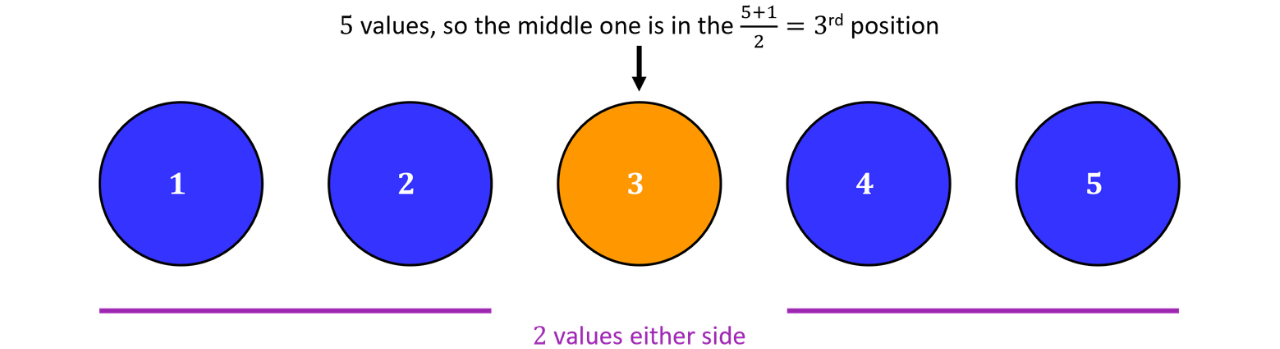
With values, the middle value has values either side of it, sitting in the position, and The same pattern holds for any number of values:
Position of the Median
If a data set has values arranged in order of size:
position of the median
This rule is for listed/discrete data only; grouped/continuous data works differently.
Note: the median position is not For a list of values, the median is in the position which is halfway between the and values. It is not in the position.
Example 5:
The list below shows the number of goals a football team scored in each of its matches this season, arranged in ascending order.
Find the median number of goals scored.
Step 1: Use the rule to find the position of the median.
There are values, so the median is in the
position
which means it lies halfway between the and values.
Step 2: Count along the list to the and values.

Step 3: Work out the number that’s halfway between these two values to get the median.
median
Therefore, the median number of goals is
Note: a median of goals is perfectly fine, even though a team cannot score goals in a match, the median summarises the data and does not have to be one of the data values.
Median and Mean from a Frequency Table
Real data sets are usually far too big to write out as a list, so we summarise them in a frequency table: each value is written once, next to its frequency: the number of times it occurs.
Every skill from this note still works; we just need to read the table carefully. Two ideas matter here:
The number of values, , is the total of the frequency column, not the number of rows.
To locate the median, we add a cumulative frequency (CF) column, which is a running total of the frequencies, telling us how far through the ordered data each row takes us.
Median and Mean from a Frequency Table
Median: find (the total frequency); the median sits in the position; add a cumulative frequency column and find the row in which that position is reached.
Mean: multiply each value by its frequency, add up these products, then divide by the total frequency:
mean
Example 6:
The frequency table shows the shoe sizes of the students in a class.
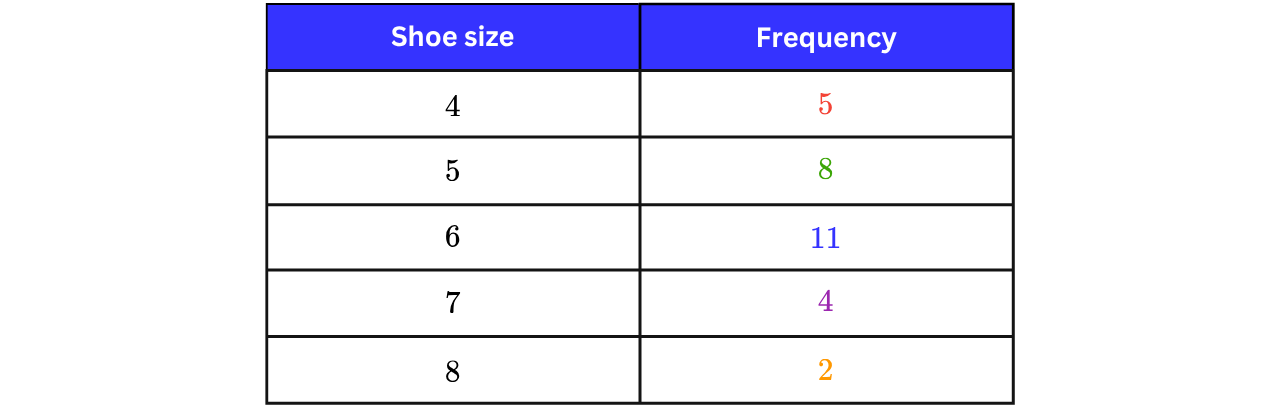
Find the median shoe size and the mean shoe size, giving the mean to decimal places.
Finding the median
Step 1: Find and the position of the median.
The total frequency is So, the median is in the
position
The median is halfway between the and values.
Step 2: Add a cumulative frequency column.
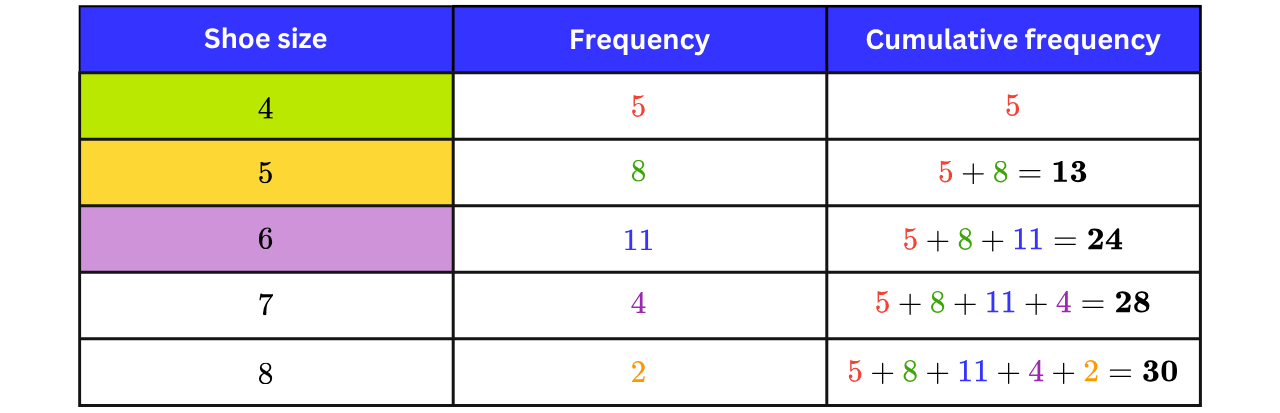
Reading the cumulative frequency column:
the first values are shoe size
the first values take us to the end of the shoe size
the first values take us to the end of the shoe size
Step 3: Locate the and values.
The size finish at the value, and the size run from the value to the value. So, the and values are both shoe size Follow the arrows in the table below, reading first.

Therefore, the median shoe size is
Finding the mean
Step 4: Multiply each value by its frequency, then add up the products.
A frequency table is just shorthand for a long list: there are five eight , eleven , and so on.
Multiplying gives each row's contribution to the total:
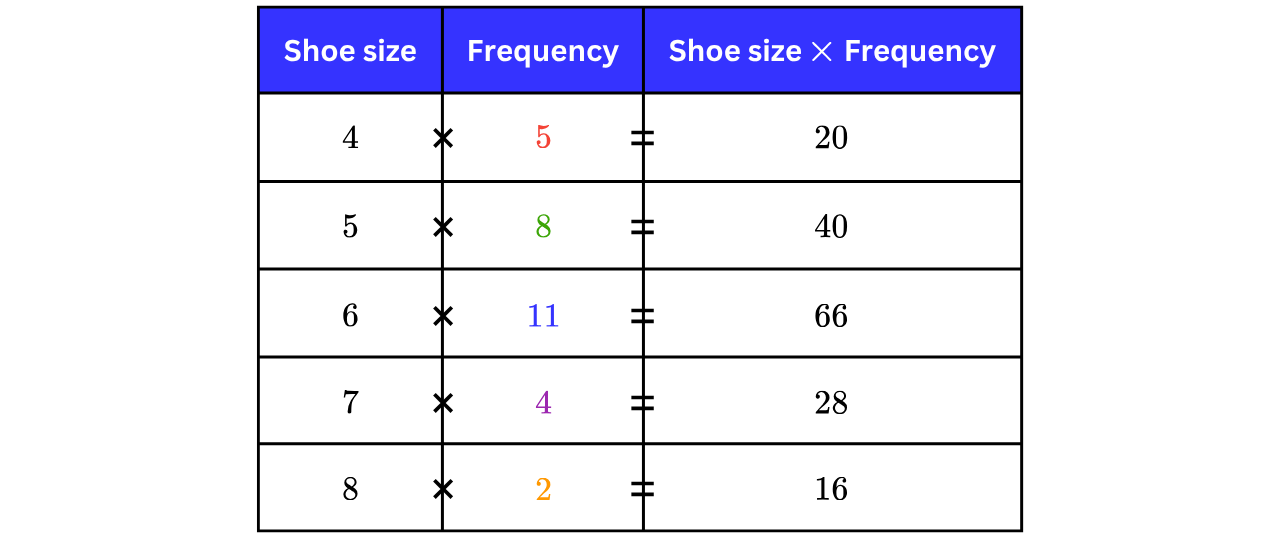
Adding the last column gives us the total of the shoe sizes.
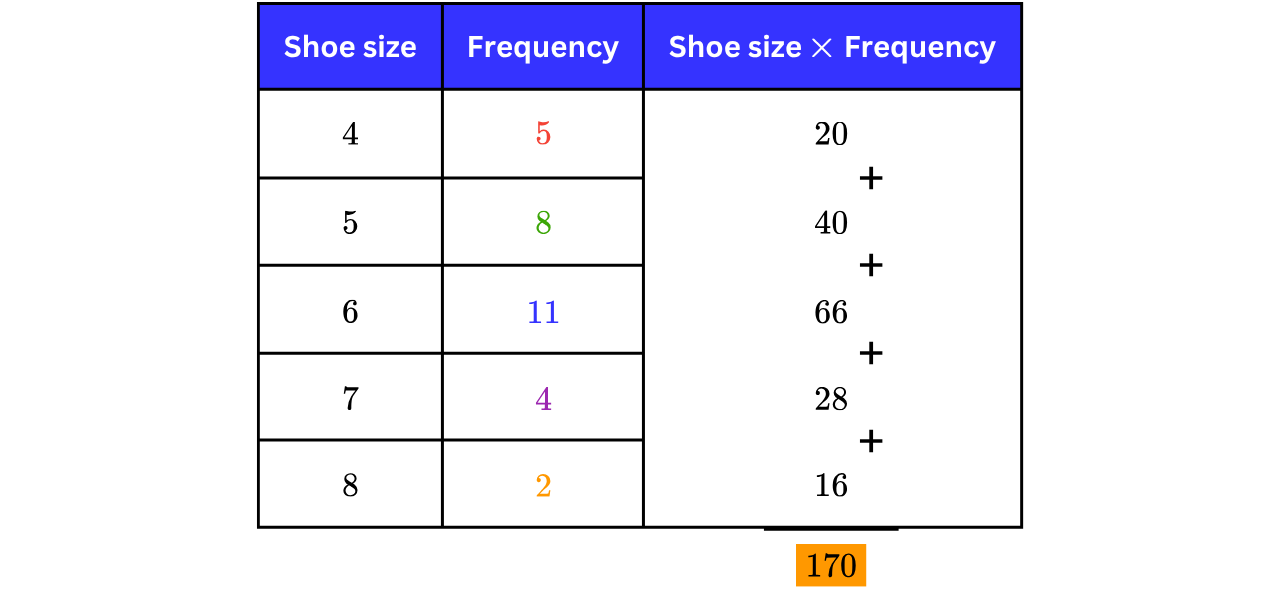
Step 5: Divide the total of the shoe sizes by the total frequency.
We already know the total frequency is as it is given in the question. If it wasn’t, you could just total the frequency column:
mean
Therefore, the mean shoe size is approximately to decimal places.
Note: We divide by (the total frequency), not by (the number of rows). Dividing by the number of rows is the single most common mistake made when dealing with frequency tables.
Practice Question