Quartiles
Neil Trivedi
Teacher

Quartiles from Discrete Data
In our work on averages, we saw that the median is the middle value of a data set, once the values have been written in order, as it splits the data into two equal halves.
Quartiles take this idea one step further. Together, with the median, they split the ordered data into four equal parts, called quarters.
The lower quartile (LQ) is the value one quarter of the way through the ordered data.
The median is the value halfway through the ordered data.
The upper quartile (UQ) is the value three quarters of the way through the ordered data.

To find the position of the median in a discrete data set, we use to count towards the middle, where is the number of values (see our Averages for Discrete Data note). For the quartiles, the counting rule is slightly different.
Finding the Position of the Quartiles (Discrete Data)
For a data set with values written in order:
1) Work out for the LQ, or for the UQ.
2) If this is a decimal, round up: the quartile is the value in that position.
3) If this is a whole number, the quartile is halfway between the value in this position and the value after it.
Note: these rules give the position of each quartile in the list, not the quartile itself. We must always finish by reading off the value sitting in that position. The data must be in order before we count anything.
Example 1:
Here are the marks scored by students in a maths test, written in ascending order:
Find the lower quartile and the upper quartile of the marks.
Step 1: Find the position of each quartile.
There are values. For the lower quartile, we work out
This is a decimal, so we round up. Therefore, the LQ is the value.
For the upper quartile, we work out
is also a decimal, so we round up. Therefore, the UQ is the value.
Step 2: Read off the values in these positions.
Counting along the ordered list, the value is and the value is Therefore,
and
Once we know the two quartiles, we can use them to measure how spread out a data set is.
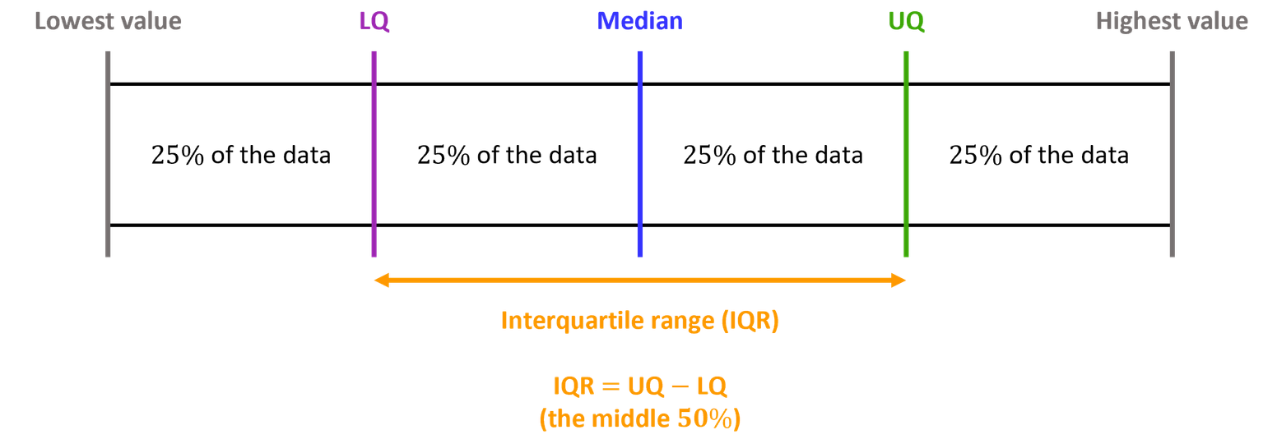
The Interquartile Range (IQR)
IQR UQ LQ
The IQR measures the spread of the middle of the data, which is the gap between the quartiles. Since it ignores the lowest quarter and the highest quarter of the values, it is not affected by extreme values (outliers), unlike the range.
Example 2:
members of a gym record how many press-ups they can do in one minute. The results, in ascending order, are:
Find the LQ, the median, the UQ and the interquartile range (IQR) of the scores.
Step 1: Find the position of the median and each quartile.
There are values. For the lower quartile,
This is a whole number, so the LQ is halfway between the and values, which is the position.
For the median,
(halfway between the and values)
For the upper quartile,
This is also whole, so the UQ is halfway between the and values, which is the position.
Step 2: Read off the values in these positions.
The value is (halfway between the value of and the value of ), so
The value is (halfway between the value of and the value of ), so
median
3) The value is (halfway between the value of and the value of ), so
Step 3: Subtract the lower quartile from the upper quartile to find the
Therefore, the LQ, the median, the UQ and the interquartile range (IQR) of the scores are and respectively.
Quartiles from Grouped Data
When data is presented in a grouped frequency table, we no longer know the individual values, only how many values fall in each class. This means we cannot count along a list to reach an exact position. Instead, we estimate the quartiles using the cumulative frequency (the running total of the frequencies) and a method called linear interpolation, which assumes the values inside each class are evenly spread out.
We were introduced to linear interpolation in our Averages for Continuous Data note.
Finding the Quartiles of Grouped Data (Linear Interpolation)
1) Work out for the or for the DO NOT round this value!
2) Add a cumulative frequency column to the table and find the class that contains this position.
3) Assuming the values in that class are evenly spread, use linear interpolation as the quartile sits the same fraction of the way through the class as its position sits through the frequencies:
4) Solve for the quartile: the right-hand fraction the class width, added on to
where:
and are the lower and upper ends (boundaries) of the class containing the quartile,
CF before and CF after are the cumulative frequencies at the start and end of that class.
Note 1: as mentioned in our Averages for Continuous Data note, this looks crazy when written in formula form, but when drawn on a number-line, it is relatively simple after practising a few examples as you are doing the same thing each time.
Note 2: from this point, the colours track the parts of the interpolation rather than identifying each quartile as before: red for the class boundaries, blue for the quartile's position, green for the cumulative frequencies, and purple for the quartile we are finding, matching the formula above and the number lines that follow.
Example 3:
In a javelin competition, the distances of throws were recorded in the table below.
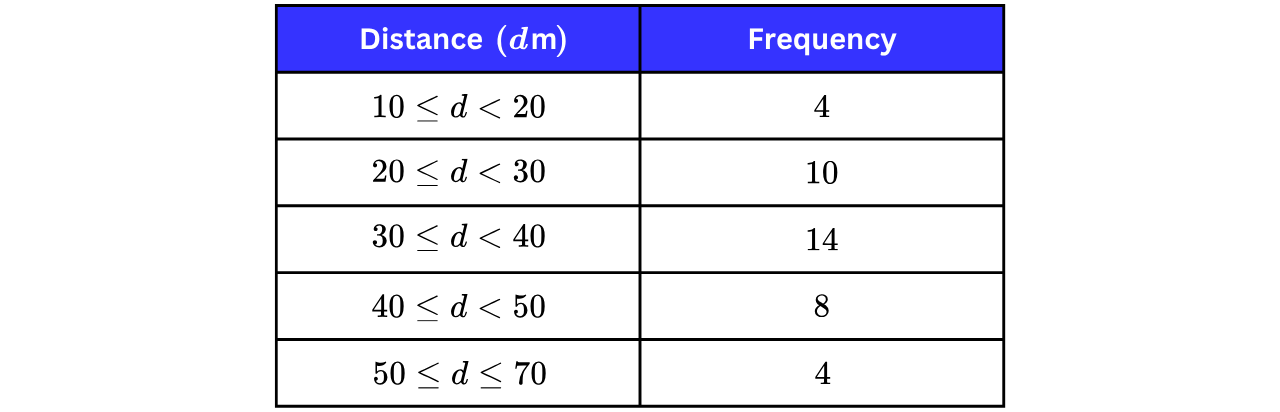
Use linear interpolation to find an estimate for the interquartile range of the distances.
Step 1: Find the position of both quartiles and remember not to round them as this is continuous data.
The question states that there were throws, so the total frequency is
LQ position
UQ position
Step 2: Add a cumulative frequency column and locate each class.
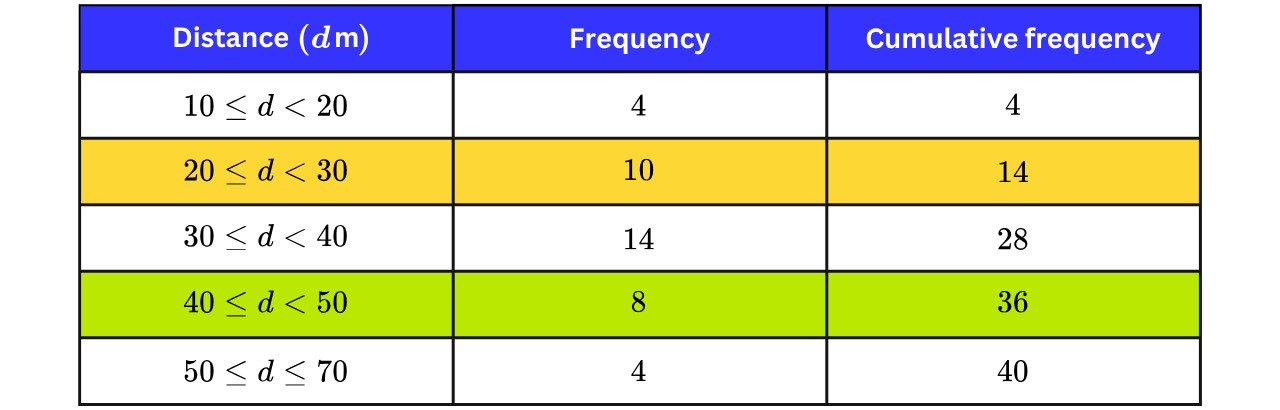
The LQ, being the value, lies in the class (CF goes from to across it), and the UQ, being the value, lies in the class (CF goes from to ).
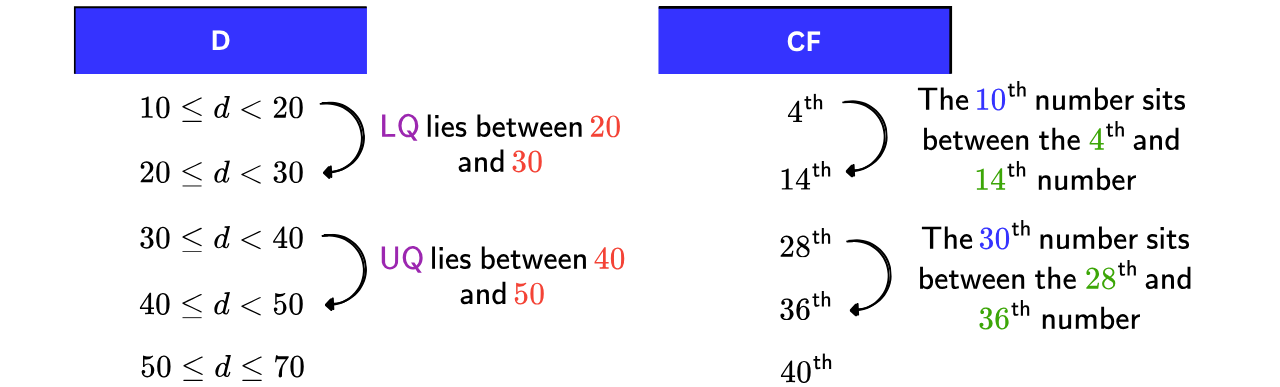
Step 3: Interpolate within each class.
First for the lower quartile. The LQ is the value. Its class runs from m to m, and across this class, the cumulative frequency increases from to
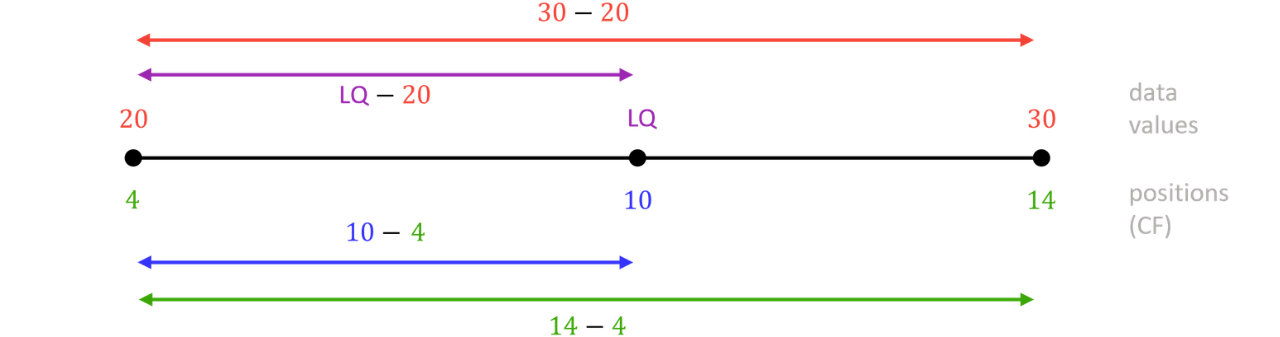
Assuming the distances in this class are evenly spread across it, the LQ sits the same fraction of the way along both scales:
Multiply the fraction by the class width and then add the lower end of the class.

m
2) For the upper quartile. The UQ is the value. Its class runs from m to m, and across this class, the cumulative frequency increases from to
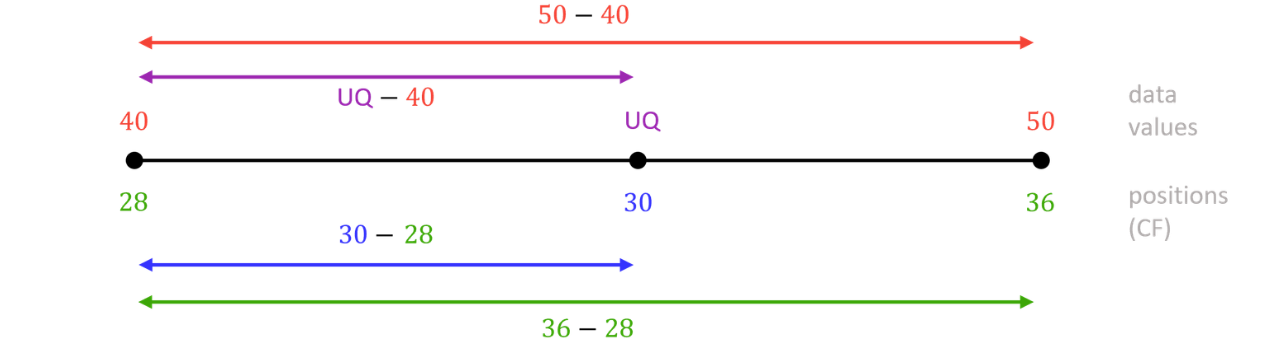
Assuming the distances in this class are evenly spread across it, the UQ sits the same fraction of the way along both scales:
Multiply the fraction by the class width and then add the lower end of the class.

m
Step 4: Subtract the lower quartile from the upper quartile to find the IQR.
IQR UQ LQ
IQR m
Note: even though the quartiles of grouped data are found differently, the interquartile range is calculated in exactly the same way as before: IQR UQ LQ.
Practice Question