Averages for Continuous Data
Neil Trivedi
Teacher

Contents
Averages for Continuous Data
Data that comes from measuring, such as times, heights and masses, is called continuous data, since it can take any value in a range, including in-between values like seconds. When we collect a large amount of continuous data, we usually organise it into a grouped frequency table, where the data is sorted into class intervals.
For example, the table below shows the times, hours, that students spent on their phones one Saturday.
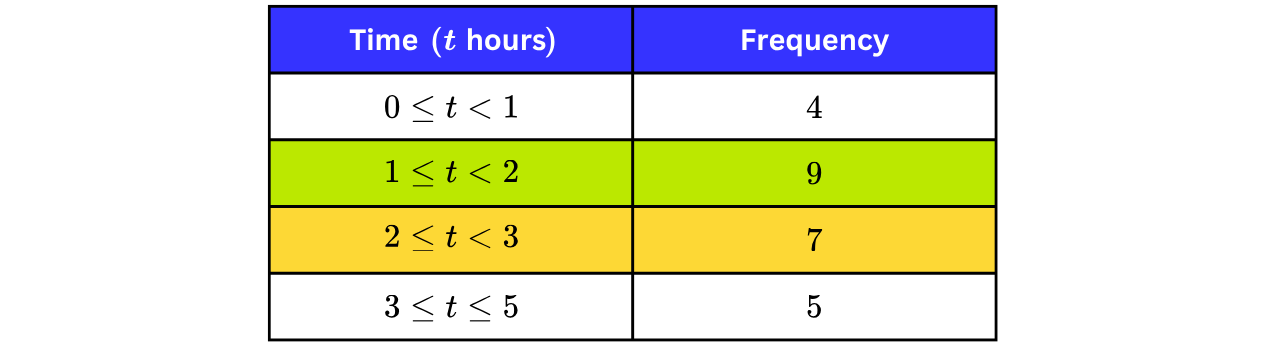
Each class interval is written using inequalities. The interval contains every time from hour up to, but not including, hours. A student who spent exactly hours is counted in the class Writing the classes in this way means there are no gaps and no overlaps: every possible value belongs to exactly one class.
Grouping data makes it much easier to read, but it comes at a cost: we lose the exact data values. We know that students spent between and hours on their phones, but we have no way of knowing the exact time for any one of them. As a result, we can no longer calculate averages exactly, we can only estimate them. In this note, we cover the three averages for grouped data: the modal class, the estimated mean and the estimated median.
The Modal Class
The mode of a data set is the value that appears most often. When data is grouped, we cannot identify a single most common value, so we give the modal class instead, which is the class interval with the highest frequency. No calculation is needed; we simply read it from the table.
In the screen-time table above, the highest frequency is so the modal class is
Estimating the Mean
For a list of values, the mean is the sum of the values divided by how many values there are. For grouped data, the frequency column still tells us how many values there are, but we no longer know the values themselves. We therefore choose one value to represent every data point in a class: the midpoint of the class.
If we assume the values in a class are evenly spread, the midpoint is the fairest single representative as some of the real values sit a little above it and some a little below, and these differences should theoretically cancel out.
Estimating the Mean from a Grouped Frequency Table
Find the midpoint, , of each class: add the two ends of the class and divide by
Multiply each midpoint by its frequency, , to obtain , then total the column,
Divide by the total frequency,
Estimated mean
where (the Greek letter sigma) means “the sum of”.
Note: this is nothing new compared to what we did when finding the mean from discrete frequency tables. We multiplied, added and divided. See our Averages for Discrete Data note for more detail.
Let’s estimate the mean screen time from the table above. We add two working columns to the table: one for the midpoint of each class, , and one for
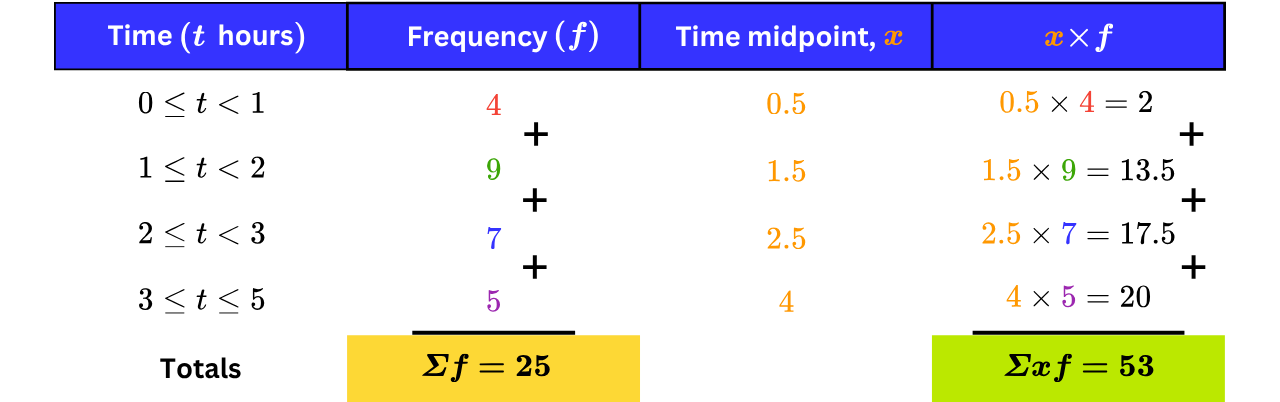
Notice that the midpoint of the final class is as classes do not need to be the same width, so always work each midpoint out from the ends of its own class.
The times have an estimated total of hours, so
Estimated mean hours
Is this answer exact? No. We do not know how the times inside each class are spread out, so we represented every class by its midpoint. Even though happens to give a tidy decimal, the answer is still an estimate of the true mean.
Example 1:
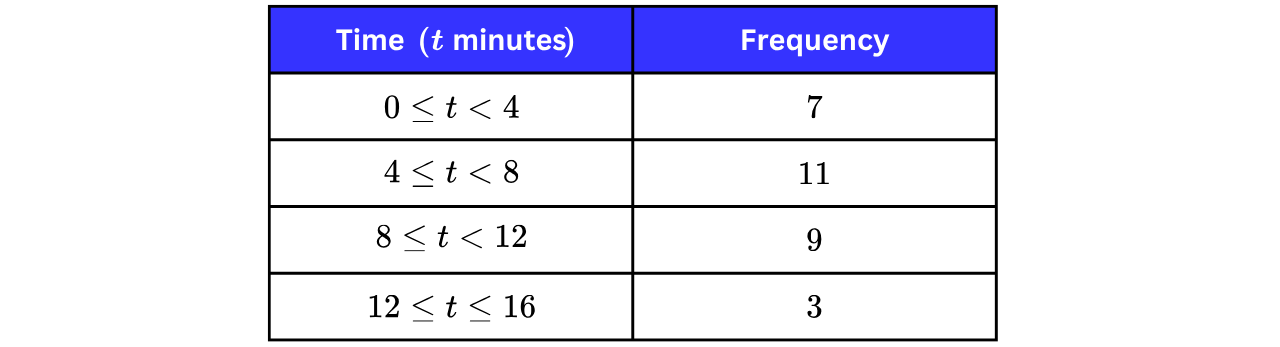
The table shows the times, minutes, that patients waited to collect a prescription at a pharmacy.
a) Write down the modal class.
Single Step: Find the class that has the highest frequency.
The highest frequency in the table is so
Modal class
b) Work out an estimate for the mean waiting time.
Step 1: Find the midpoint of each class and multiply it by the frequency.
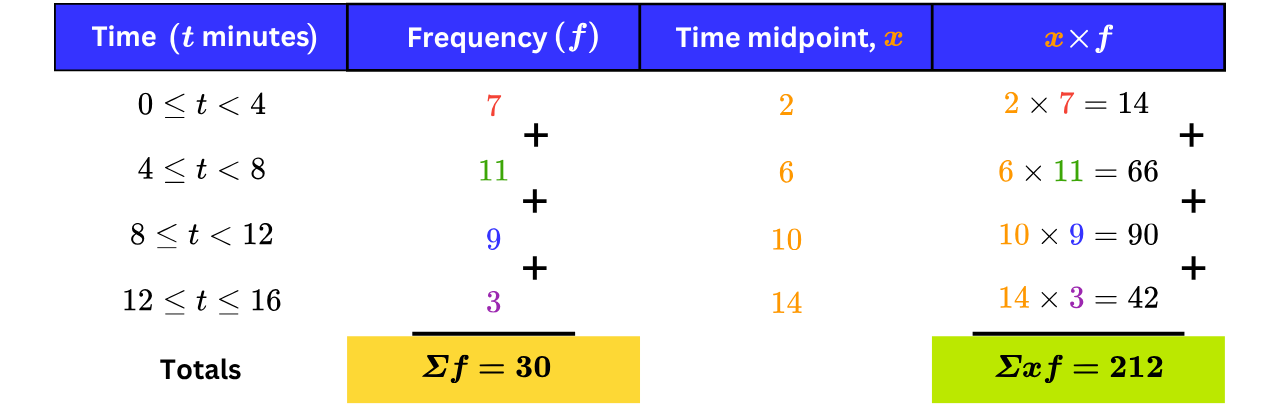
Step 2: Divide the total of the column by the total of the frequency column.
Estimated mean
Rounding to a sensible degree of accuracy,
Estimated mean minutes (sf)
Note: we divide by the total frequency, A very common error is to divide by the number of classes (number of rows), , instead.
c) Explain why your answer to part b) is an estimate.
Once the data is grouped, the exact waiting times are lost. We assumed the times in each class were evenly spread and hence represented each class by its midpoint, so the total of minutes is only an estimate of the true total, which makes the mean an estimate too.
Estimating the Median by Linear Interpolation
The median is the middle value of an ordered data set. For grouped continuous data with total frequency the median sits at the position of the way through the distribution.
Note: for a discrete list of values, the median is at the position, because we are picking out an actual middle data value. For grouped continuous data we use instead as we are locating the halfway point of a smooth distribution, not choosing one of the data values.
To find where the median lies, add a cumulative frequency (CF) column to the table, a running total of the frequencies. The median class is the first class whose cumulative frequency reaches or passes
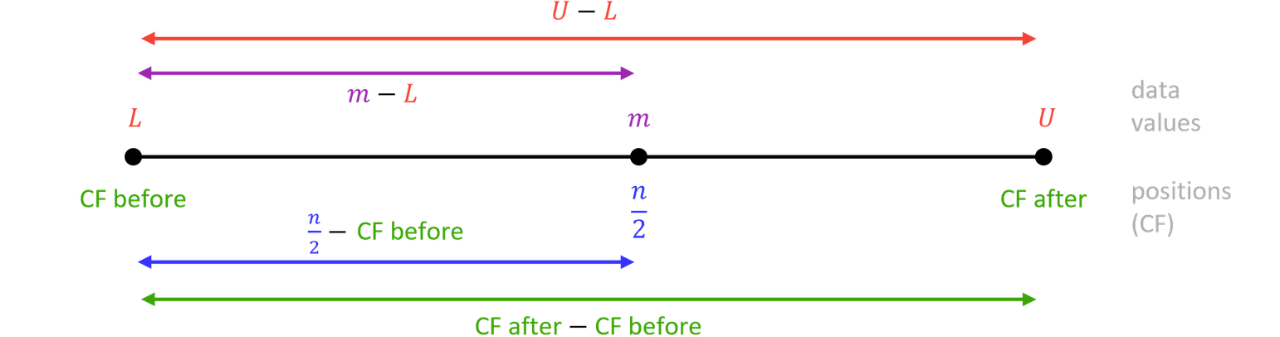
We then assume the values in the median class are evenly spread across it. Placing the class on a number line, the median sits the same proportion of the way along the class interval (top scale) as its position sits through the cumulative frequencies (bottom scale):
Estimating the Median by Linear Interpolation
Add a cumulative frequency (CF) column and find the position of the median:
Identify the median class: the first class whose CF reaches or passes
Assume the values are evenly spread through the class and equate the two proportions:
4) Solve for the right-hand fraction the class width, added on to
where:
is the median and is the total frequency,
and are the lower and upper bounds of the median class,
CF before and CF after are the cumulative frequencies at the start and end of the median class.
Note: this looks insane when written in formula form, but the worked examples below, especially in video form (watch the videos at the end), will show you that this is not difficult at all.
Note: linear interpolation isn’t officially tested in GCSE, however, it is worth knowing for questions such as finding medians in histograms. For more on this, please read our Histogram study note.
Example 2:
A gardener measures the heights, cm, of sunflower seedlings. The results are summarised in the table below.
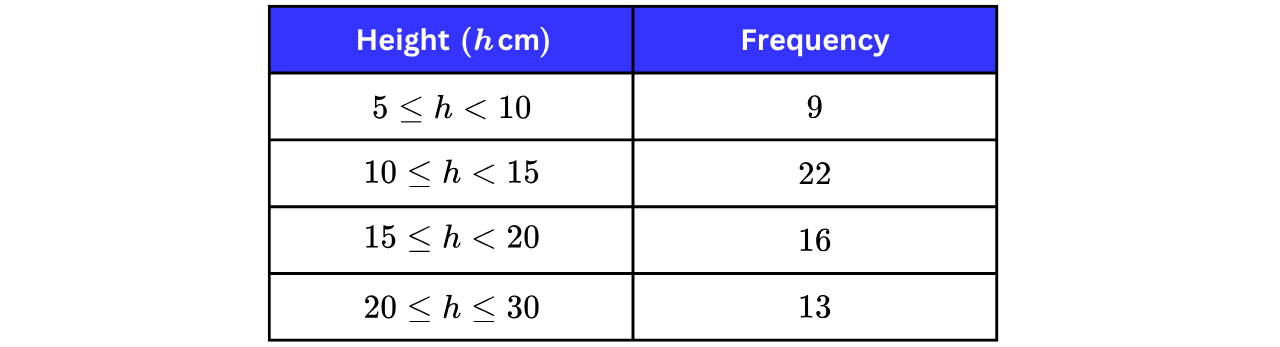
a) Find the class interval that contains the median.
Step 1: Add a cumulative frequency column and find the position of the median.
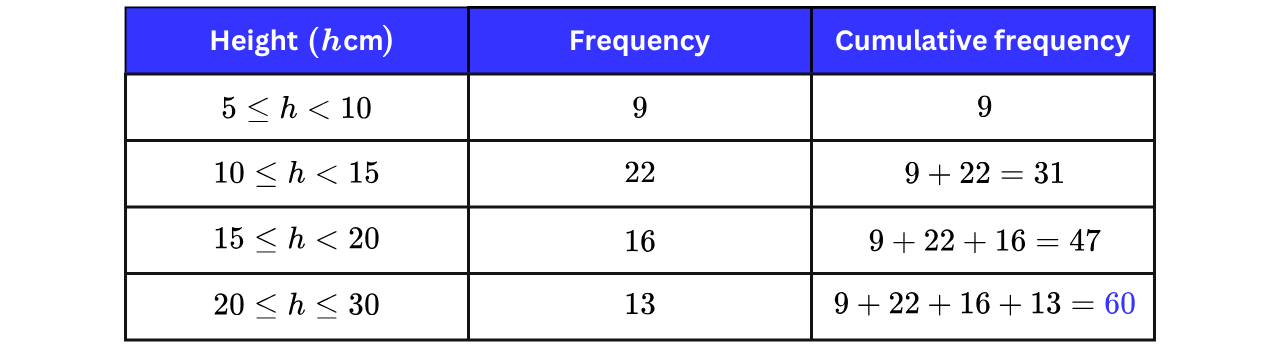
Median position value
Step 2: Find the first class whose cumulative frequency reaches or passes this position.
The cumulative frequency of the first class is only but by the end of the second class it has climbed to passing
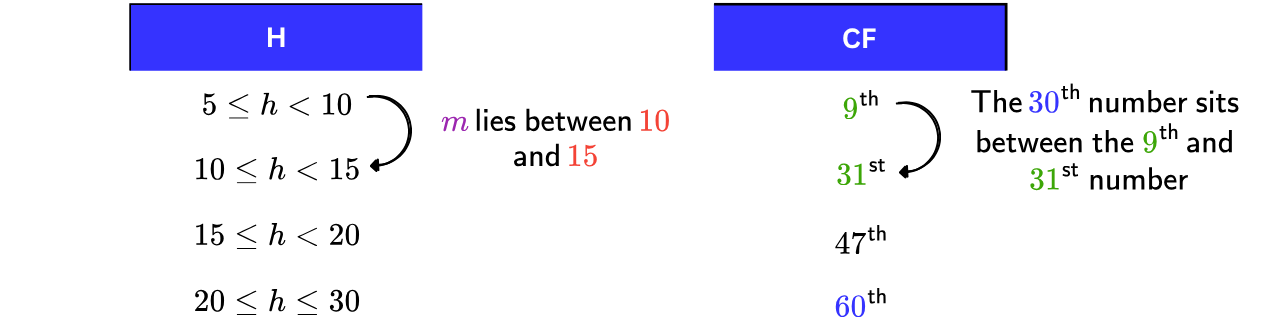
Median class
b) Use linear interpolation to work out an estimate for the median height.
Step 1: Place the median class on a number line and equate the proportions.
The median is the value. Its class runs from cm to cm, and across this class, the cumulative frequency increases from to
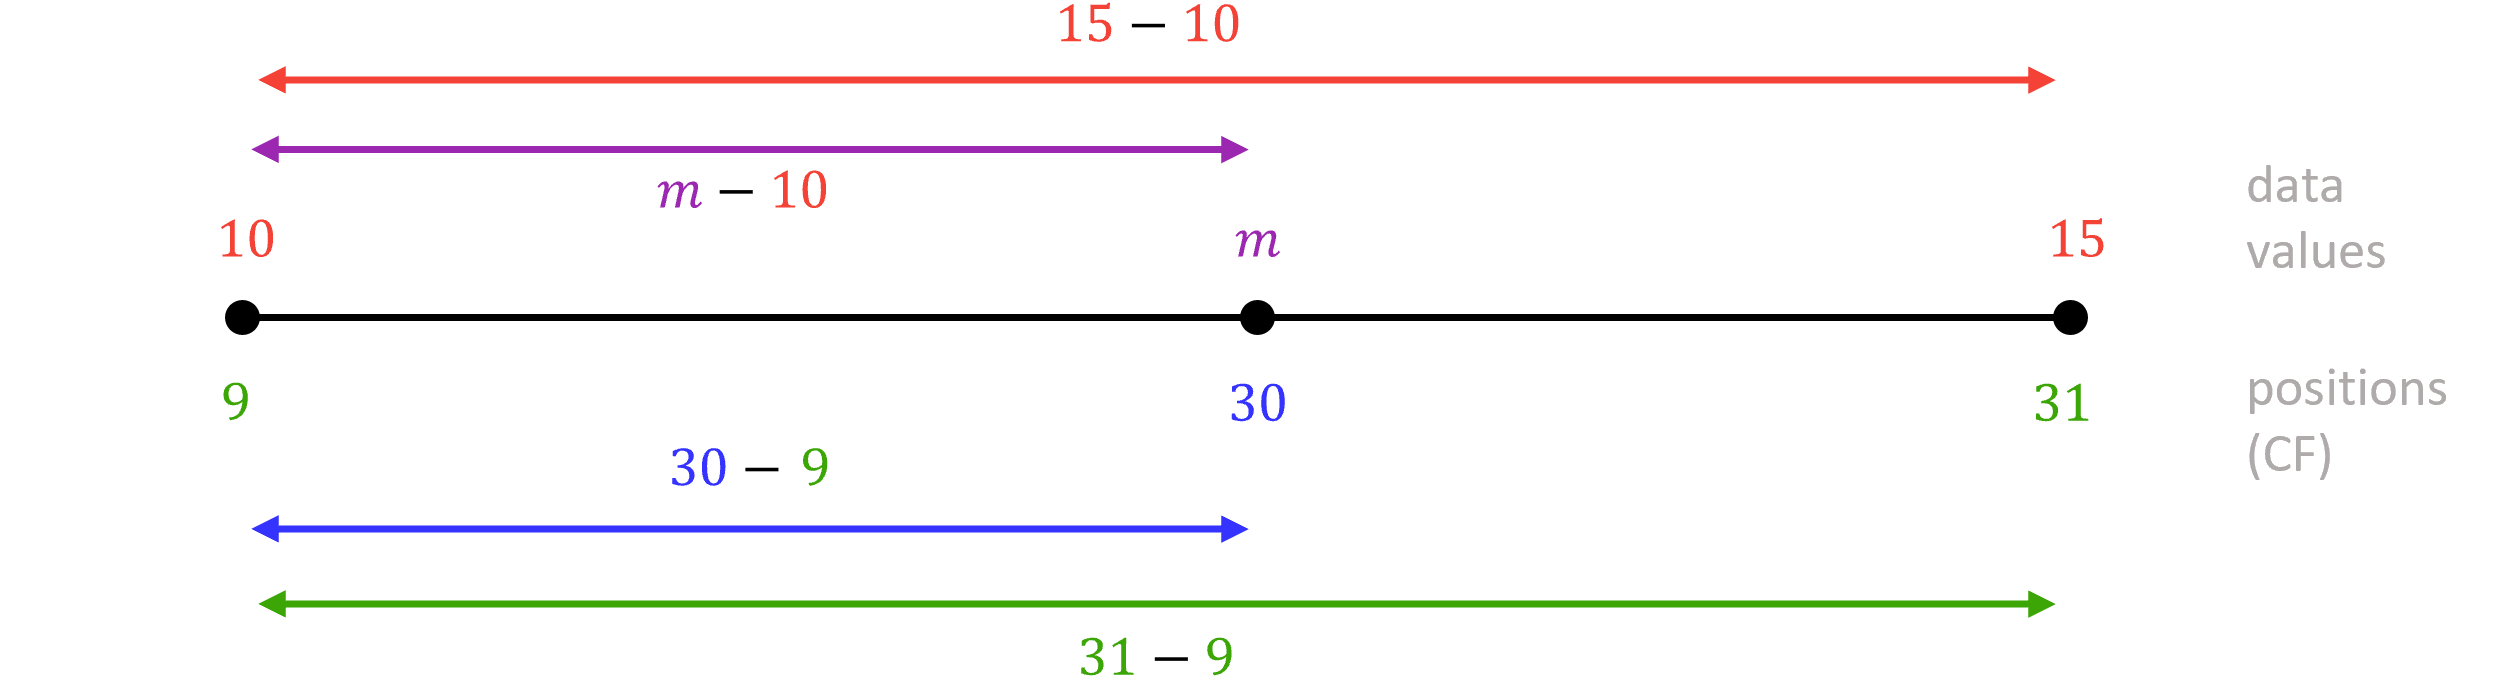
Assuming the heights in this class are evenly spread across it, sits the same fraction of the way along both scales:
Step 2: Multiply the fraction by the class width and add it to the lower end of the class.

Estimated median cm (sf)
Note: this answer is an estimate because we assumed the heights inside the median class are evenly spread across it. This is a linear spread, hence why the method is called linear interpolation.
Classes with Gaps: Class Boundaries
Sometimes, a table's classes appear to have gaps between them. Ex.3 below shows the masses of dogs, recorded to the nearest kilogram, in classes written and so on.
At first glance, a mass of kg has nowhere to go as it seems to fall in the gap between and However, the masses were rounded, so kg was recorded as kg and counted in the class In reality, the class contains every true mass from kg up to (but not including) kg.
The values and are called the class boundaries (like error intervals). To find them, extend each stated class by half a unit of rounding, which is kg in this case, at both ends. The boundaries of neighbouring classes then meet with no gaps, and class widths must come from the boundaries.
The width of the class is not but

Once the true boundaries are written down, the mean and the median are estimated exactly as before, using the boundaries wherever the ends or the width of a class are needed.
Example 3:
The masses of dogs at a rescue centre, measured to the nearest kilogram, are shown in the table below.
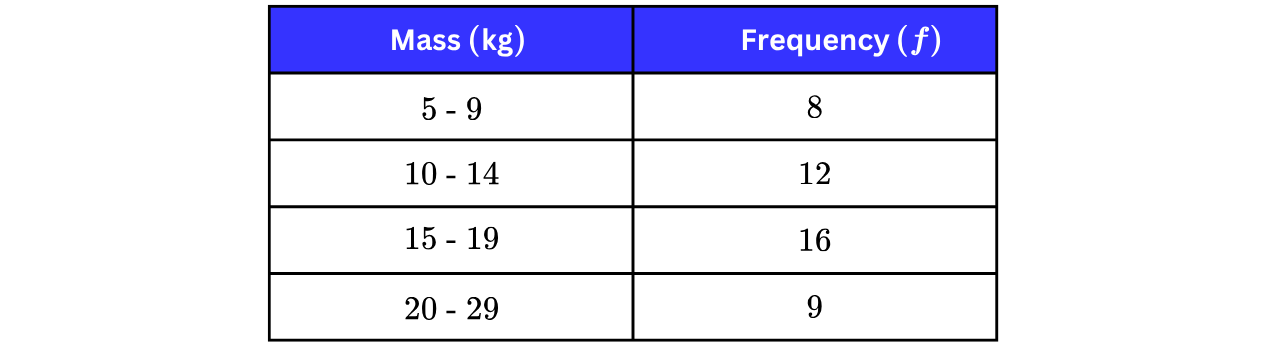
a) Work out an estimate for the mean mass.
Step 1: Find the true class boundaries.
The masses are rounded to the nearest kilogram, so each stated class extends kg beyond its ends: the class really runs from to the class from to and so on.
Step 2: Find the midpoint of each class and multiply it by the frequency.
The midpoint of the stated class is and the midpoint of is
This is because extending by at both ends cancels out. The boundaries matter for the median in part b), where the ends and the width of the median class are used. This handy fact saves us about seconds of calculator work in the exam.
Note: as the midpoints are not affected by the boundary shift, we can use either set of class boundaries when estimating the mean.
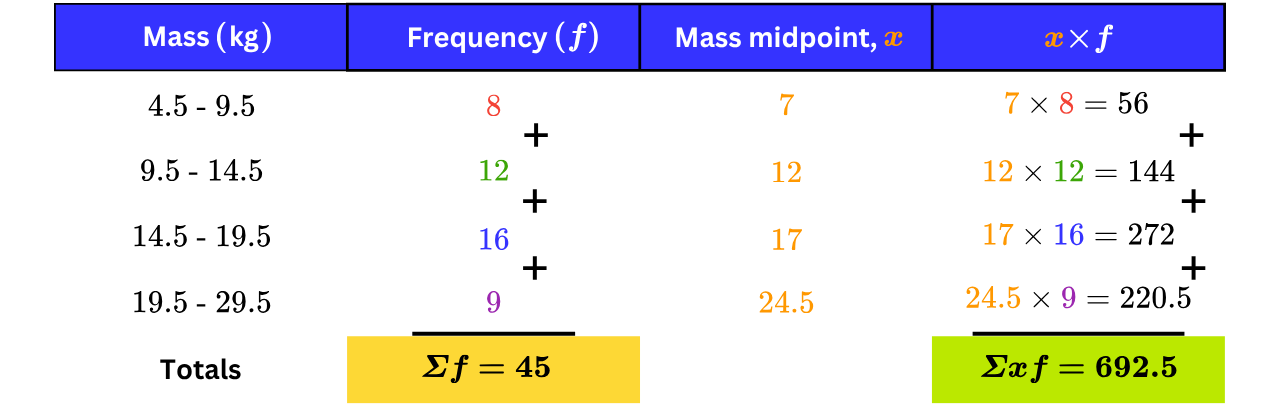
Step 3: Divide by
Estimated mean
Estimated mean kg (sf)
b) Use linear interpolation to work out an estimate for the median mass.
Note: the colour code resets for part b). The colours below follow the interpolation colouring used in Ex.2: the median class boundaries in red, the numbers used to find the position of the median in blue, the cumulative frequencies used in interpolation in green, and the median in purple.
Step 1: Add a cumulative frequency column and find the position of the median.
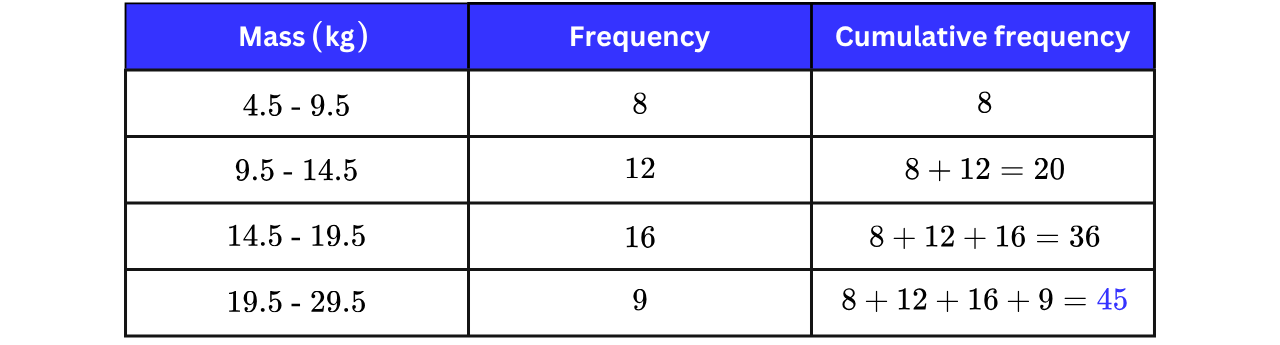
Median position value
Step 2: Find the first class whose cumulative frequency reaches or passes this position.
The first cumulative frequency to pass is so the median lies in the stated class which has true boundaries Across this class, the cumulative frequency increases from to
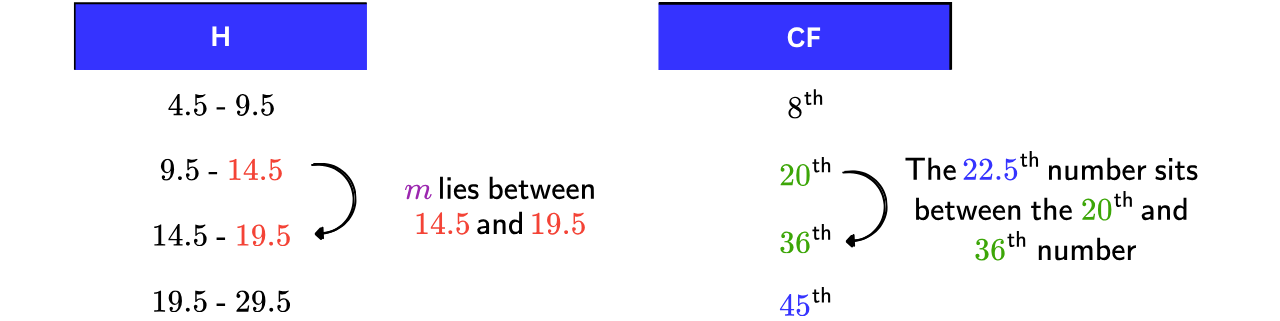
Step 3: Place the median class on a number line and equate the proportions.
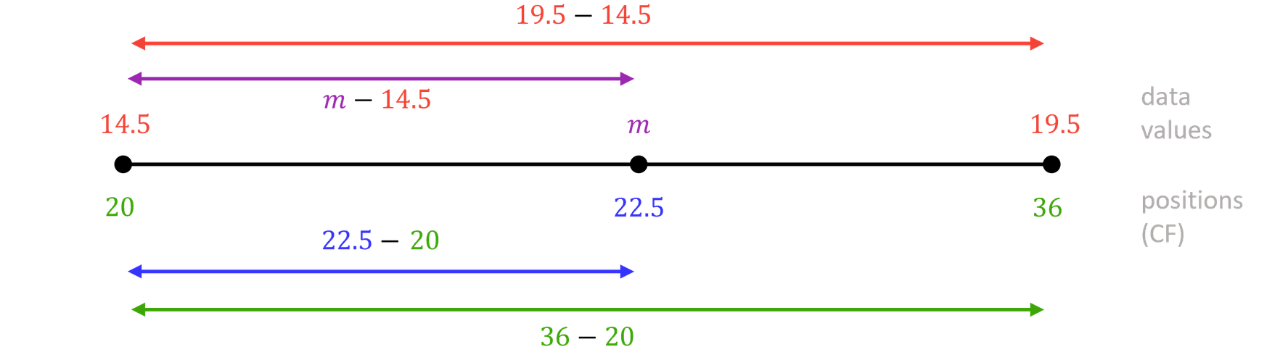
Step 4: Multiply the fraction by the class width and add it to the lower end of the class.

Estimated median kg (sf)
Note: a very common error is to interpolate across (width ) or across as written in the original table. The interpolation must use the true boundaries, and giving a class width of
Practice Question