Quadratic Inequalities
Neil Trivedi
Teacher

Recap on Inequalities
An inequality compares two expressions that are not necessarily equal. Instead of using an equals sign inequalities use one of the following symbols:
which represents is greater than.
which represents is less than.
which represents is greater than or equal to.
which represents is less than or equal to.
In previous years, you have covered linear inequalities such as
Unlike equations, the solution is usually a range of values rather than a single number. For example,
Subtracting from both sides, we get
This tells us that any value of greater than satisfies the inequality.
Quadratic Inequalities
A quadratic inequality is an inequality that contains a quadratic expression. Quadratic inequalities are solved in a similar way to quadratic equations, but instead of finding specific solutions, we find a range of values that satisfy the inequality.
General Steps for Solving Quadratic Inequalities
1) If needed, rearrange so that one of the sides of the inequality is
2) Set the quadratic expression equal to and solve it by factorising (if possible) to find its roots.
3) Sketch the graph of the quadratic, indicating the roots (where the curve crosses the axis).
4) Use the graph to determine the range of values of that satisfy the inequality. If the quadratic is we look at the parts of the graph that lie below the axis. If the quadratic is we look at the parts of the graph that lie above the axis.
Example 1:
Solve:
a)
The quadratic has already been rearranged so that is on the right-hand side, so we can solve the quadratic equation first.
Step 1: Set the quadratic expression equal to and solve it.
Factorising the quadratic, we get
Setting each bracket equal to we have
or
Solving each linear equation for
or
Step 2: Sketch the graph of the quadratic, indicating the roots.
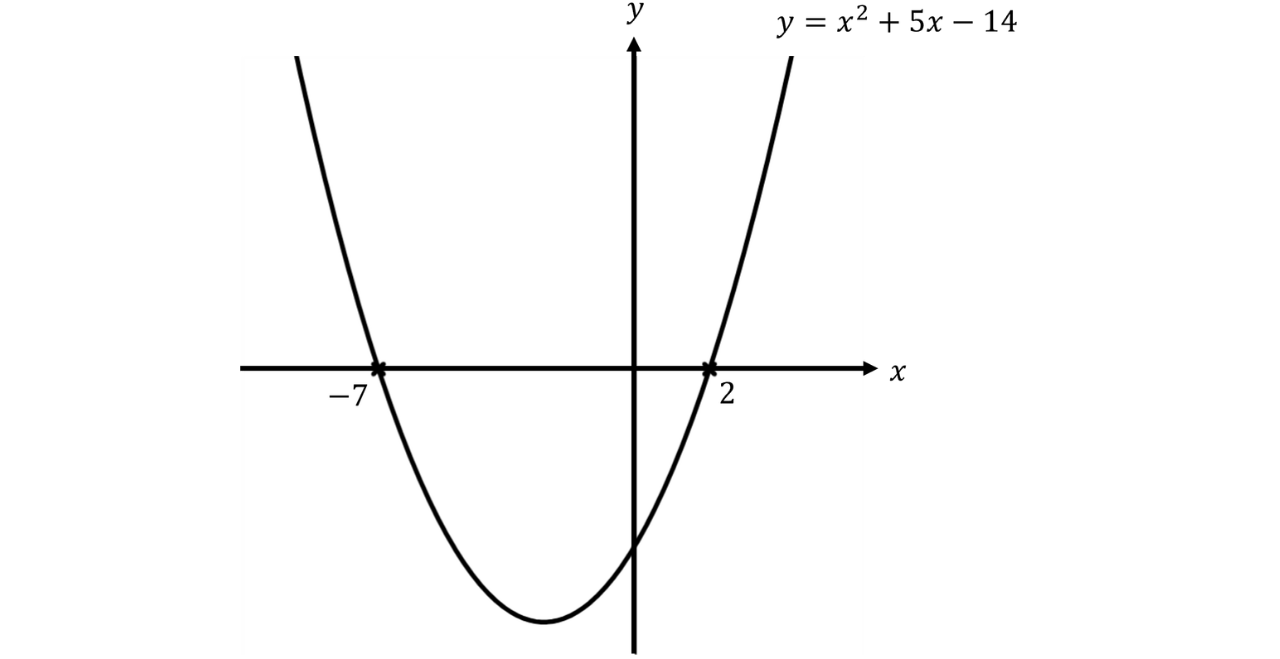
Step 3: Use the graph to determine the range of values that satisfies the inequality.
The inequality means we are looking for where the quadratic is less than On the graph, this corresponds to the parts of the curve that lie below the axis. This is highlighted in the graph below.
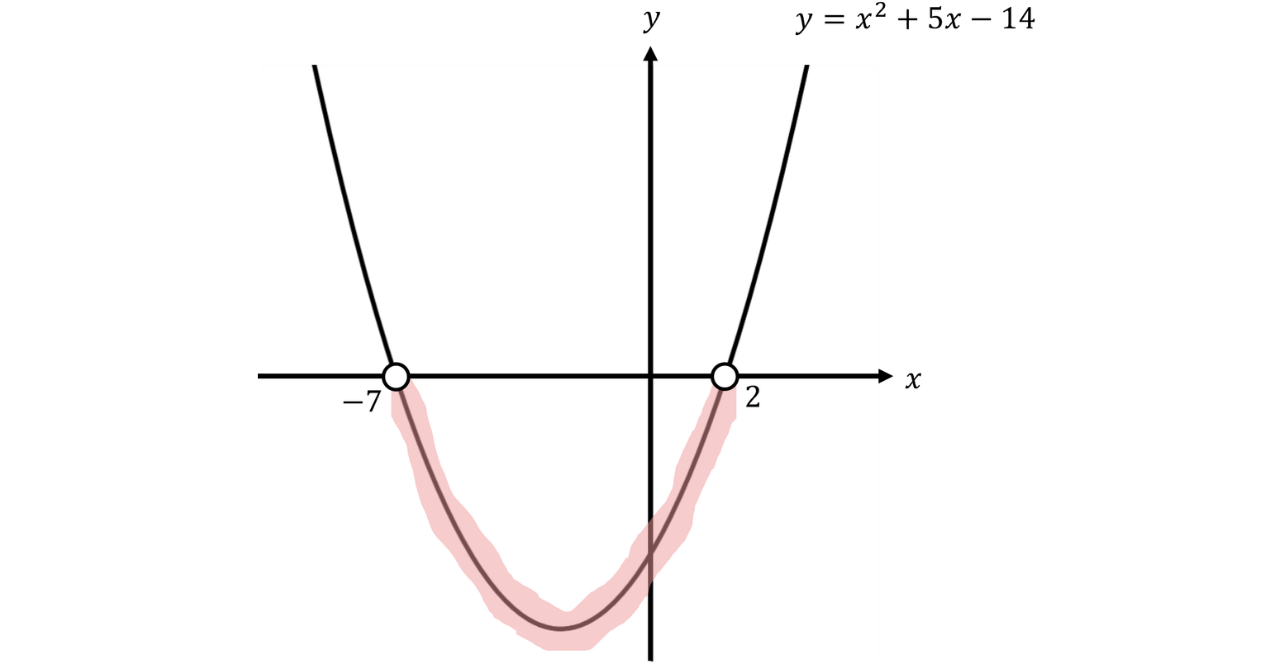
From the graph, the quadratic lies below the axis for values of between and (excluding both and
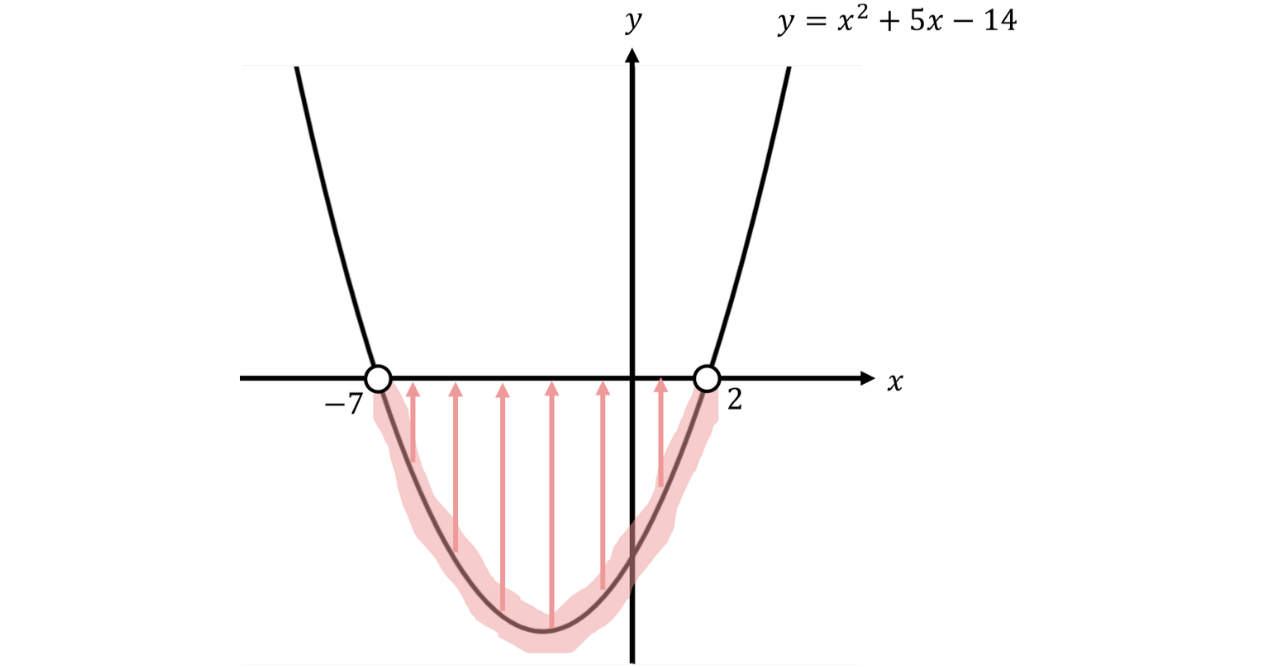
Therefore, the solution to the inequality is
b)
Step 1: Rearrange the inequality to make one of the sides equal to
Here, we add to both sides to move the over to the left, leaving on the right.
Step 2: Set the quadratic expression equal to and solve it.
Factorising the quadratic, we get
For more practice on factorising quadratics where the coefficient of is not one, please read our Factorising Quadratics note.
Setting each bracket equal to we have
or
Solving each linear equation for
or
Step 3: Sketch the graph of the quadratic, indicating the roots.
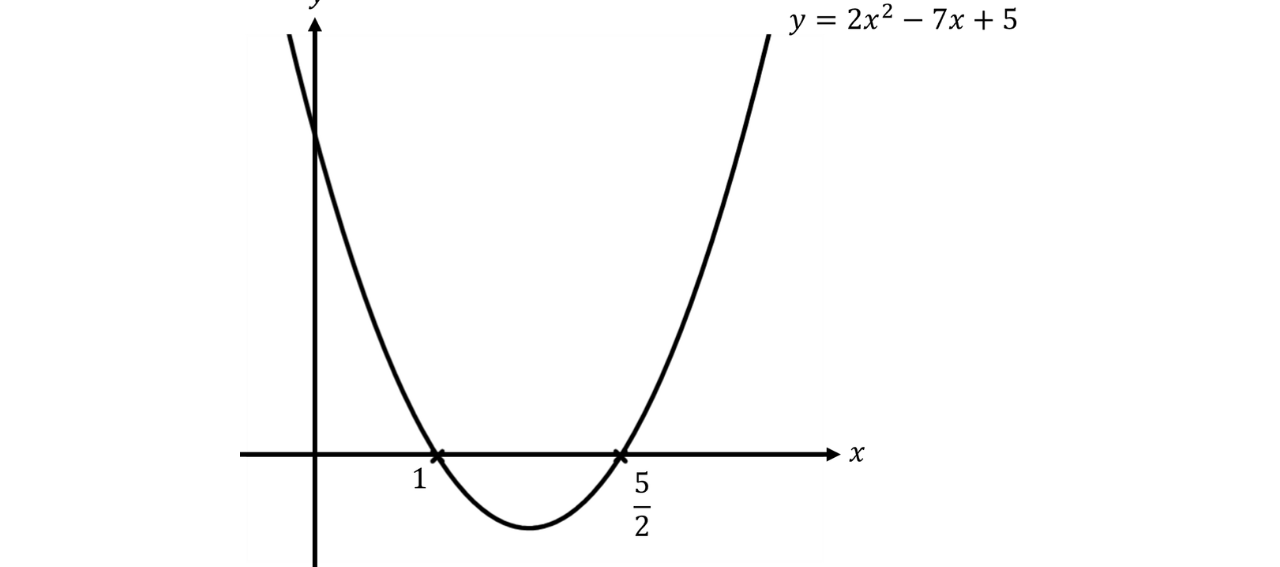
Step 4: Use the graph to determine the range of values that satisfies the inequality.
The inequality means we are looking for where the quadratic is greater than or equal to On the graph, this corresponds to the parts of the curve that lie on or above the axis. This is highlighted in the graph below.
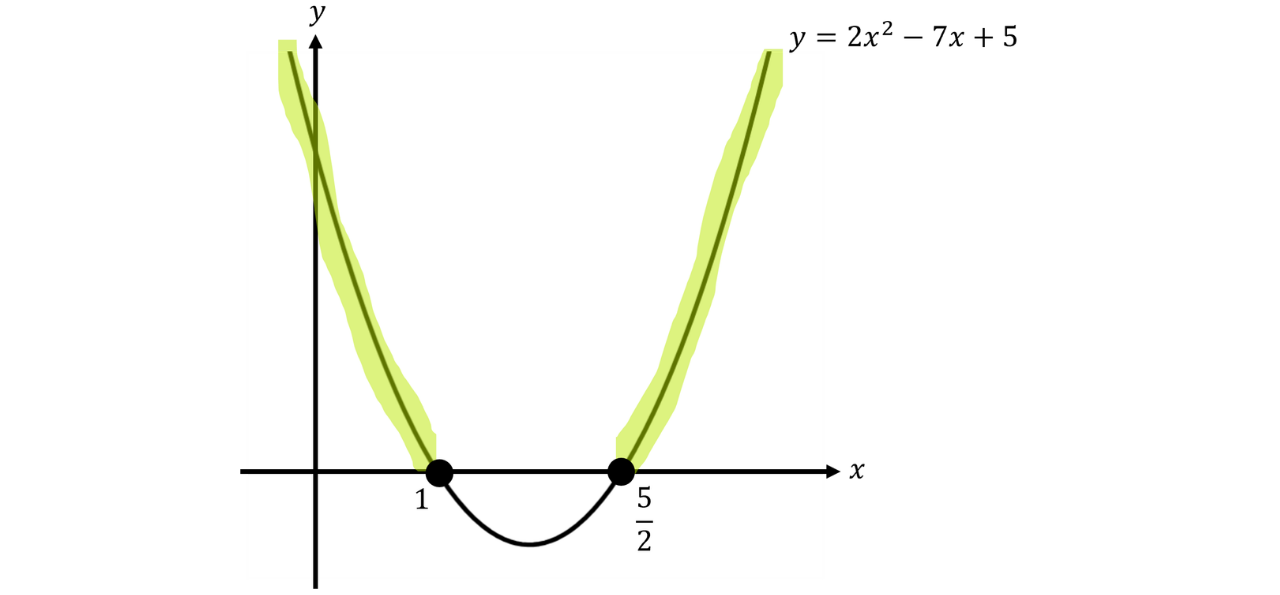
From the graph, the quadratic lies on or above the axis for values of that are less than or equal to or greater than or equal to
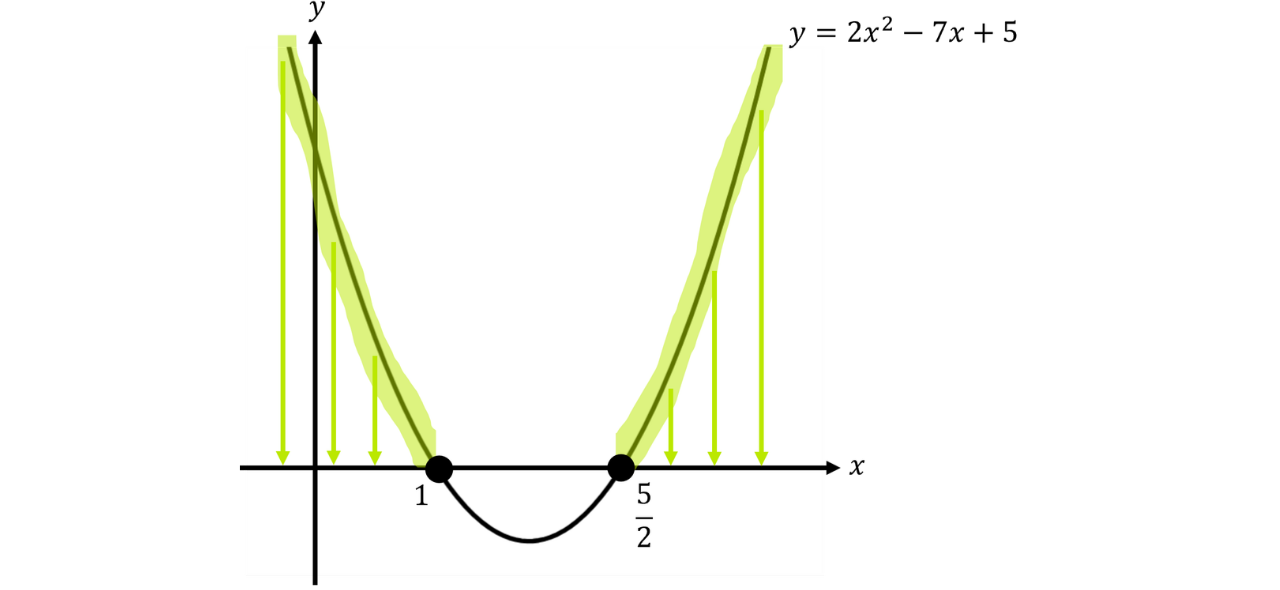
Therefore, the solution to the inequality is
or
Example 2:
Determine the range of values of that satisfy both the inequalities given below.
Sometimes, questions like this appear in exams. To solve them, we first find the range of values of that satisfies each inequality separately.
Once both inequalities have been solved, we represent the solutions on a number line and identify where the two ranges overlap.
The overlapping region gives the range of values of that satisfies both inequalities simultaneously.
Step 1: Solve the first inequality.
This is a linear inequality.
Expanding the right-hand side,
Subtracting from both sides and adding to both sides,
Dividing both sides by
Step 2: Solve the second inequality.
This is a quadratic inequality.
First, we subtract from both sides to make the right-hand side of the inequality
Setting the quadratic equal to we have
Then, we solve the quadratic equation. To note, this is an example of the difference of two squares principles. So, the quadratic factorises to
Setting each bracket equal to we have
or
Solving each linear equation for
or
Now, we sketch the graph of the quadratic indicating its roots.
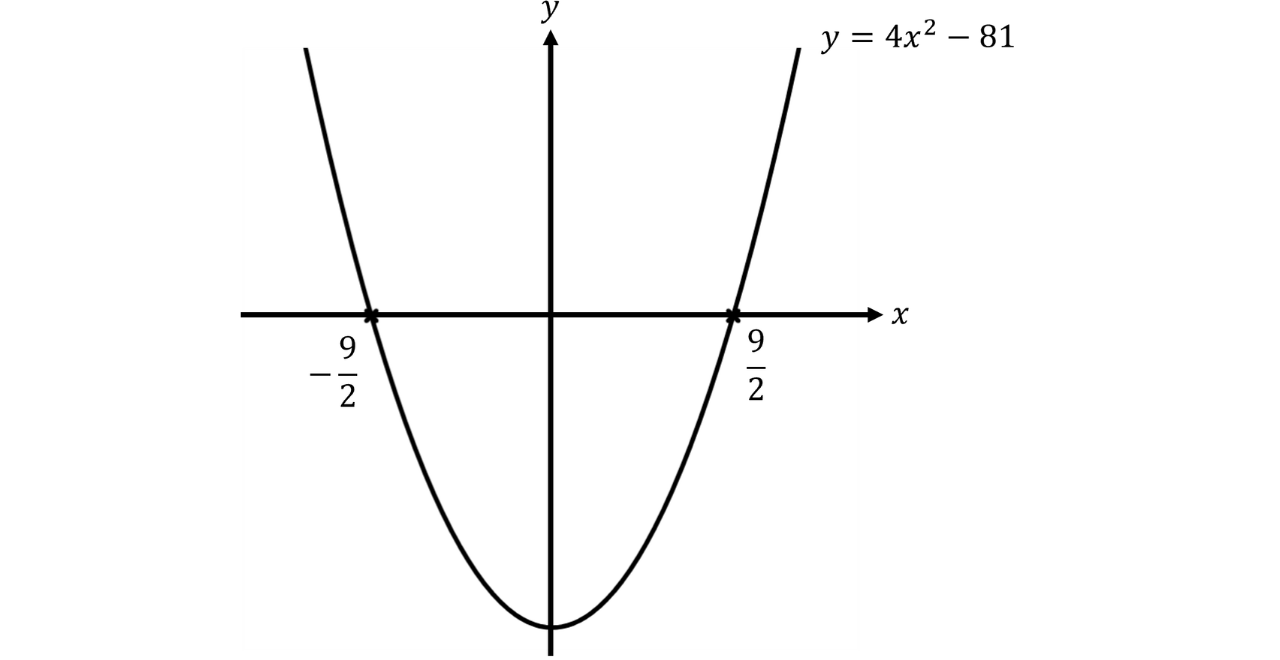
The inequality means we are looking for where the quadratic is greater than On the graph, this corresponds to the parts of the curve that lie above the axis. This is highlighted in the graph below.
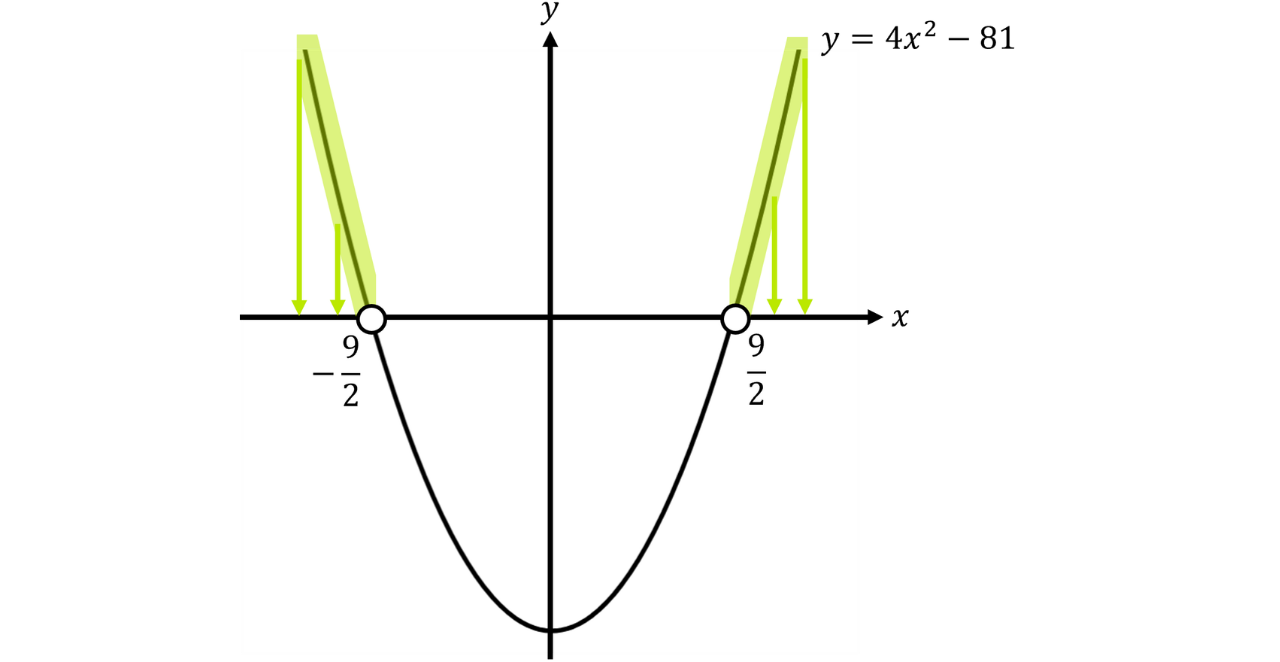
From the graph, the quadratic lies above the axis for values of that are less than or greater than Therefore, the solution to the inequality is
or
We now have two ranges of values of namely:
or
Step 3: Draw a number line to illustrate these ranges and look for any overlap which would tell us the range of values of that satisfies both inequalities.

Note that for is included in the range, so it is represented on the number line with a filled circle.
For or the values and are not included in the ranges, so these are represented with hollow circles.
We now identify where these two ranges overlap. The following diagram highlights the regions where this overlap occurs.
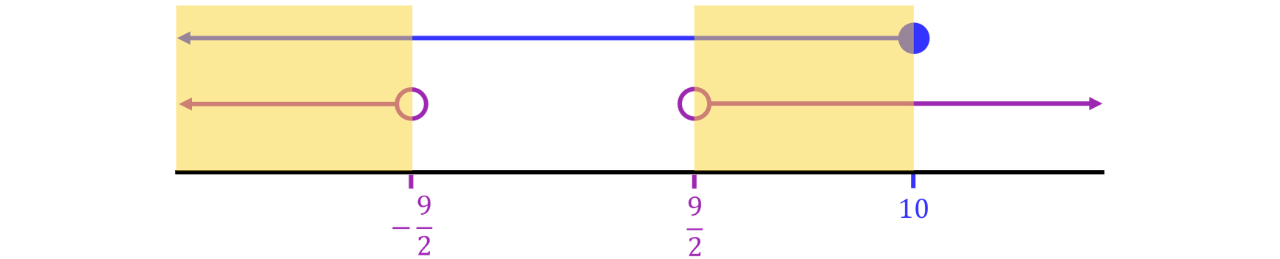
From the number line, we can see that the overlap occurs when or
Therefore, the range of values of that satisfy both inequalities is
or
Example 3:
Here is a trapezium. The area is at most Find the range of possible values of

Step 1: Find an expression for the area of the trapezium.
The area of a trapezium is given by
where and are the parallel lengths and is the height, which are indicated below.

So, the area of this trapezium is
Simplifying the numerator by collecting like terms,
Step 2: Introduce the inequality based on the condition in the question and rearrange so that the inequality is written with a quadratic expression on one side and on the other.
The question states that the area is at most which means that the area is less than or equal to so we use for our inequality.
Multiplying both sides by to get rid of the denominator,
Expanding the brackets on the left-hand side,
Subtracting from both sides,
Step 3: Set the quadratic equal to and solve it.
This quadratic can be factorised to
You may verify this to be true by expanding the brackets. Also, for more information about how to factorise quadratics where the coefficient of is not please read our Factorising Quadratics note.
Next, we set each bracket equal to
or
Solving each linear equation for
or
Step 4: Sketch the graph of the quadratic, indicating the roots.
Now, we sketch the graph of the quadratic indicating its roots.
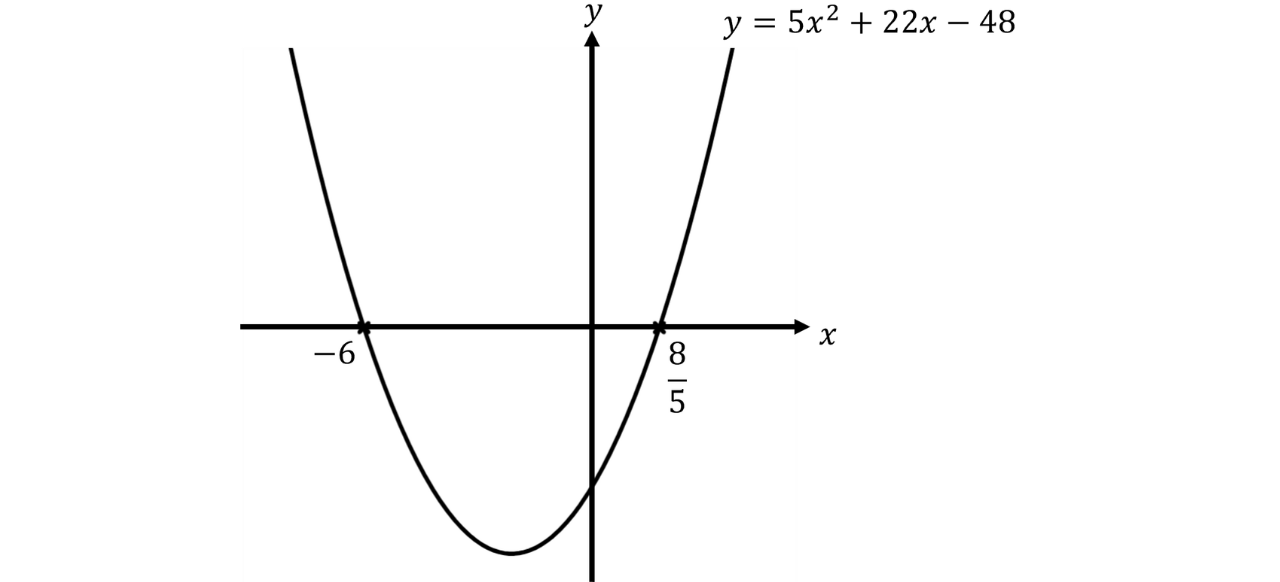
Step 5: Use the graph to determine the range of values that satisfies the inequality.
The inequality means we are looking for where the quadratic is less than or equal to
On the graph, this corresponds to the parts of the curve that lie on or below the axis. This is highlighted in the graph below.
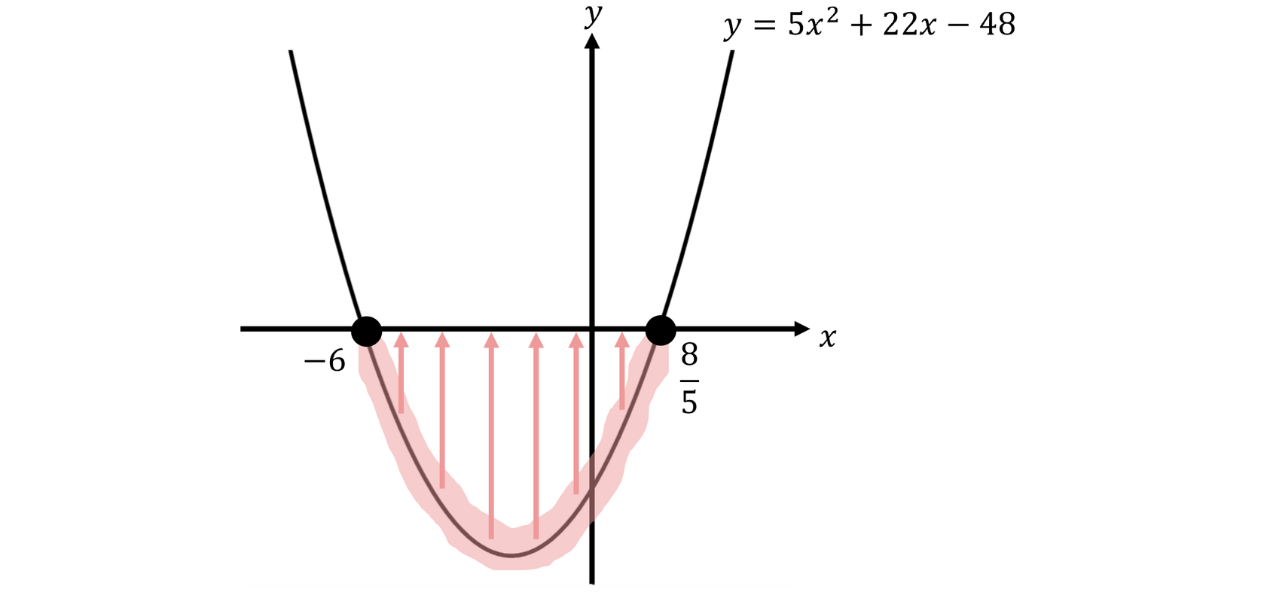
From the graph, the quadratic lies on or below the axis for values of that are between and (including both and Therefore, the solution to the inequality is
However, this is not the final solution because the question involves lengths, which must be positive.

For instance, observe the length when
When we substitute we get which is not valid because lengths cannot be negative. Therefore, we must have
We also note that is not included, since substituting into would give a length of which is also not valid.
With the other lengths of and also remain positive.
Therefore, the actual range of values of is
Challenging Question