Venn & Euler Diagrams
Nick Featherstone & Joe Wolfensohn
Teachers


Contents
Introduction - Venn & Euler Diagrams
What is a Venn diagram?
-
Venn diagrams are used to show the relationship between groups or sets.
-
The overlap between circles shows that something fits into both categories rather than one.
Example
From the Venn Diagram above we can conclude the following:
- 11 people only like cats
-
12 people only like dogs
-
14 people like both cats and dogs (14 is in the overlap)
-
6 people do not like cats or dogs (6 is outside of the two categories of ‘likes cats’ and ‘likes dogs’)
What is a Euler diagram?
-
Euler diagrams are similar to Venn diagrams, but only show the overlaps that ‘actually’ exist.
Example
If there were nobody who liked both cats and dogs, the Euler diagram would be drawn like this instead:
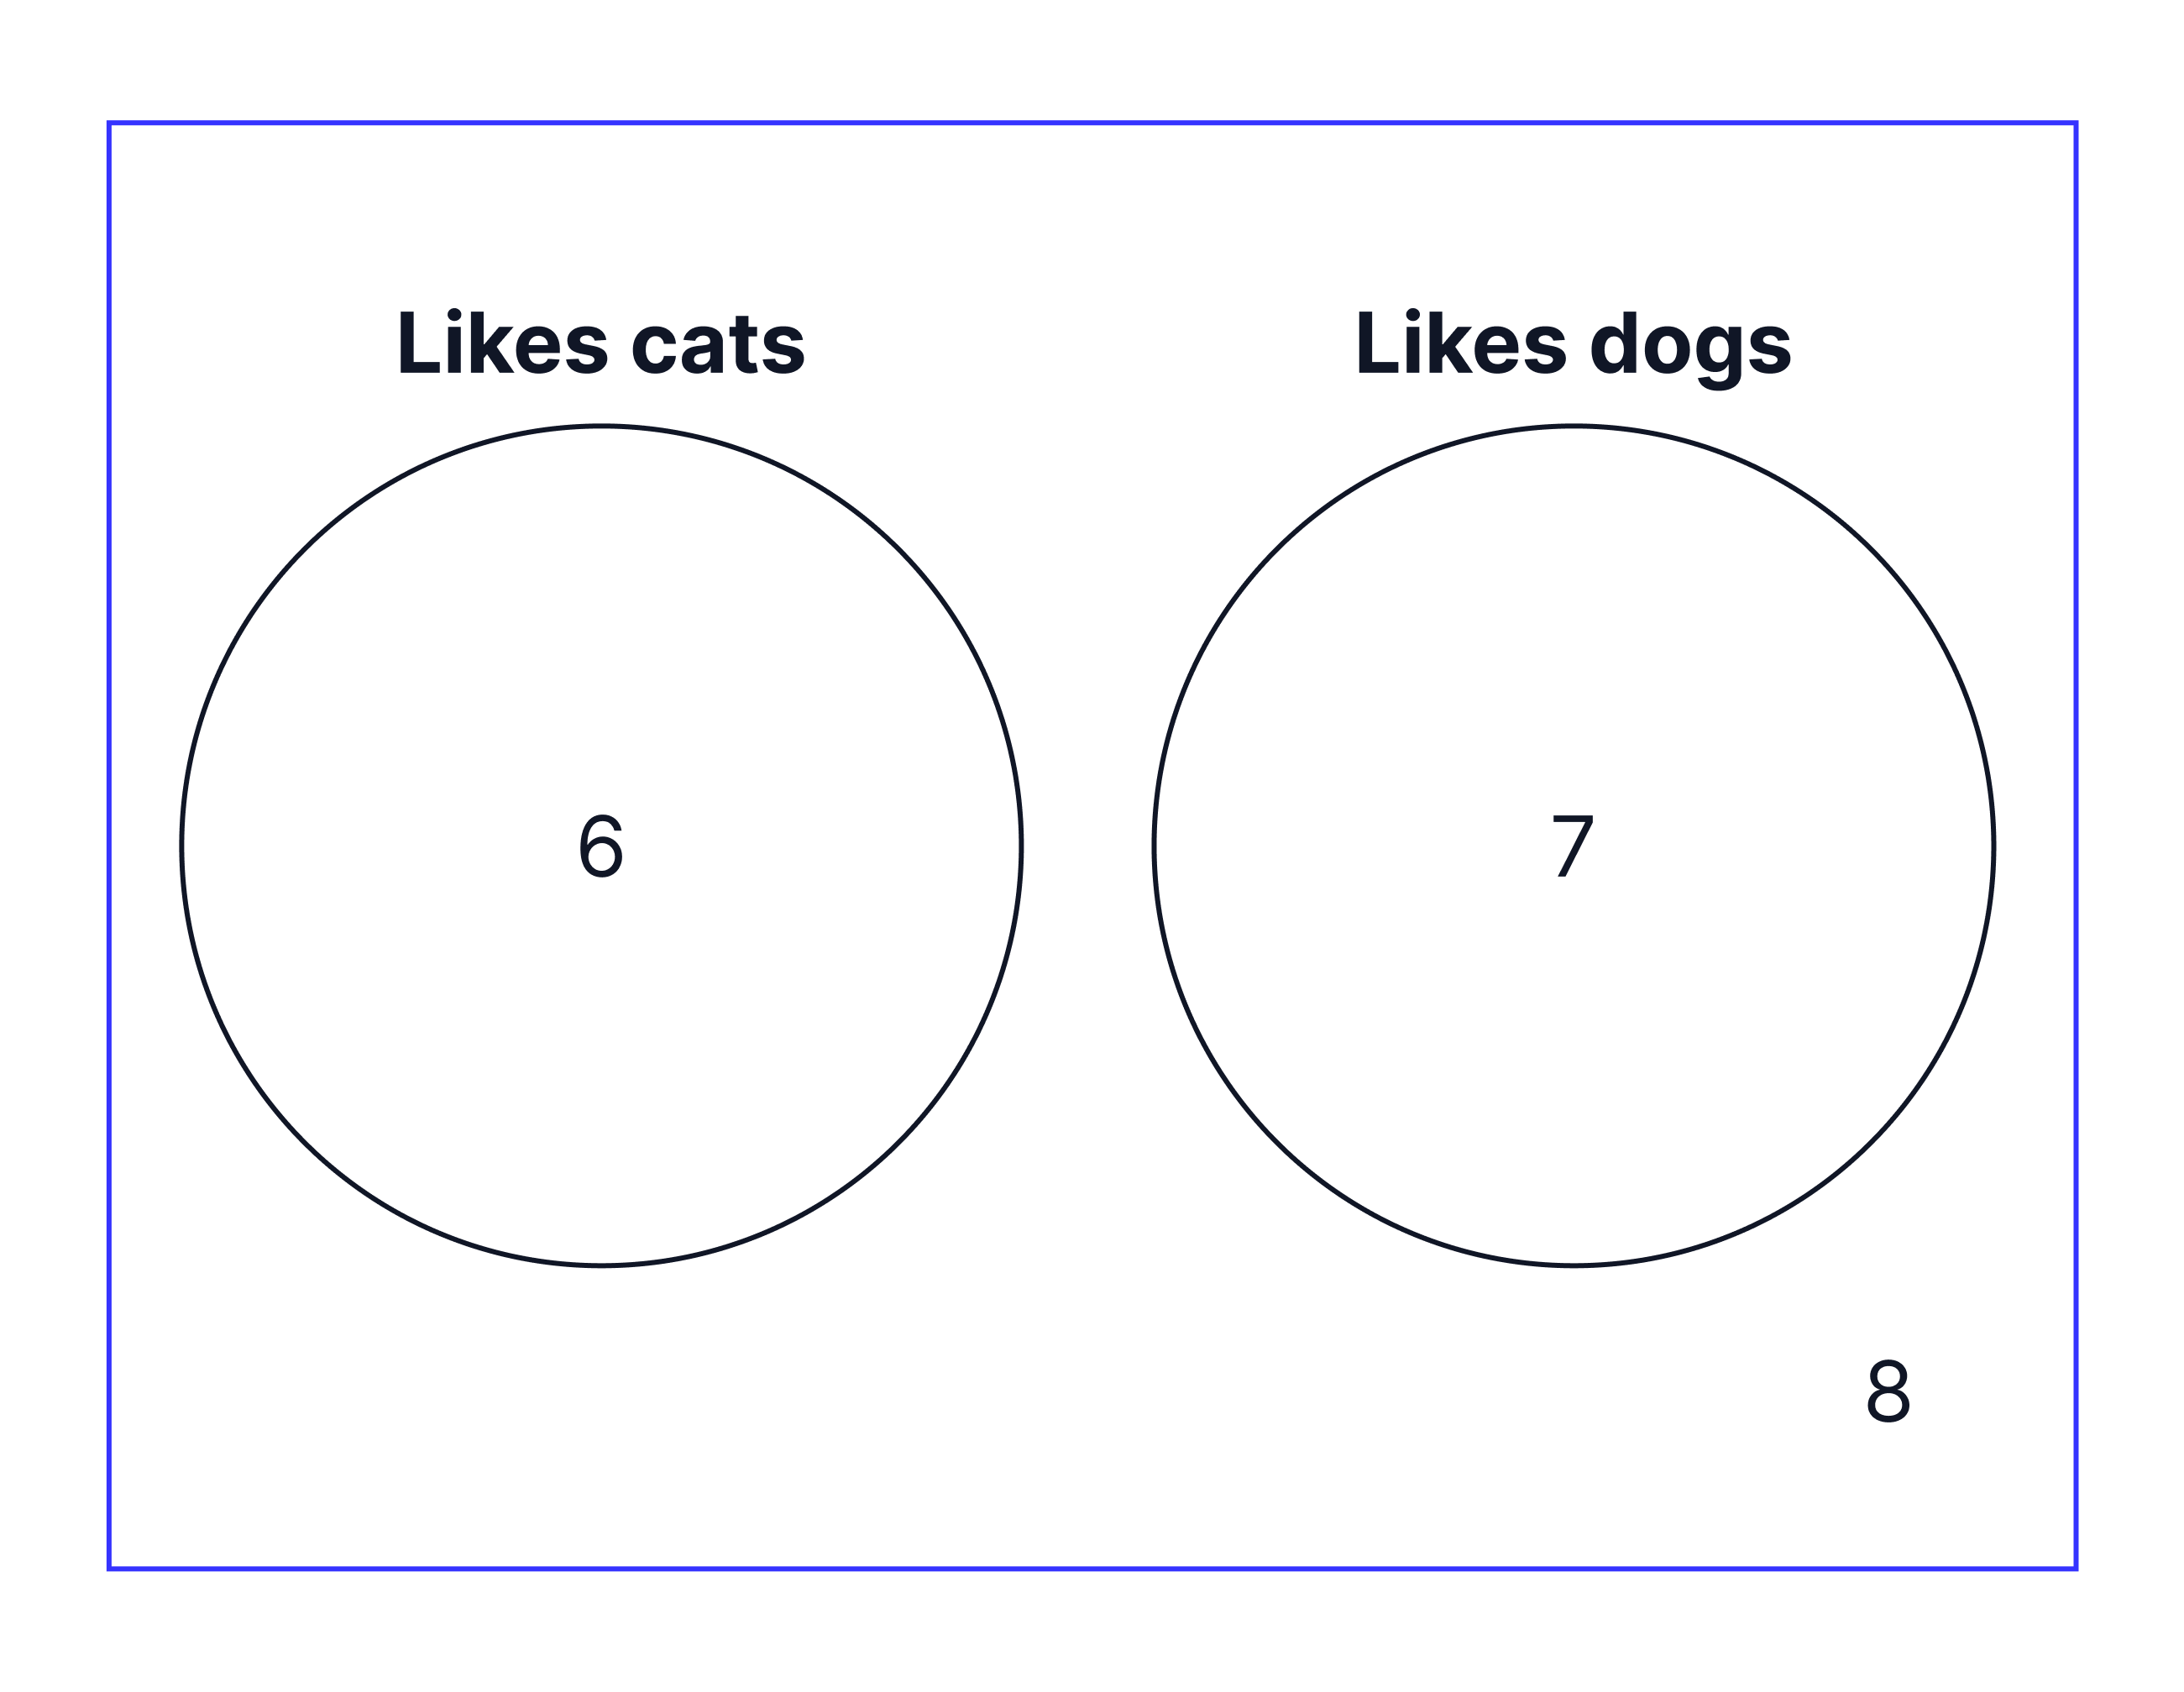
From the Euler Diagram above we can conclude the following:
- 6 people only liked cats
-
7 people only liked dogs
-
0 people liked cats and dogs
-
8 people did not like cats or dogs
If this same information was drawn using a Venn Diagram it would look like this:
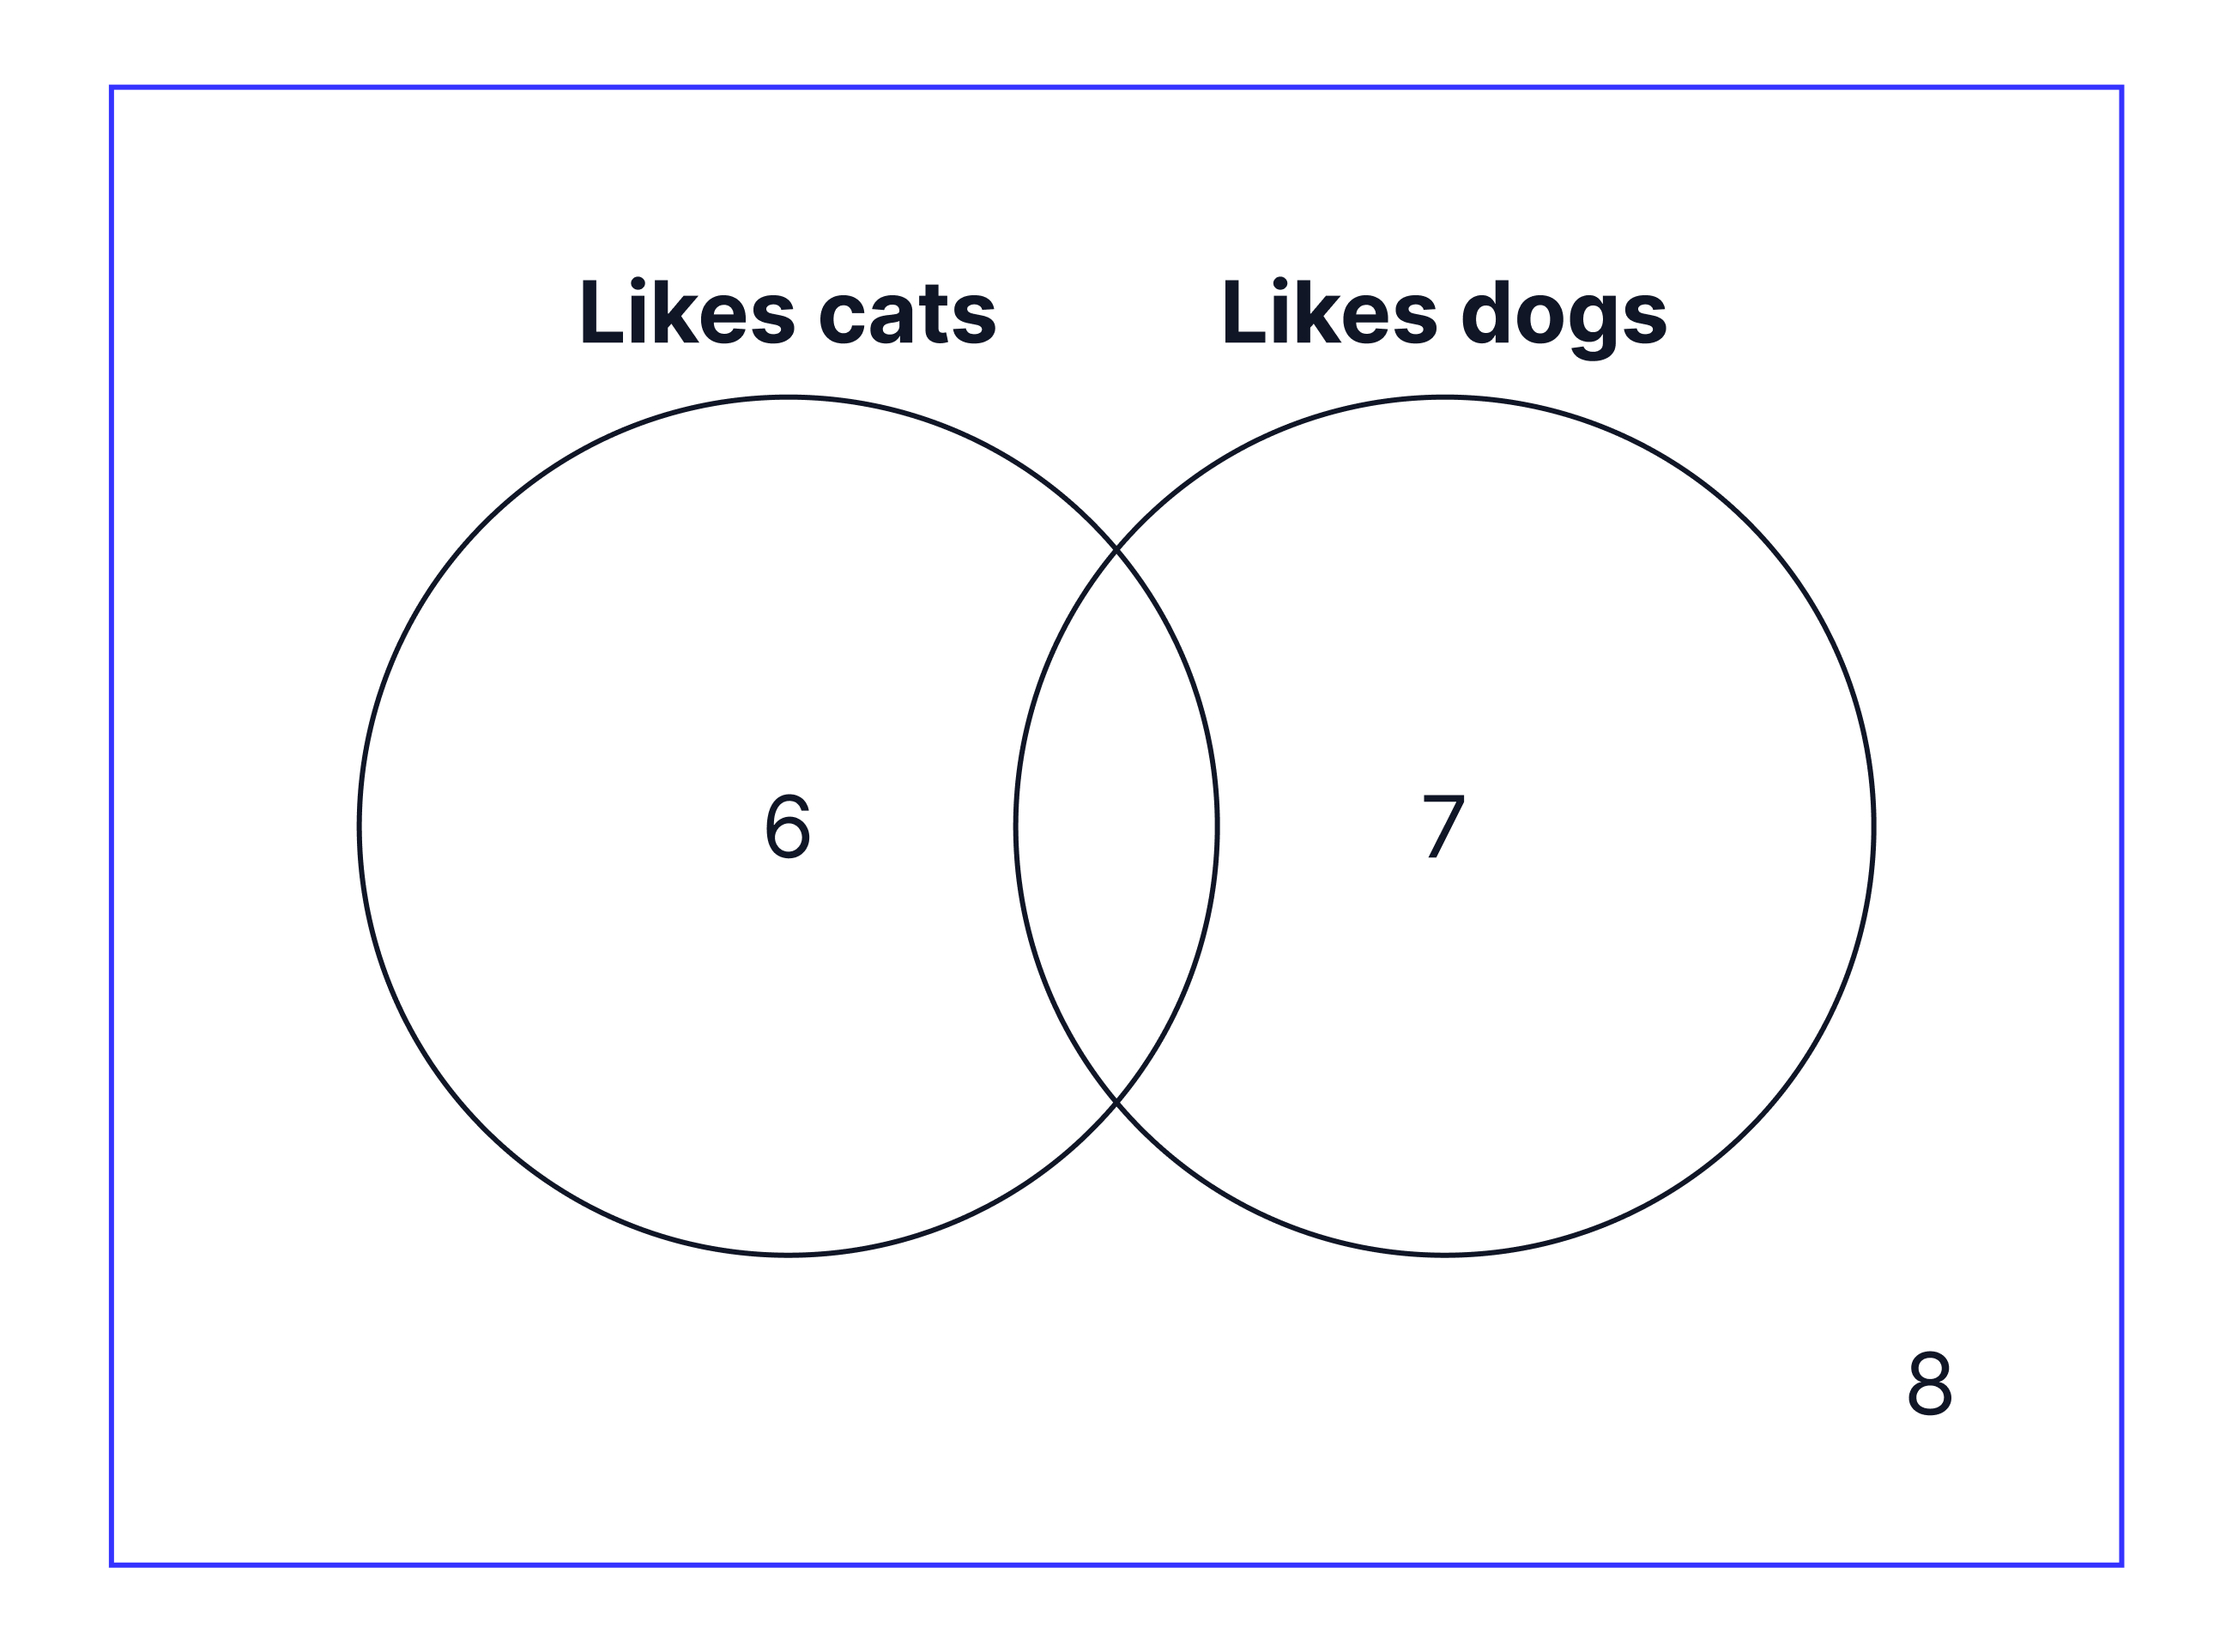
Why are these diagrams used in the UCAT?
-
Tests your ability to interpret visual information and draw conclusions.
-
Helps you to organise complex information in a concise manner.
-
Enhances your ability to identify patterns and draw conclusions more easily.
Explainer Video
Filmed by our Maths department, this video walks through the logic and maths behind Venn & Euler diagram questions from first principles.
Worked Examples
Question 1 - Easy
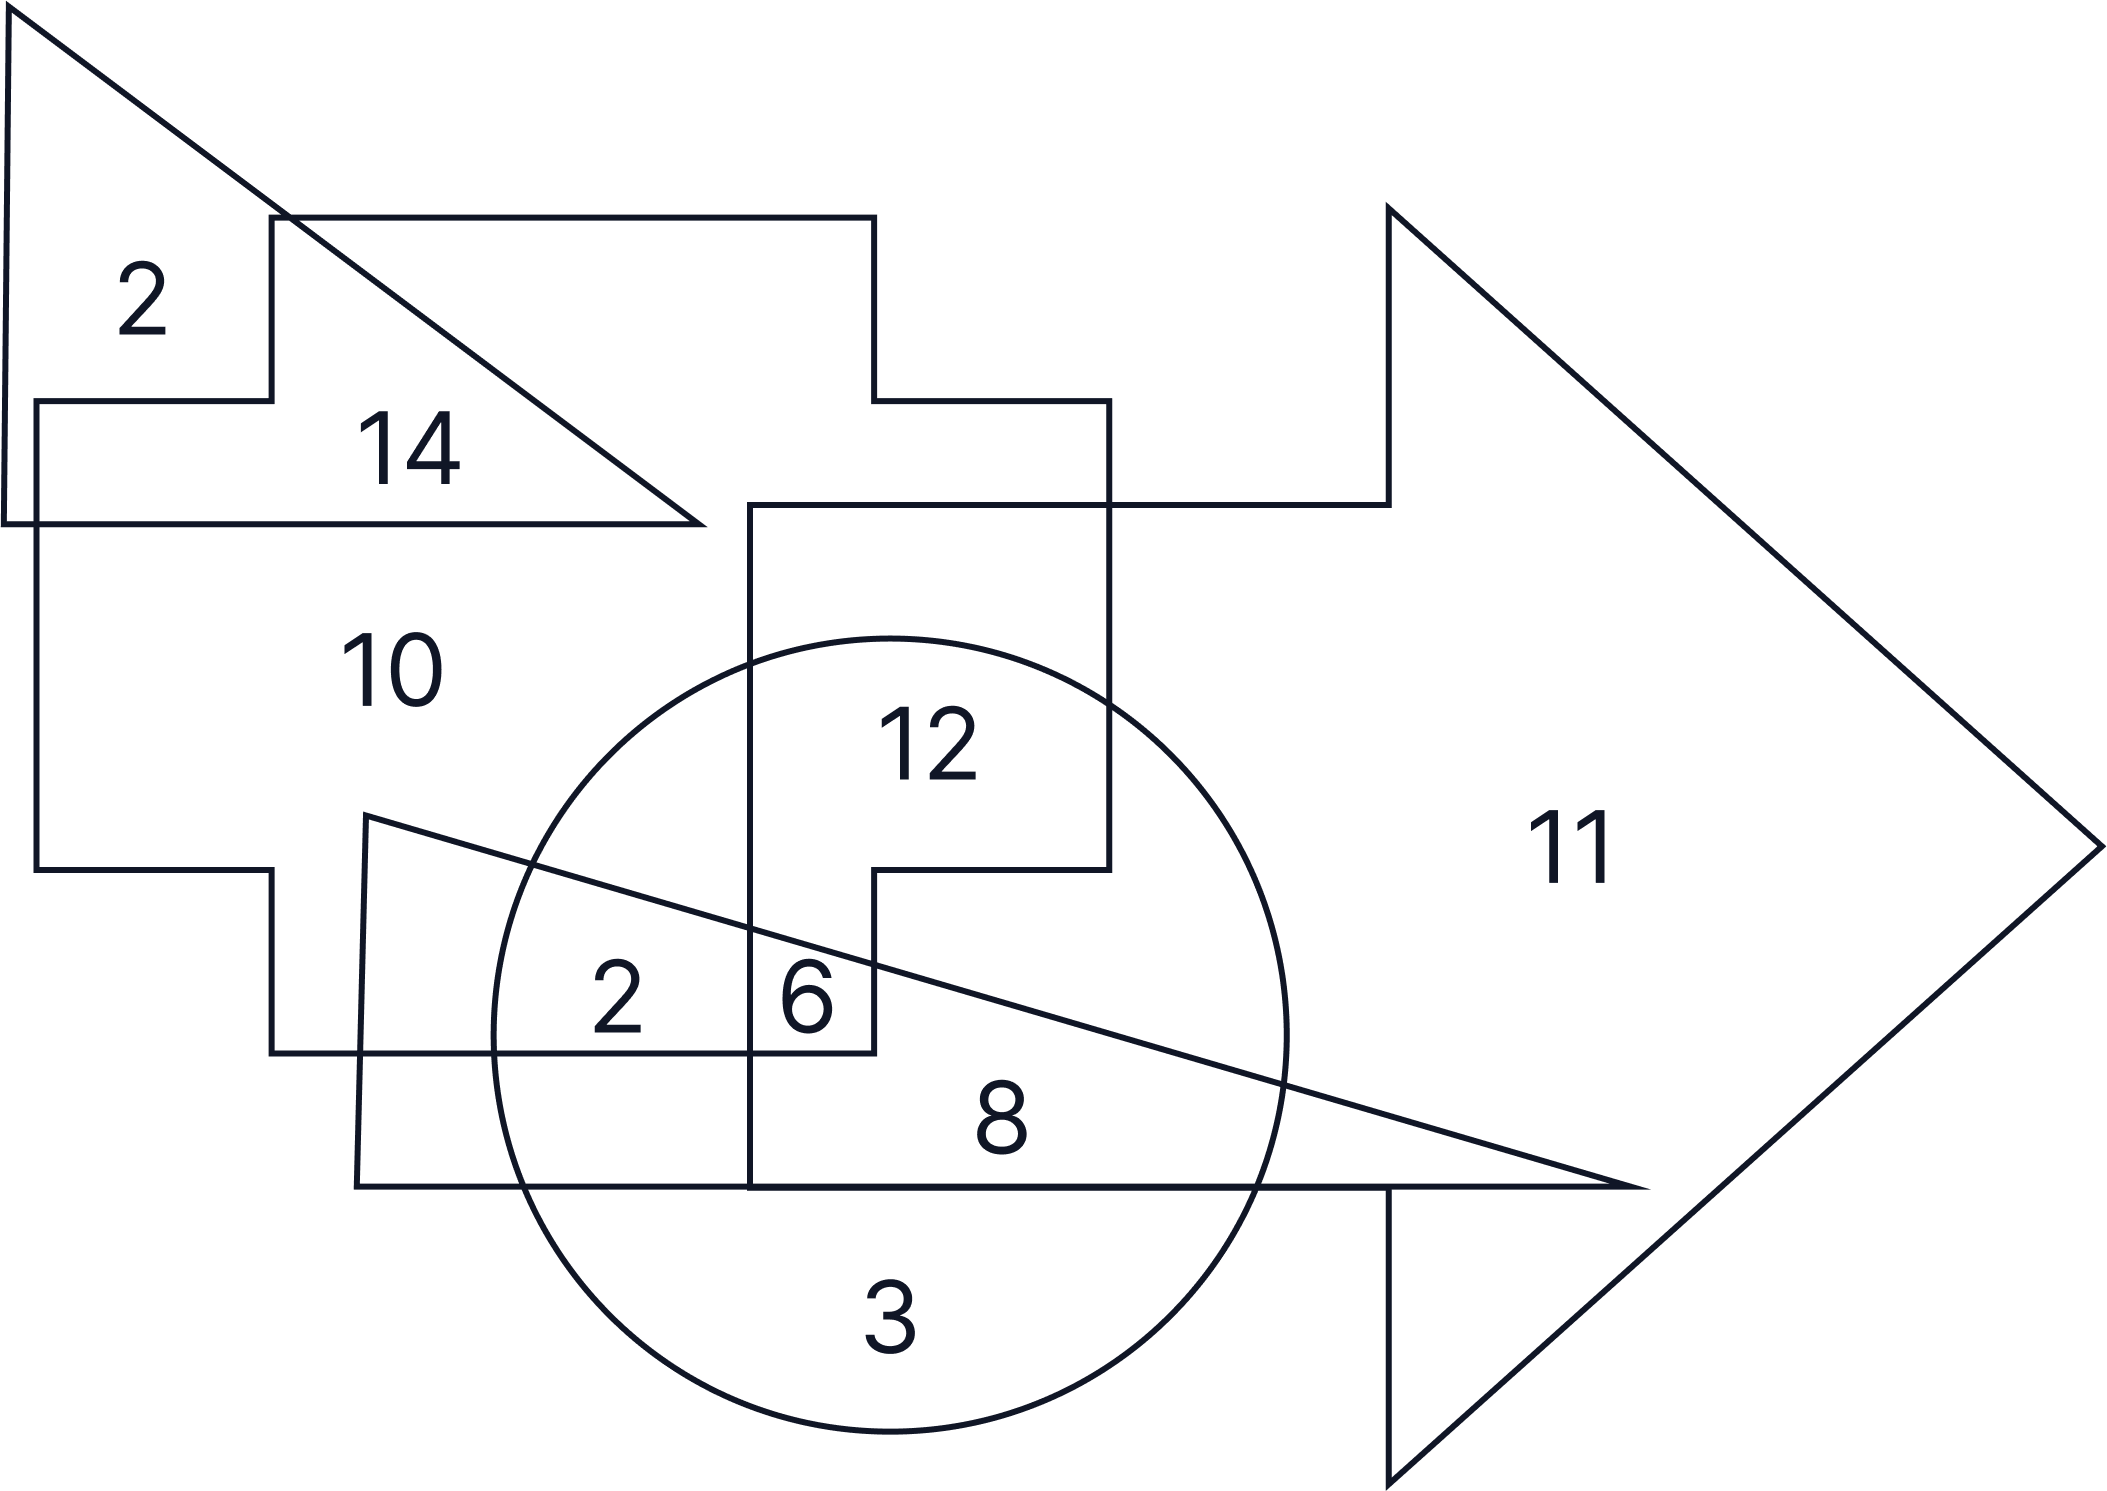
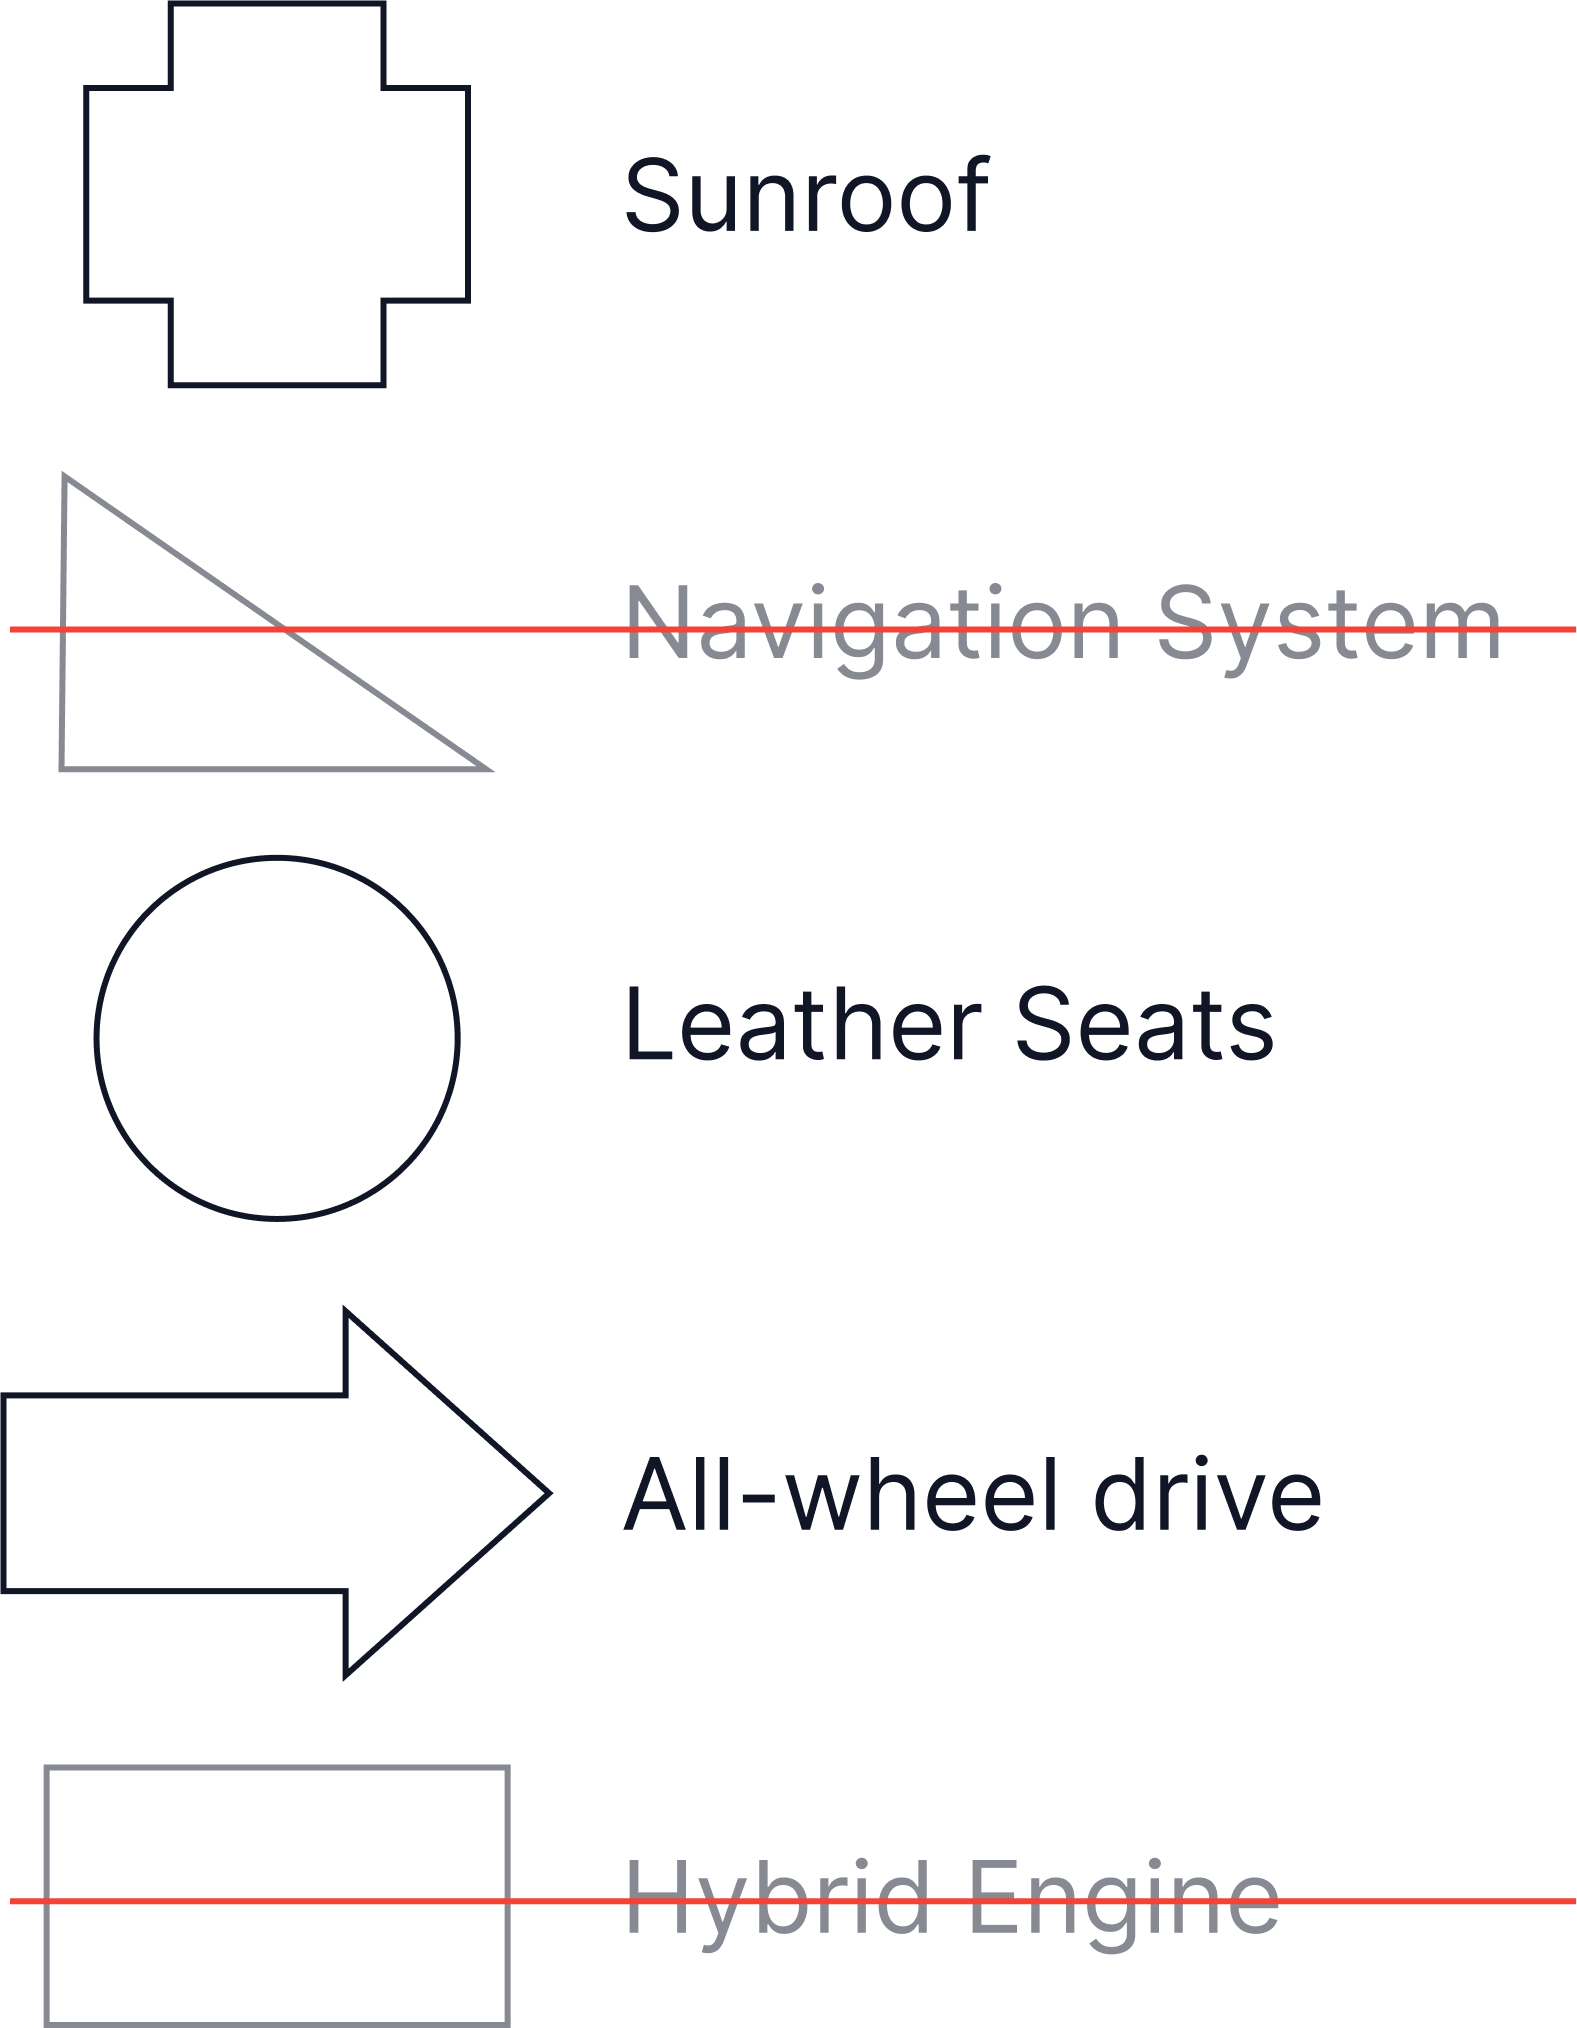
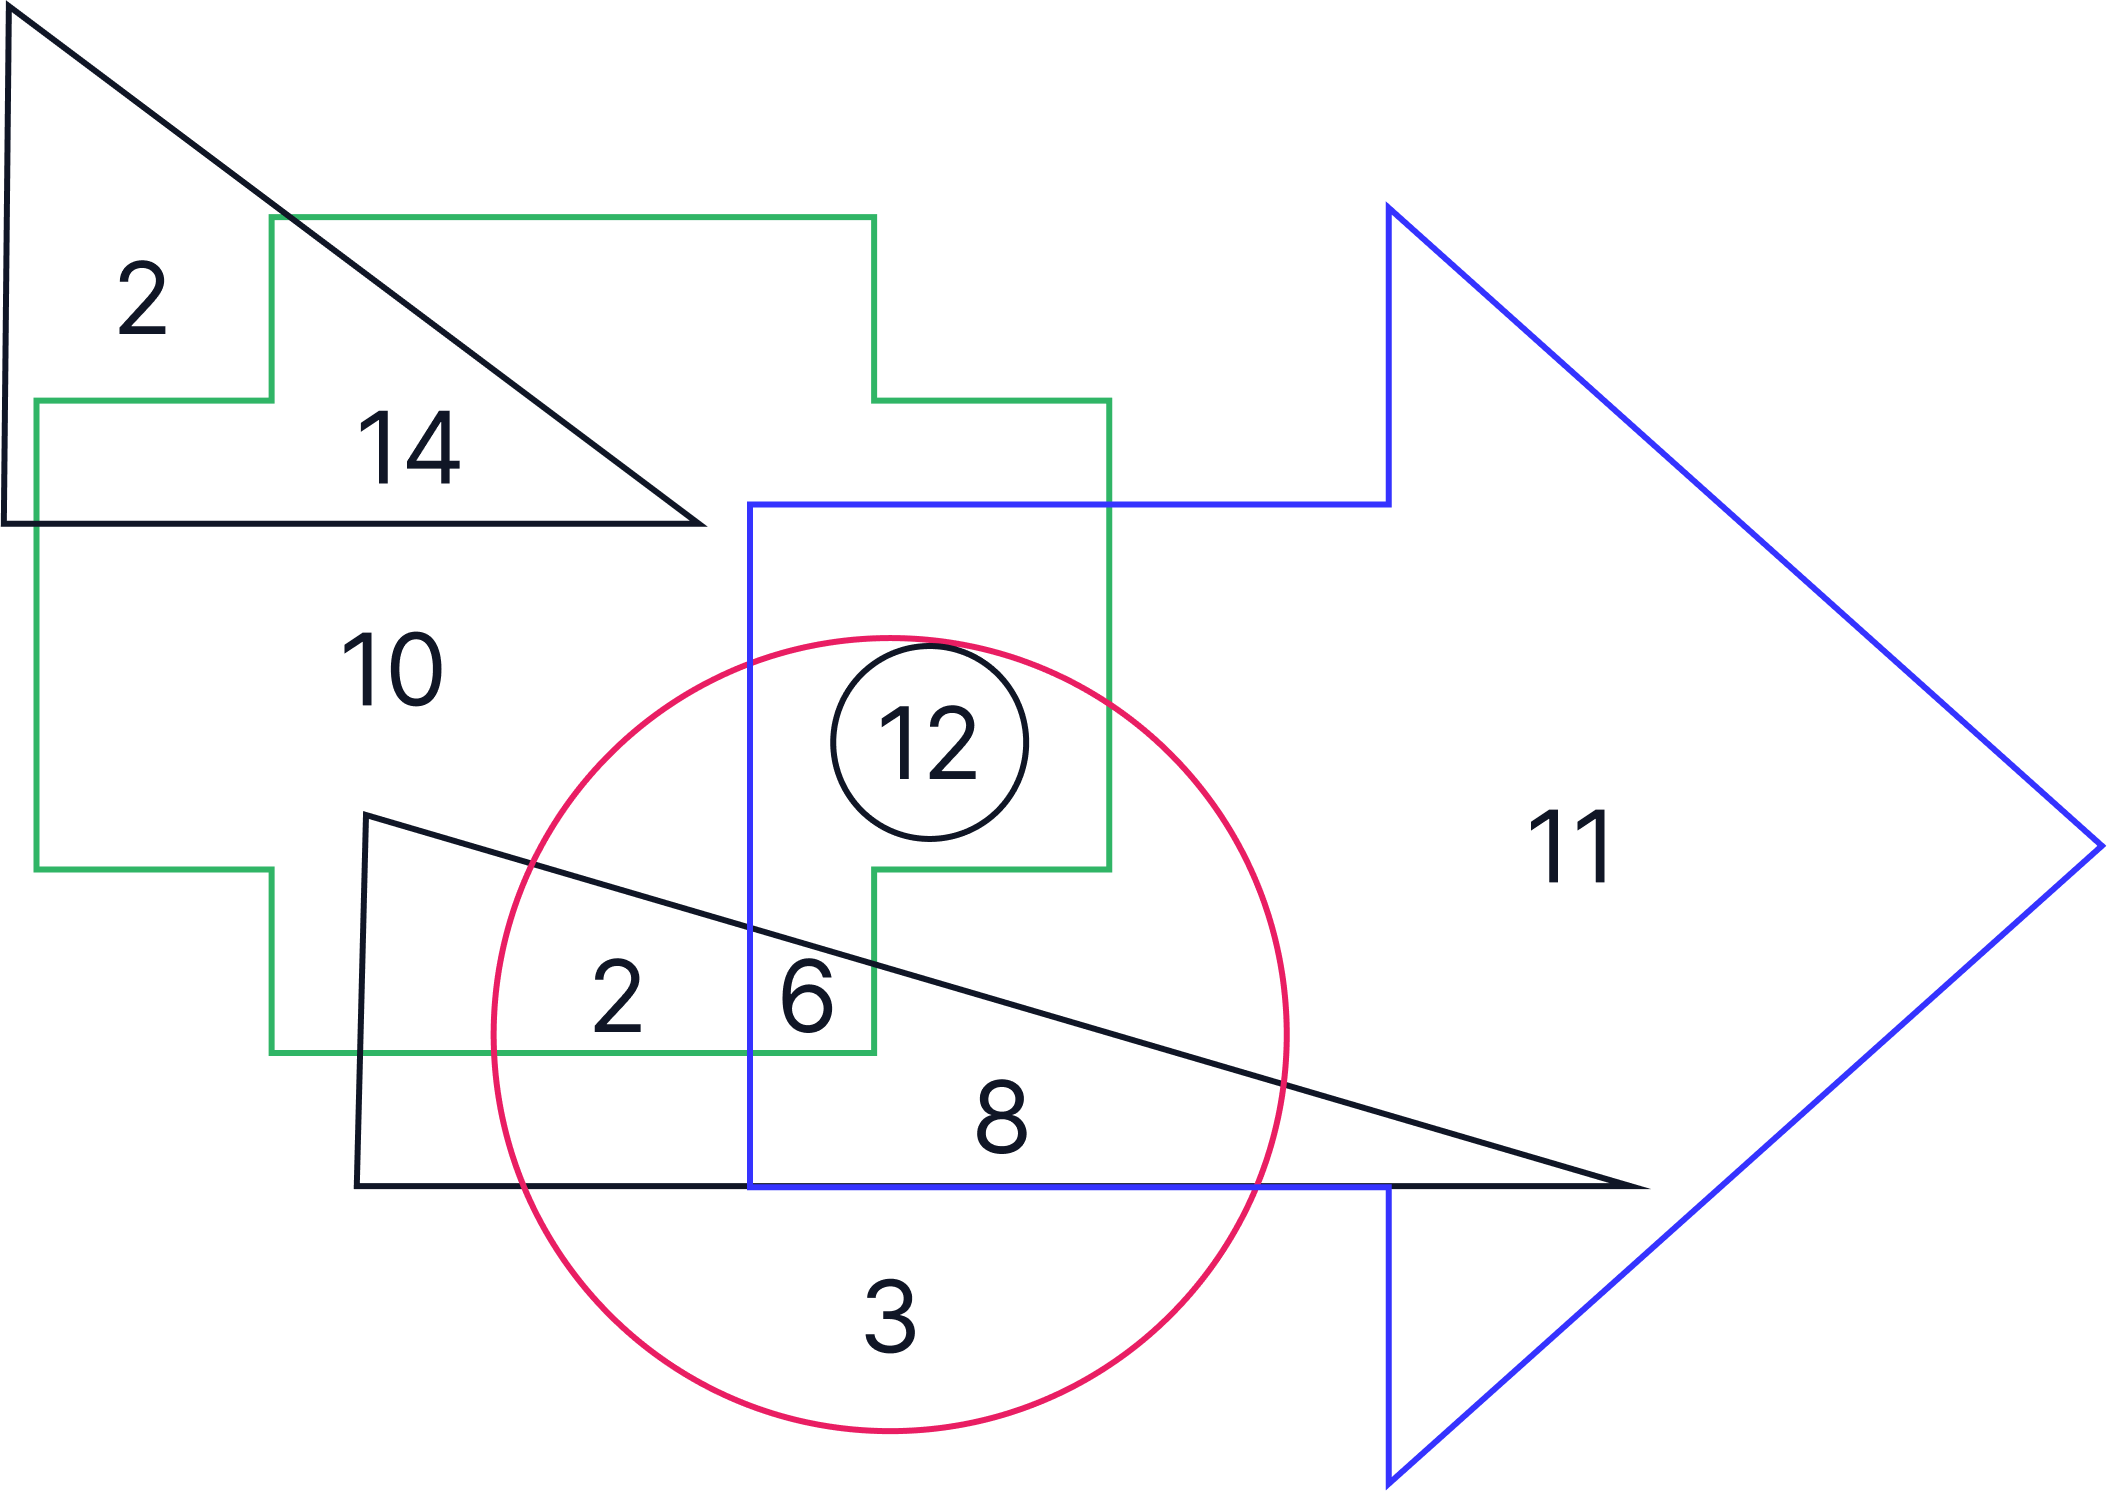
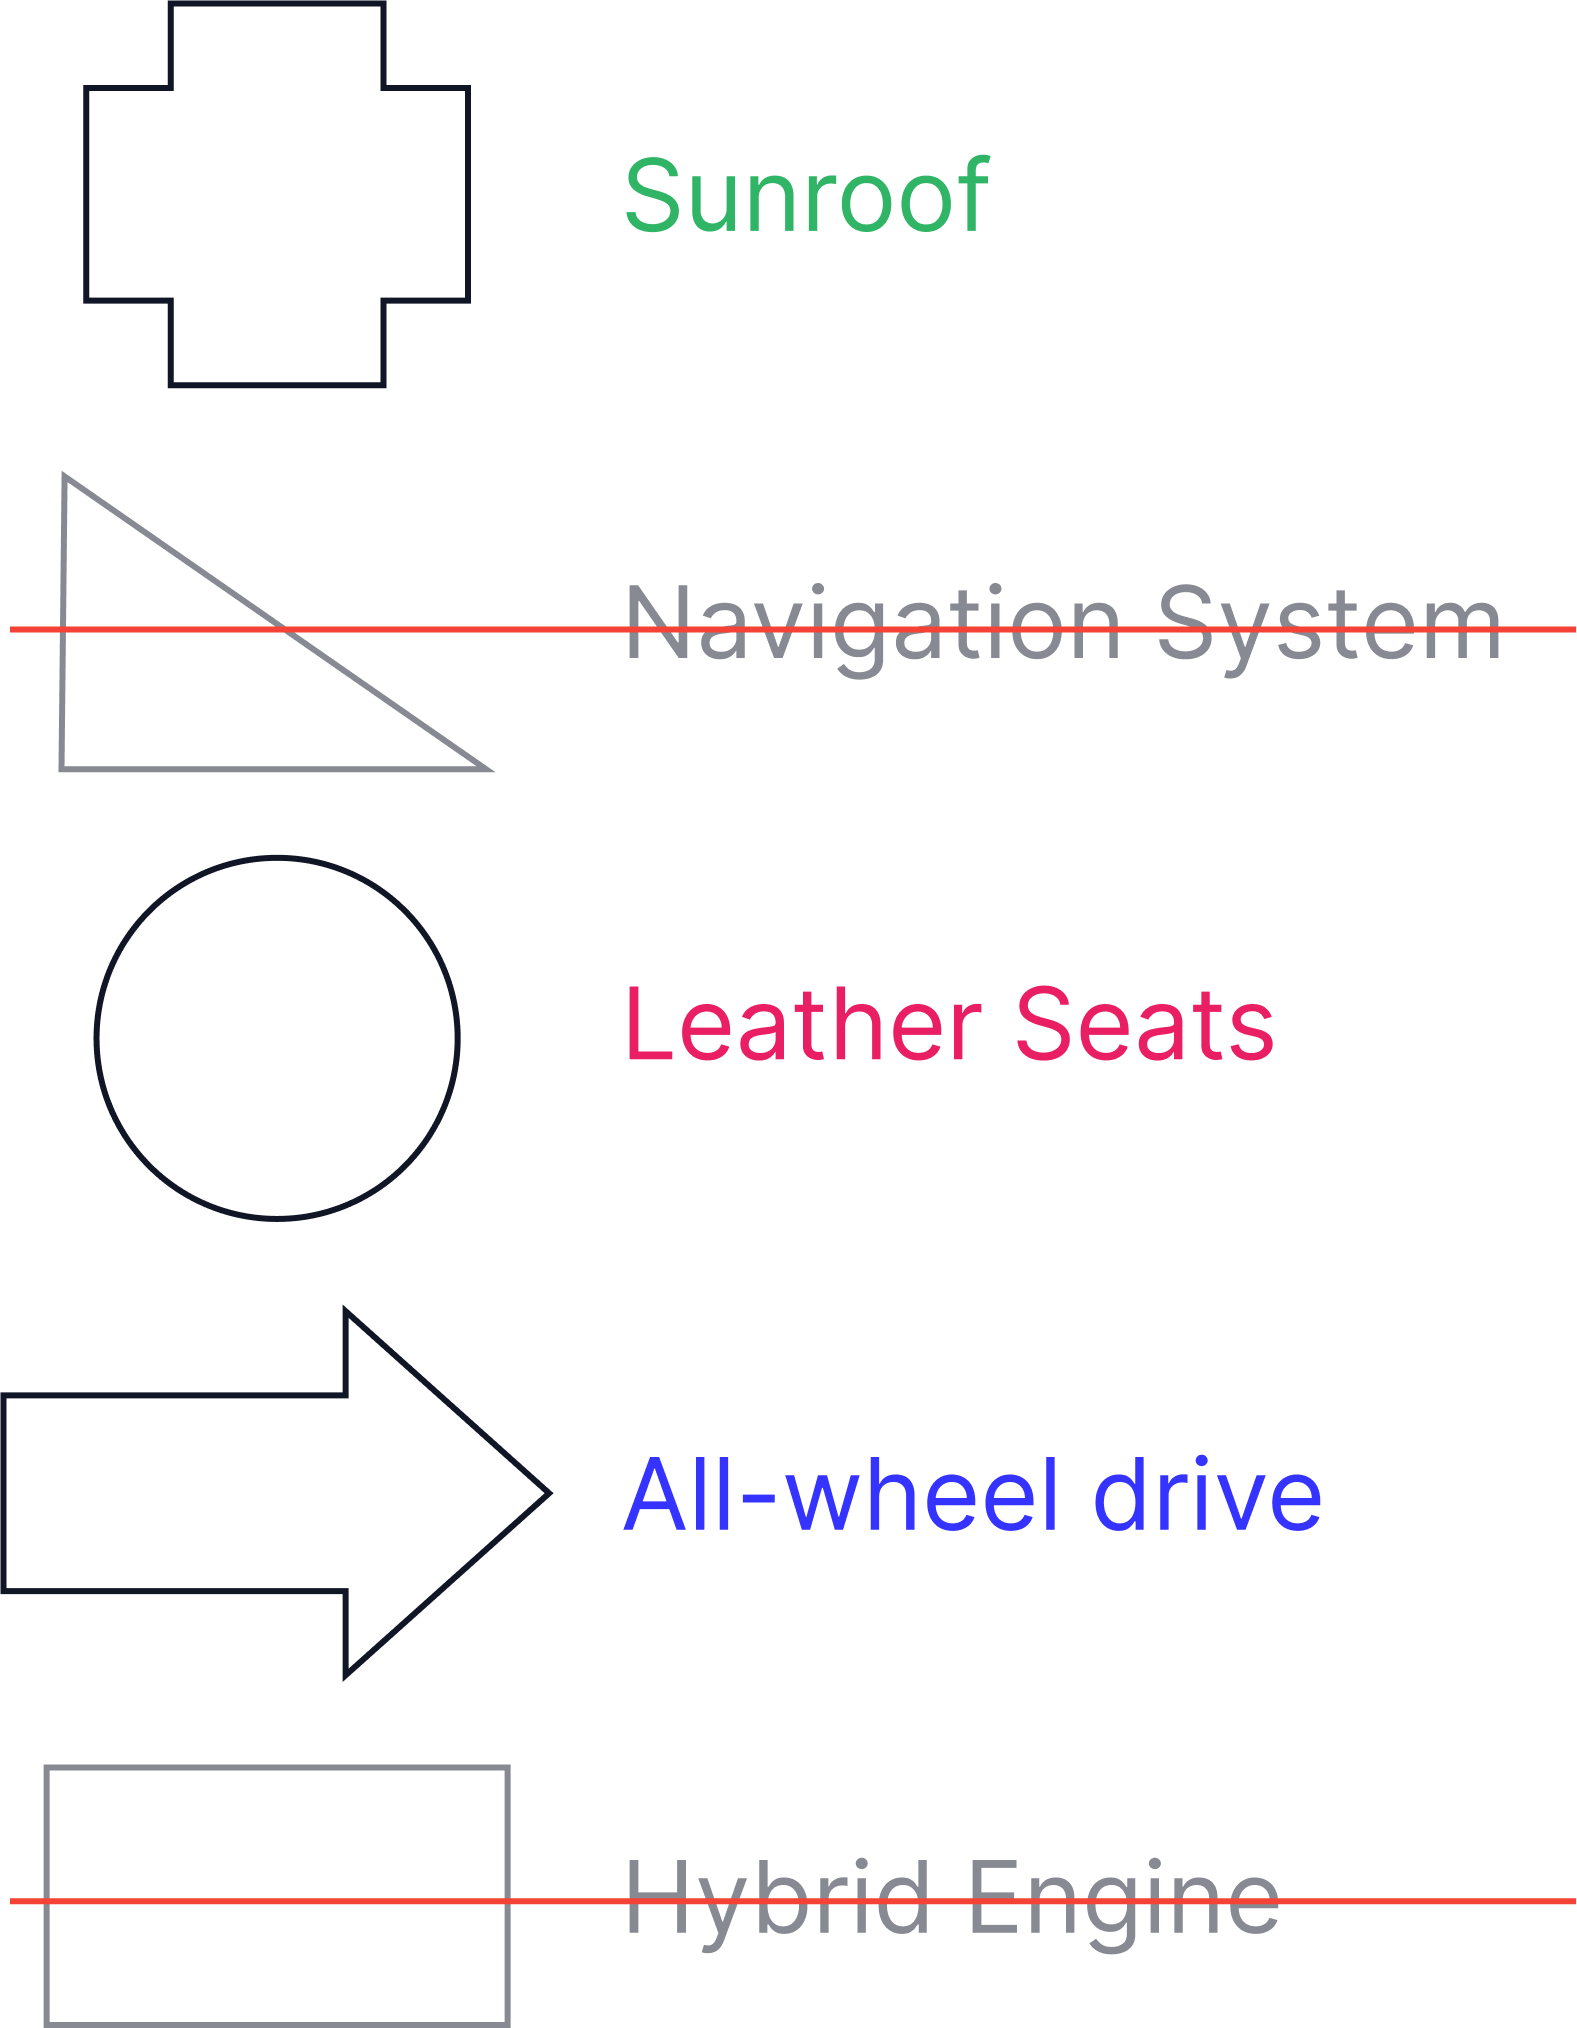
A car dealership has vehicles made up of various features: sunroof, navigation system, leather seats, all-wheel drive, and hybrid engine. Each car was manufactured to include one or more of these features.
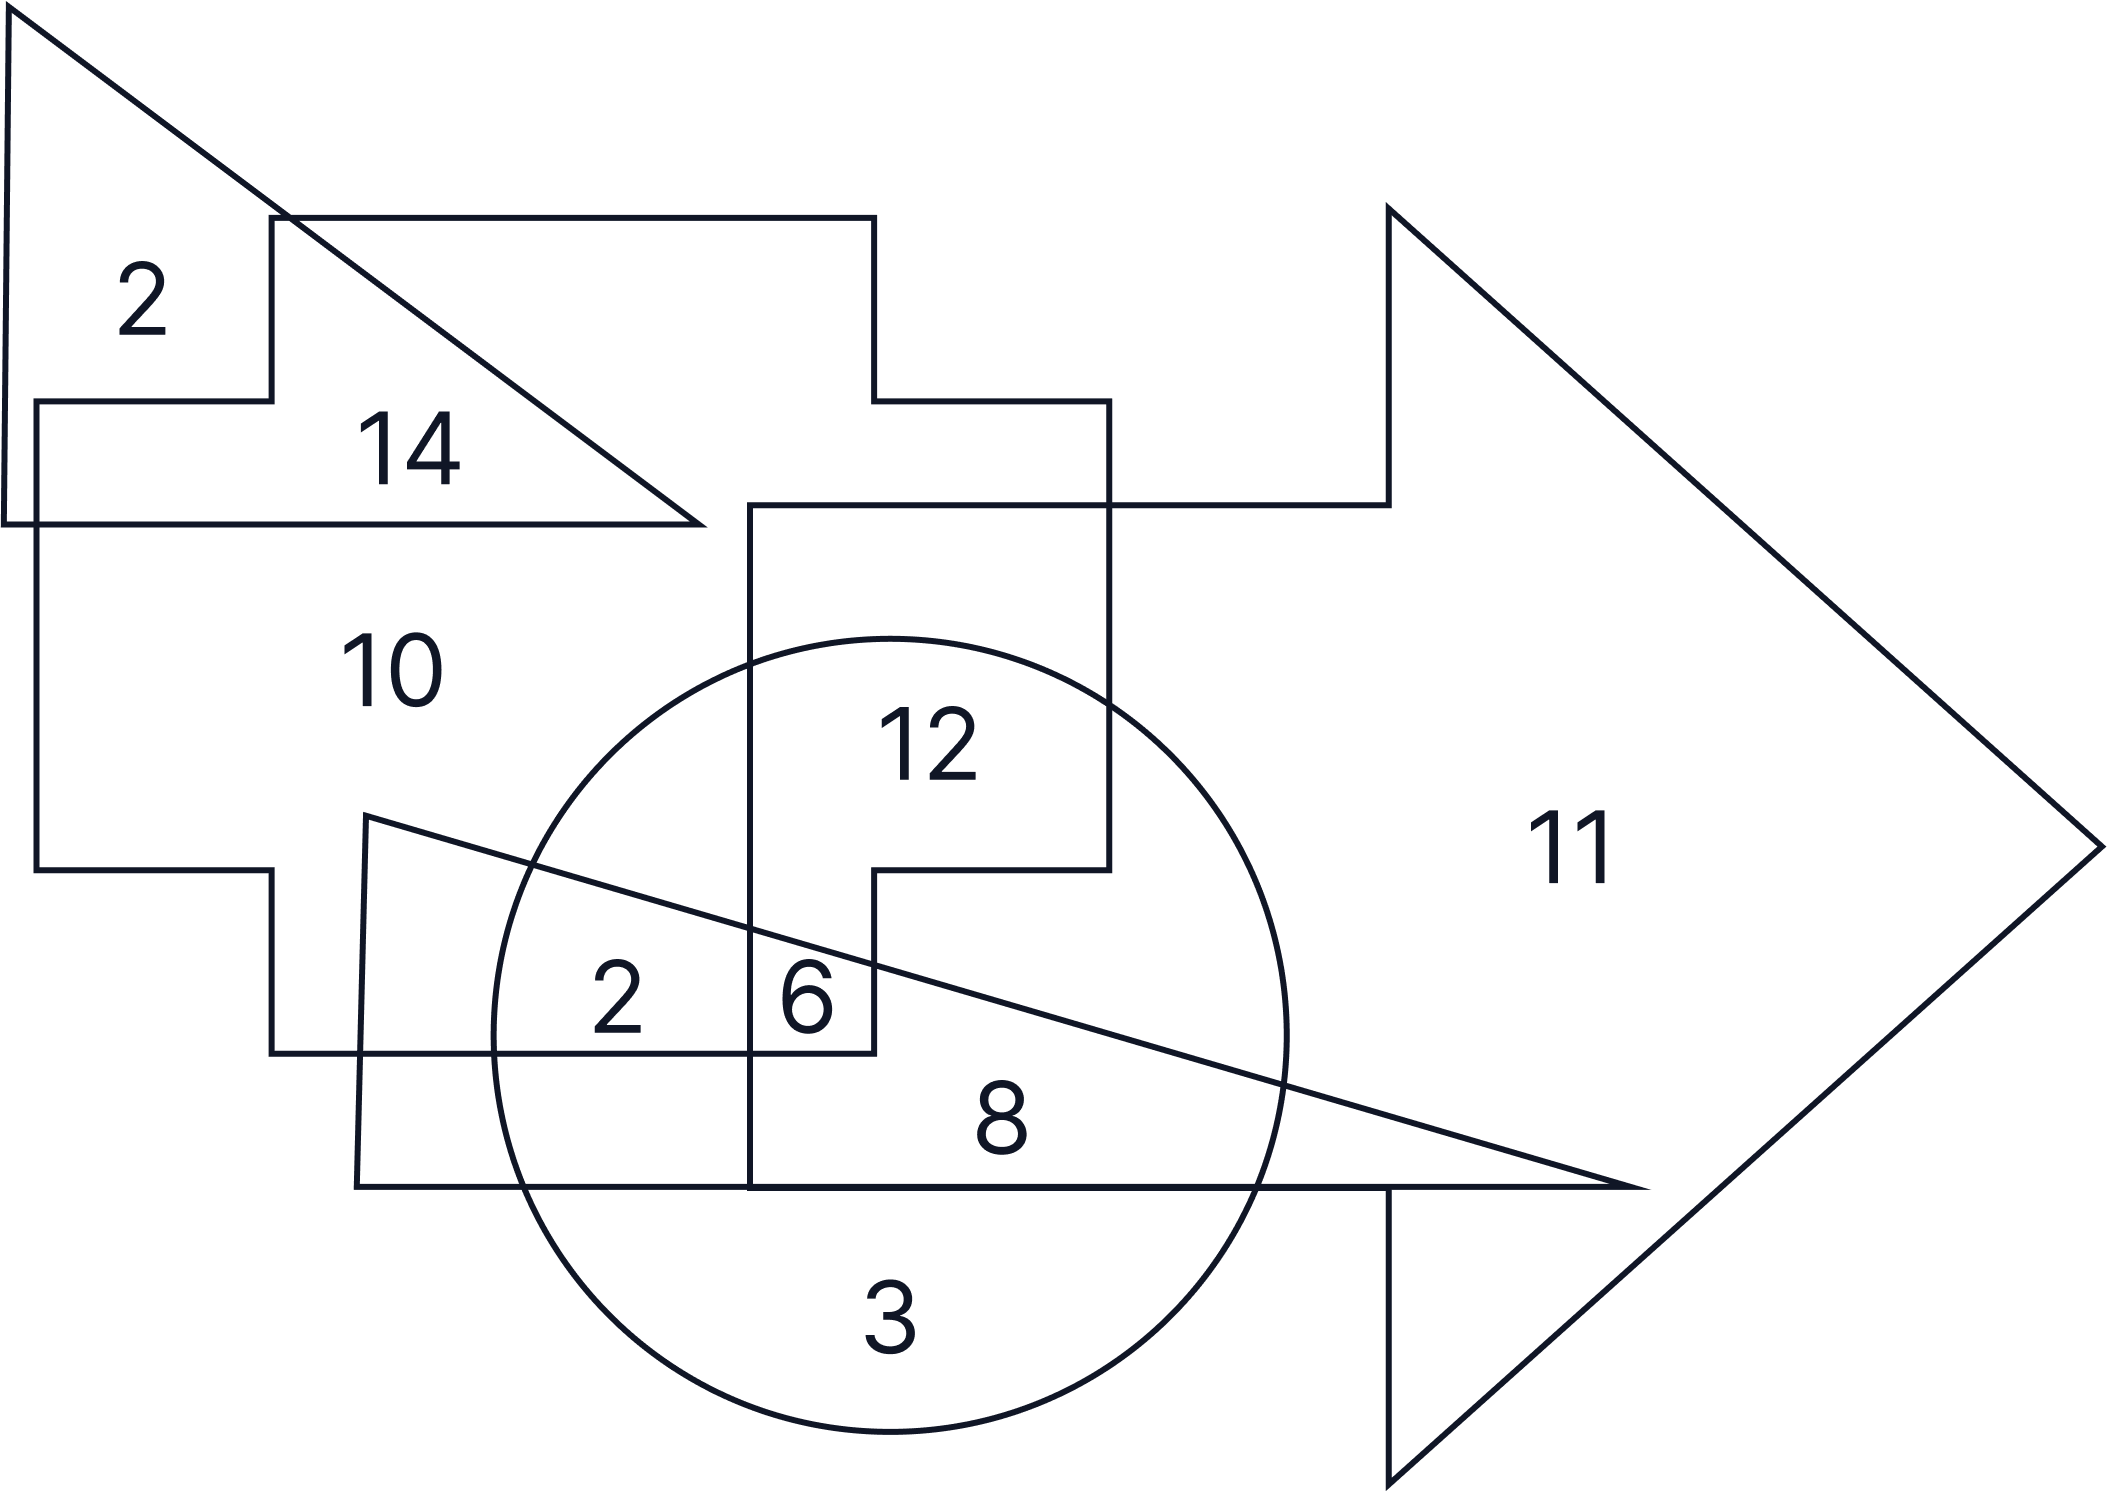
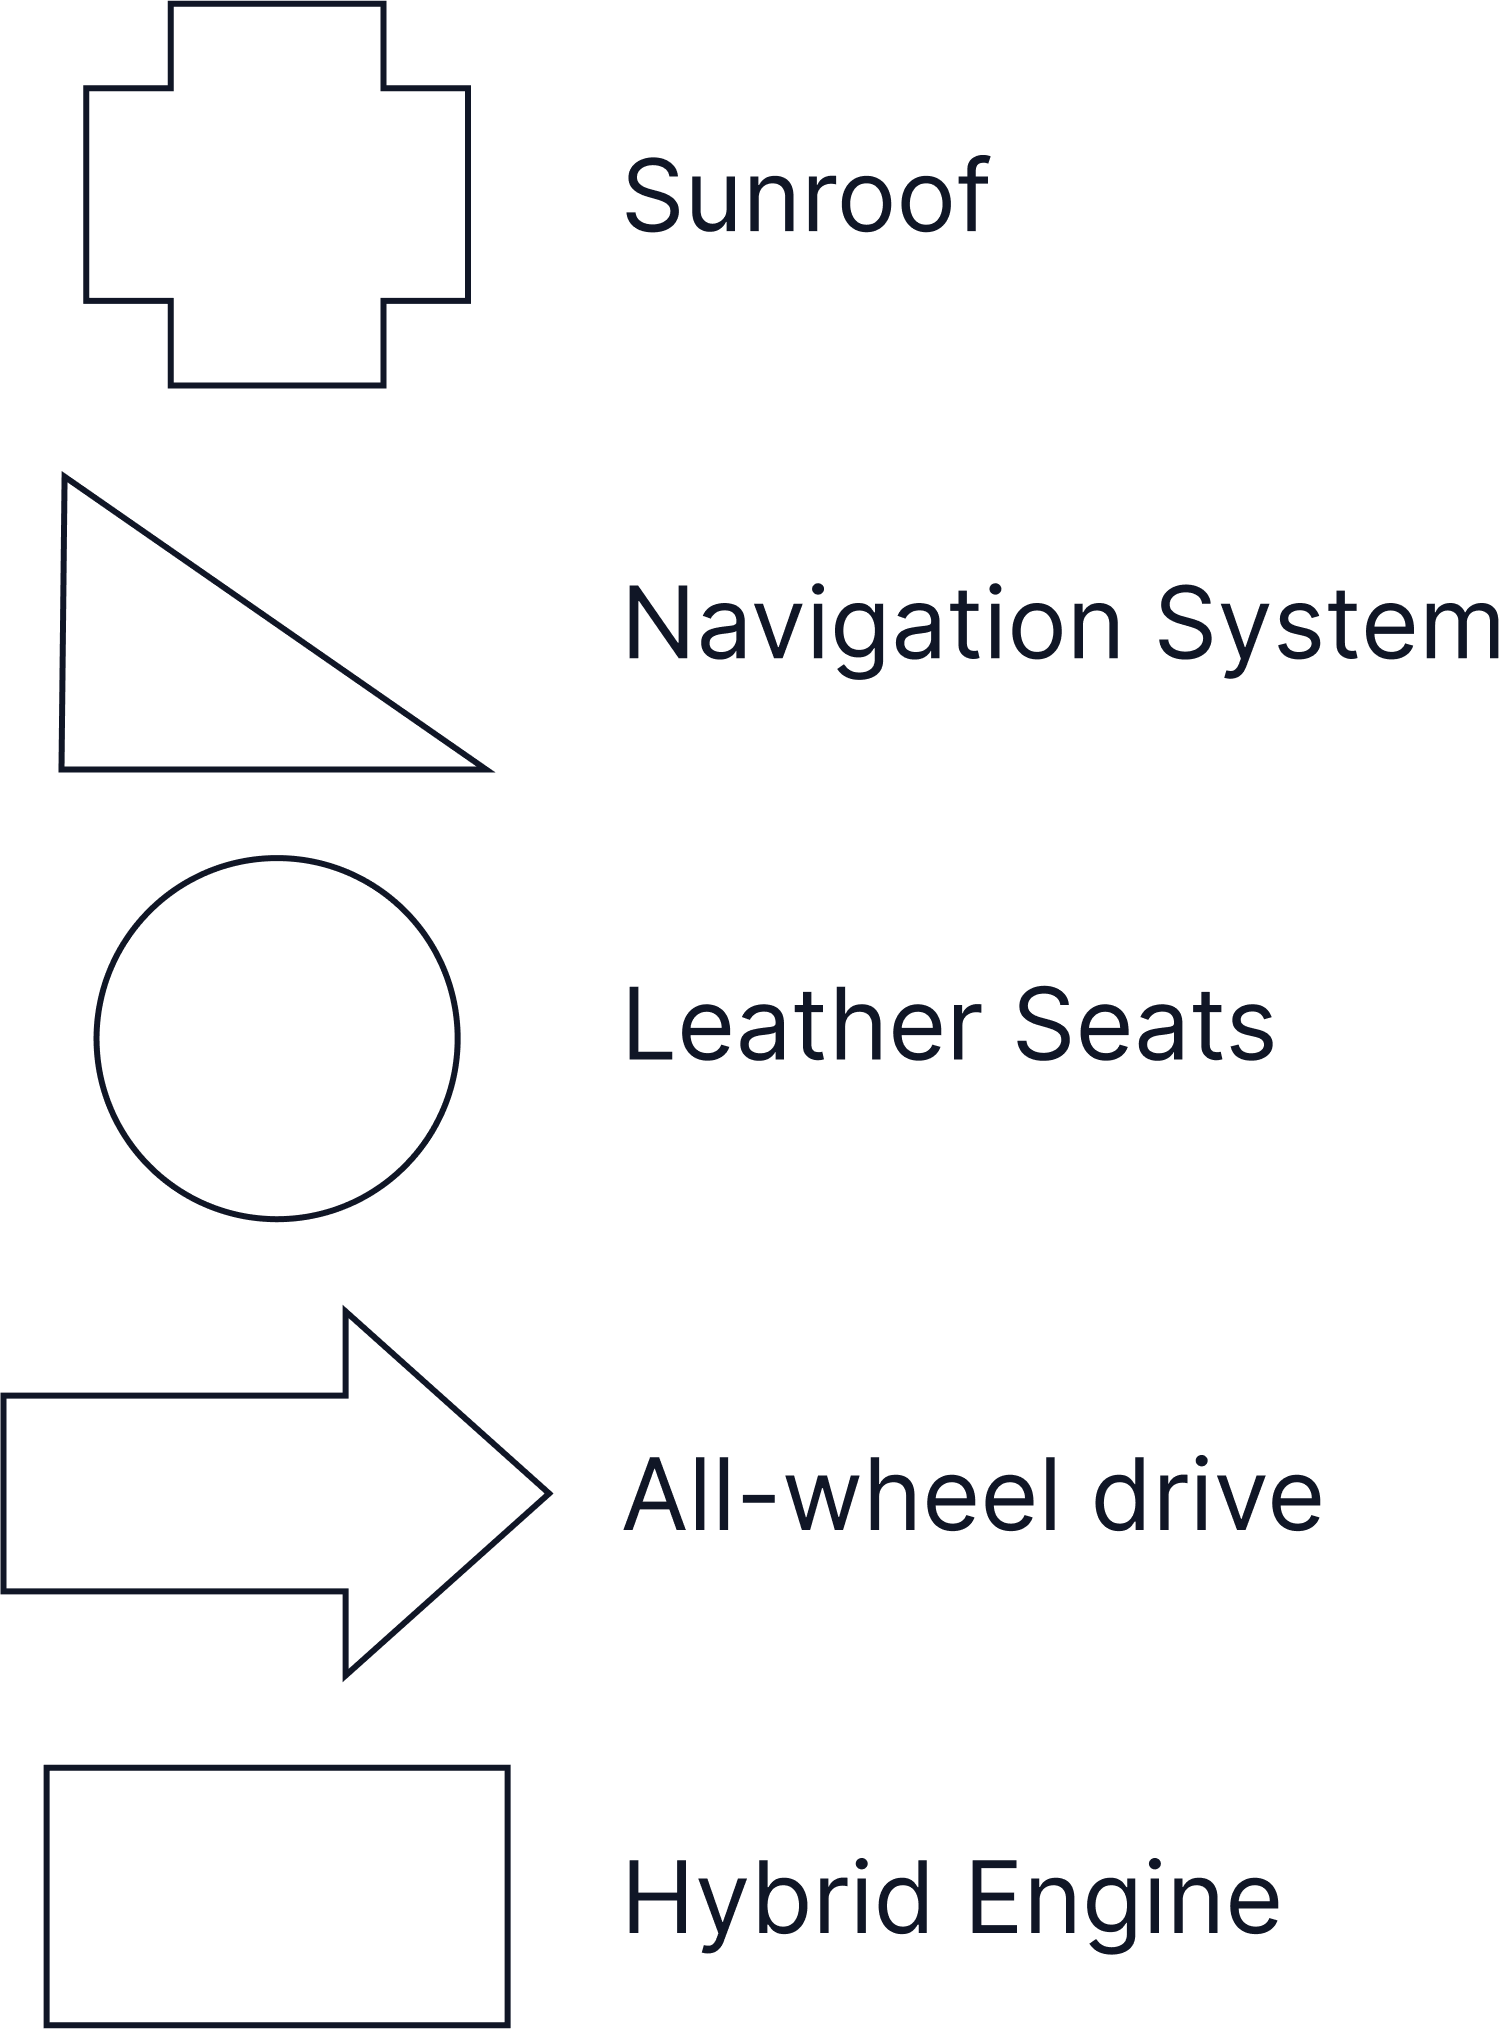
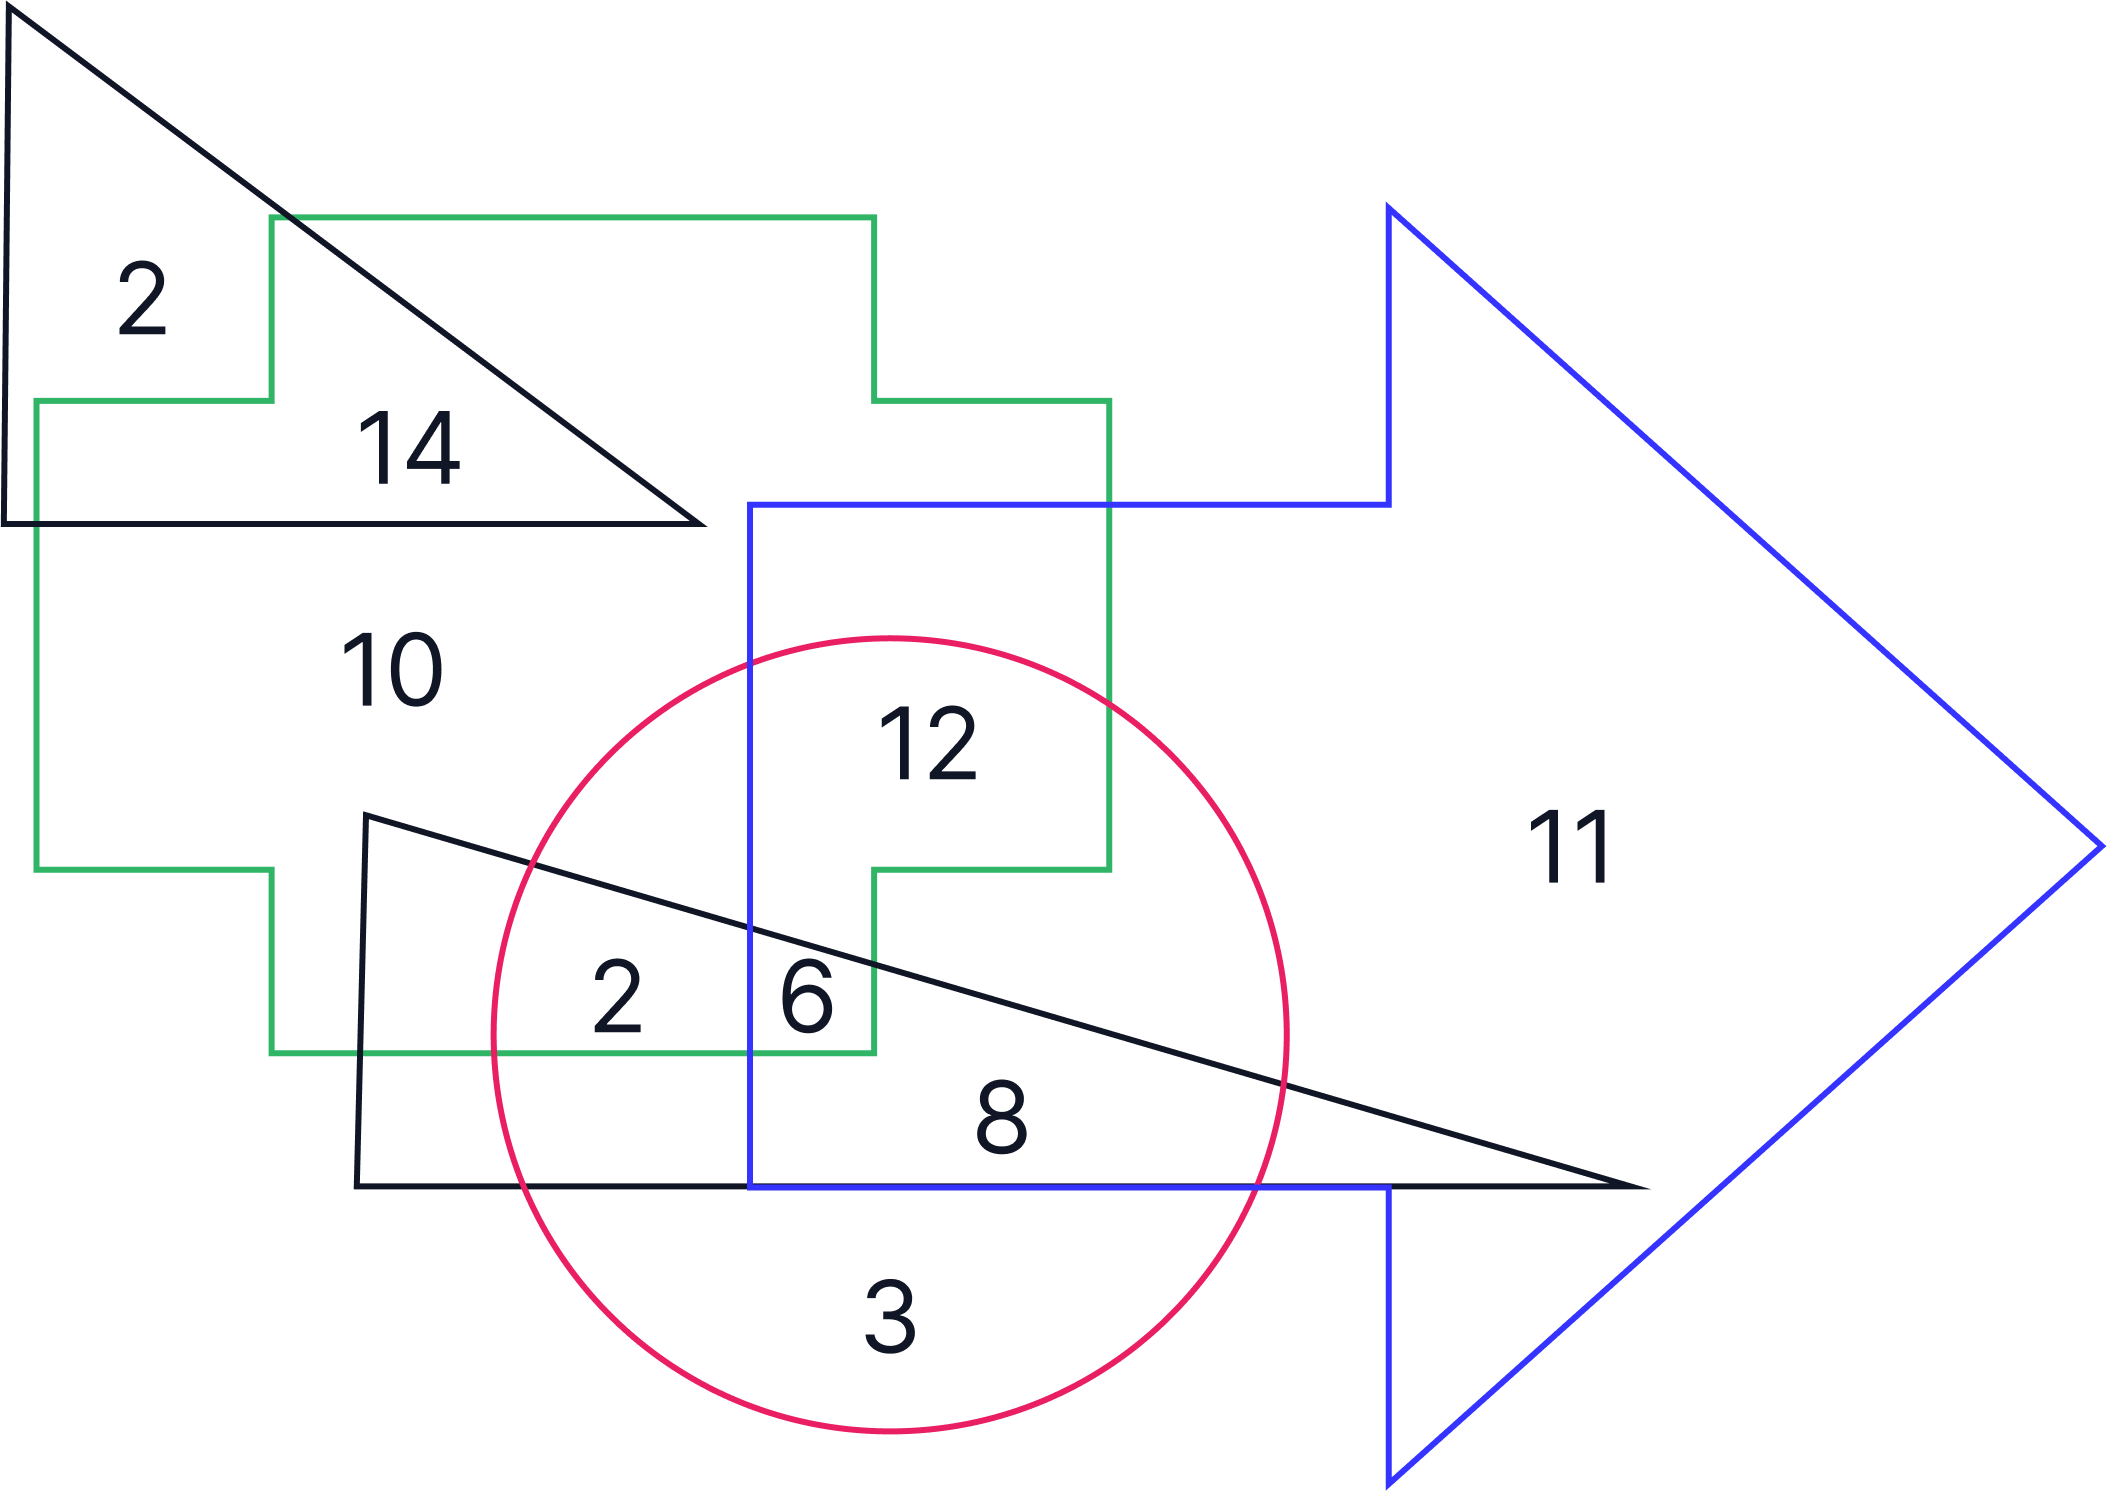
Based on the diagram, how many cars have a sunroof, leather seats and all-wheel drive but not a navigation system or hybrid engine?
A. 12
B. 13
C. 6
D. 8
Answer
A. 12
Worked Solution
-
When completing these questions, it is essential that you eliminate the categories which are not relevant to the question.
-
For example, in this question, we need to first eliminate the shapes representing a navigation system or hybrid engine.
-
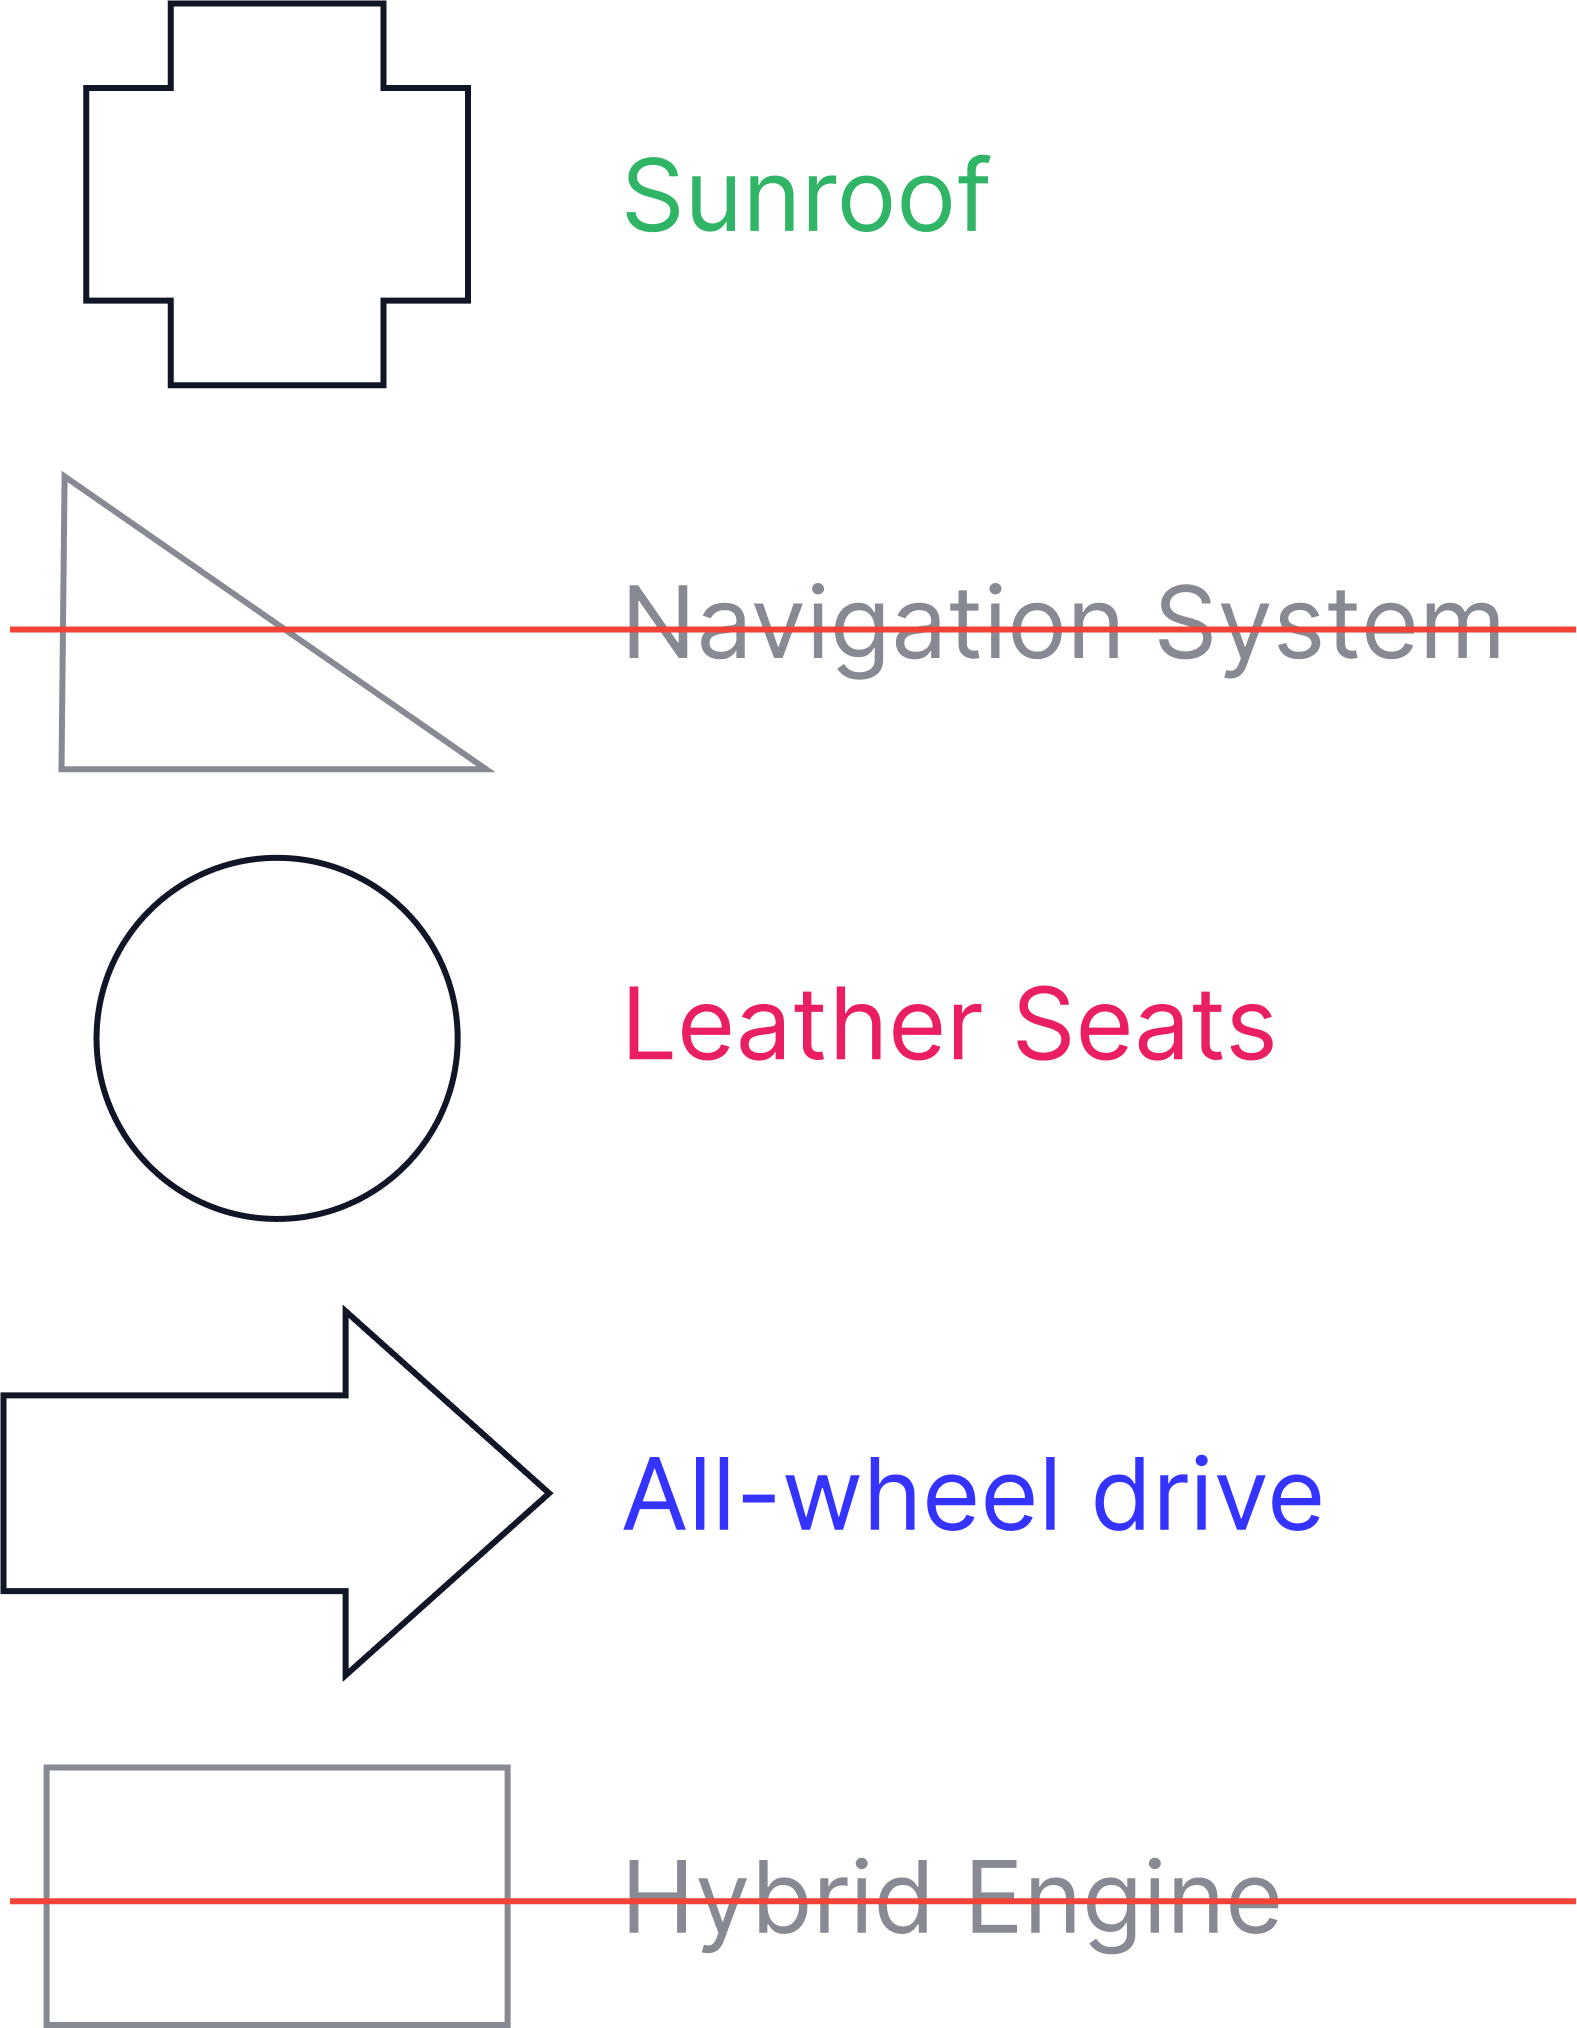
Next, we must identify the shapes which are important to us which have been highlighted below:
-
As the question uses the word ‘and’ we are looking for the area on the Venn diagram where these shapes overlap, which is circled below:
-
Therefore, the correct answer is A - 12
Question 2 - Medium
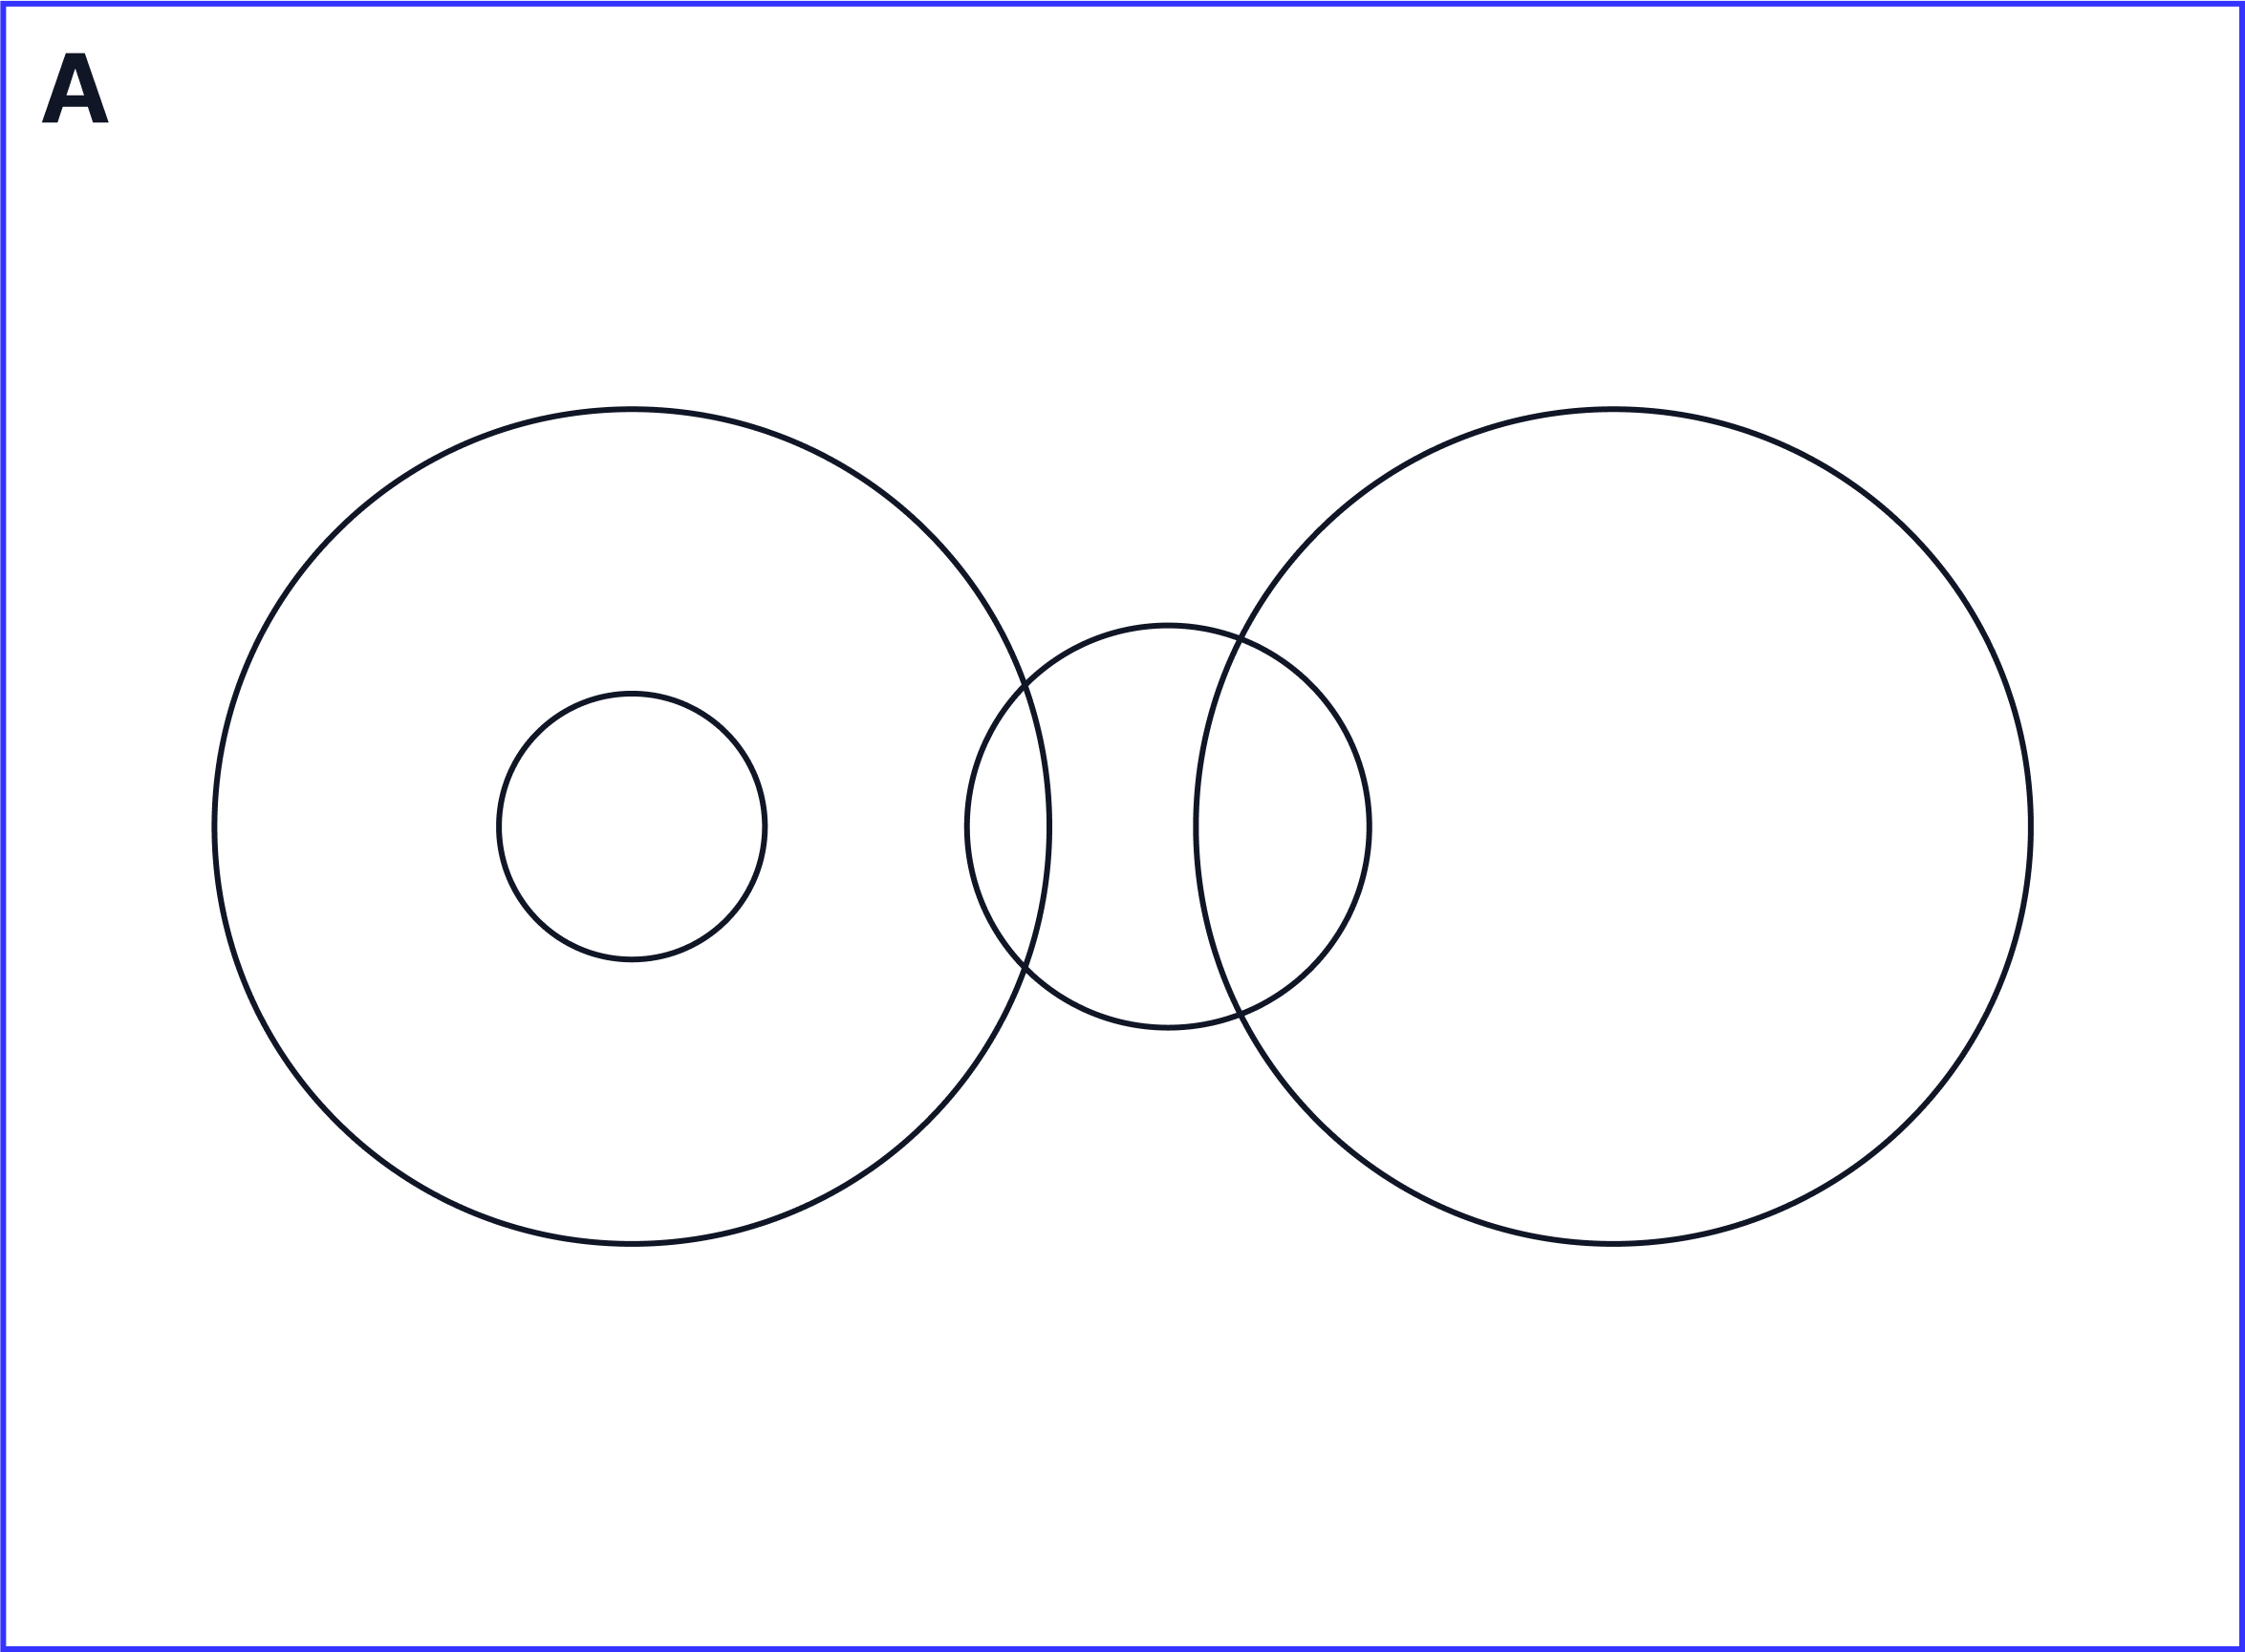
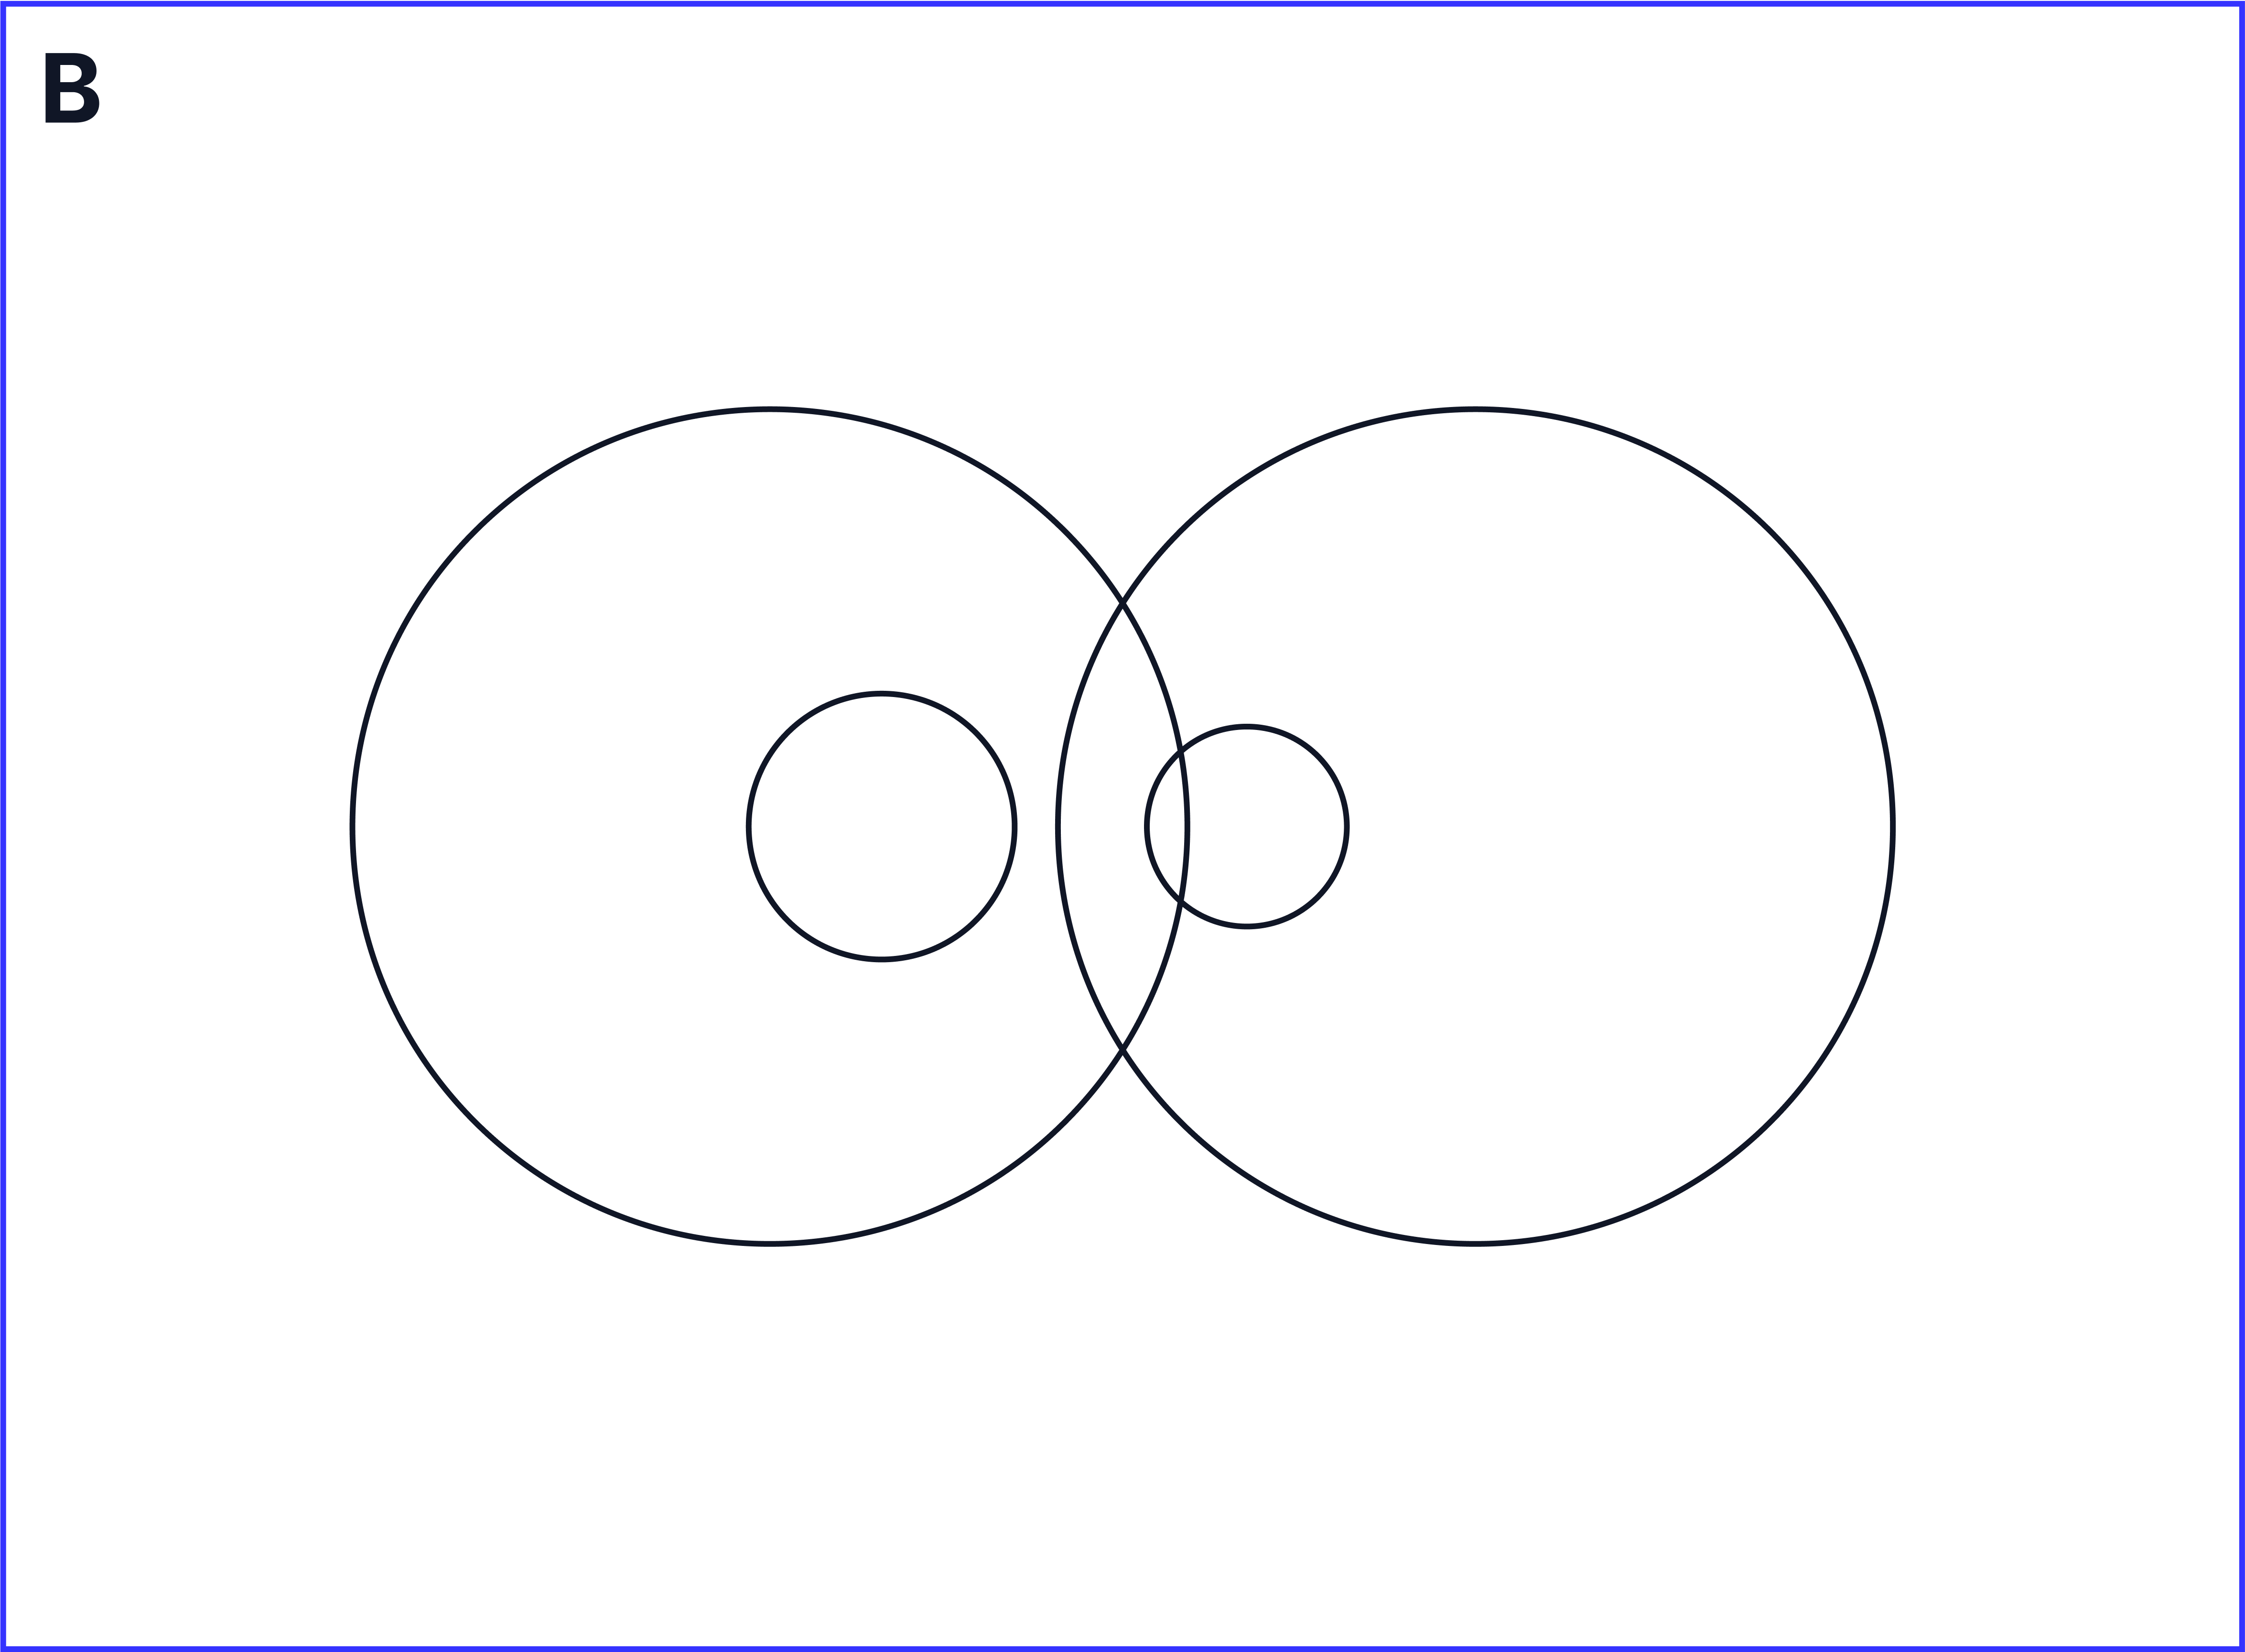
If the statements ‘all cats are mammals’, ‘no cats are reptiles’, ‘some mammals are reptiles’ and ‘all snakes are reptiles’ are true.
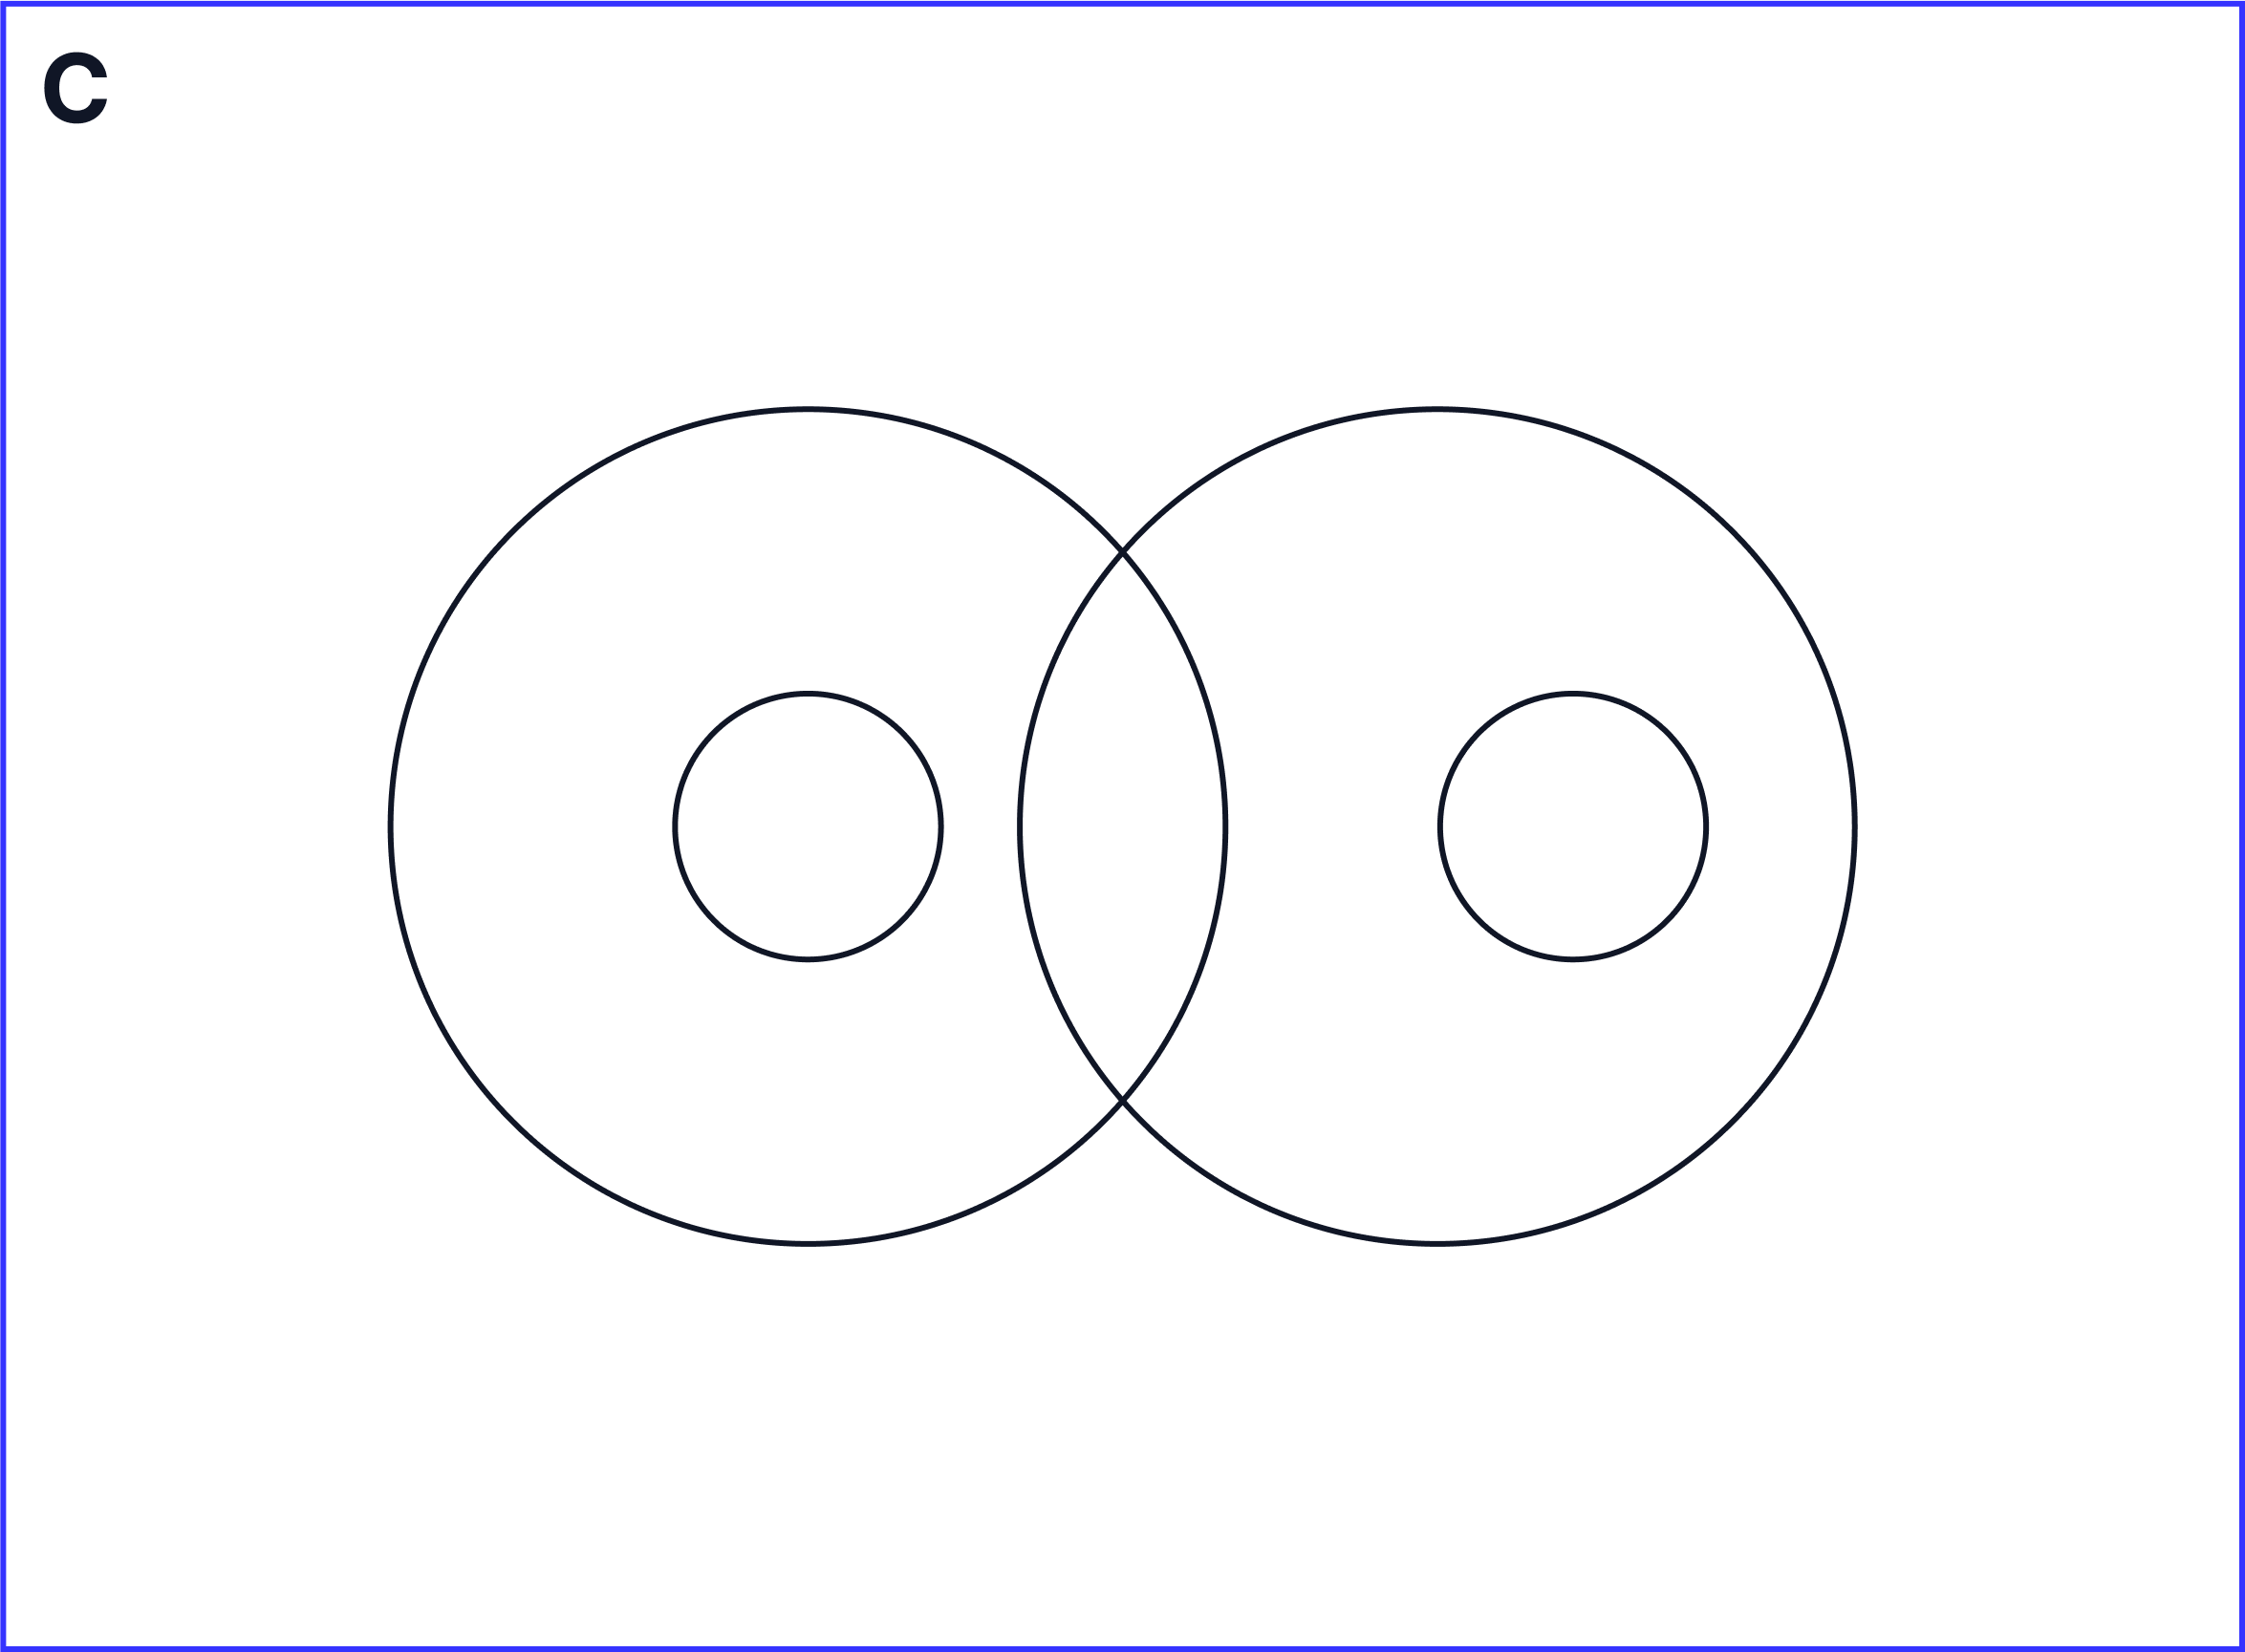
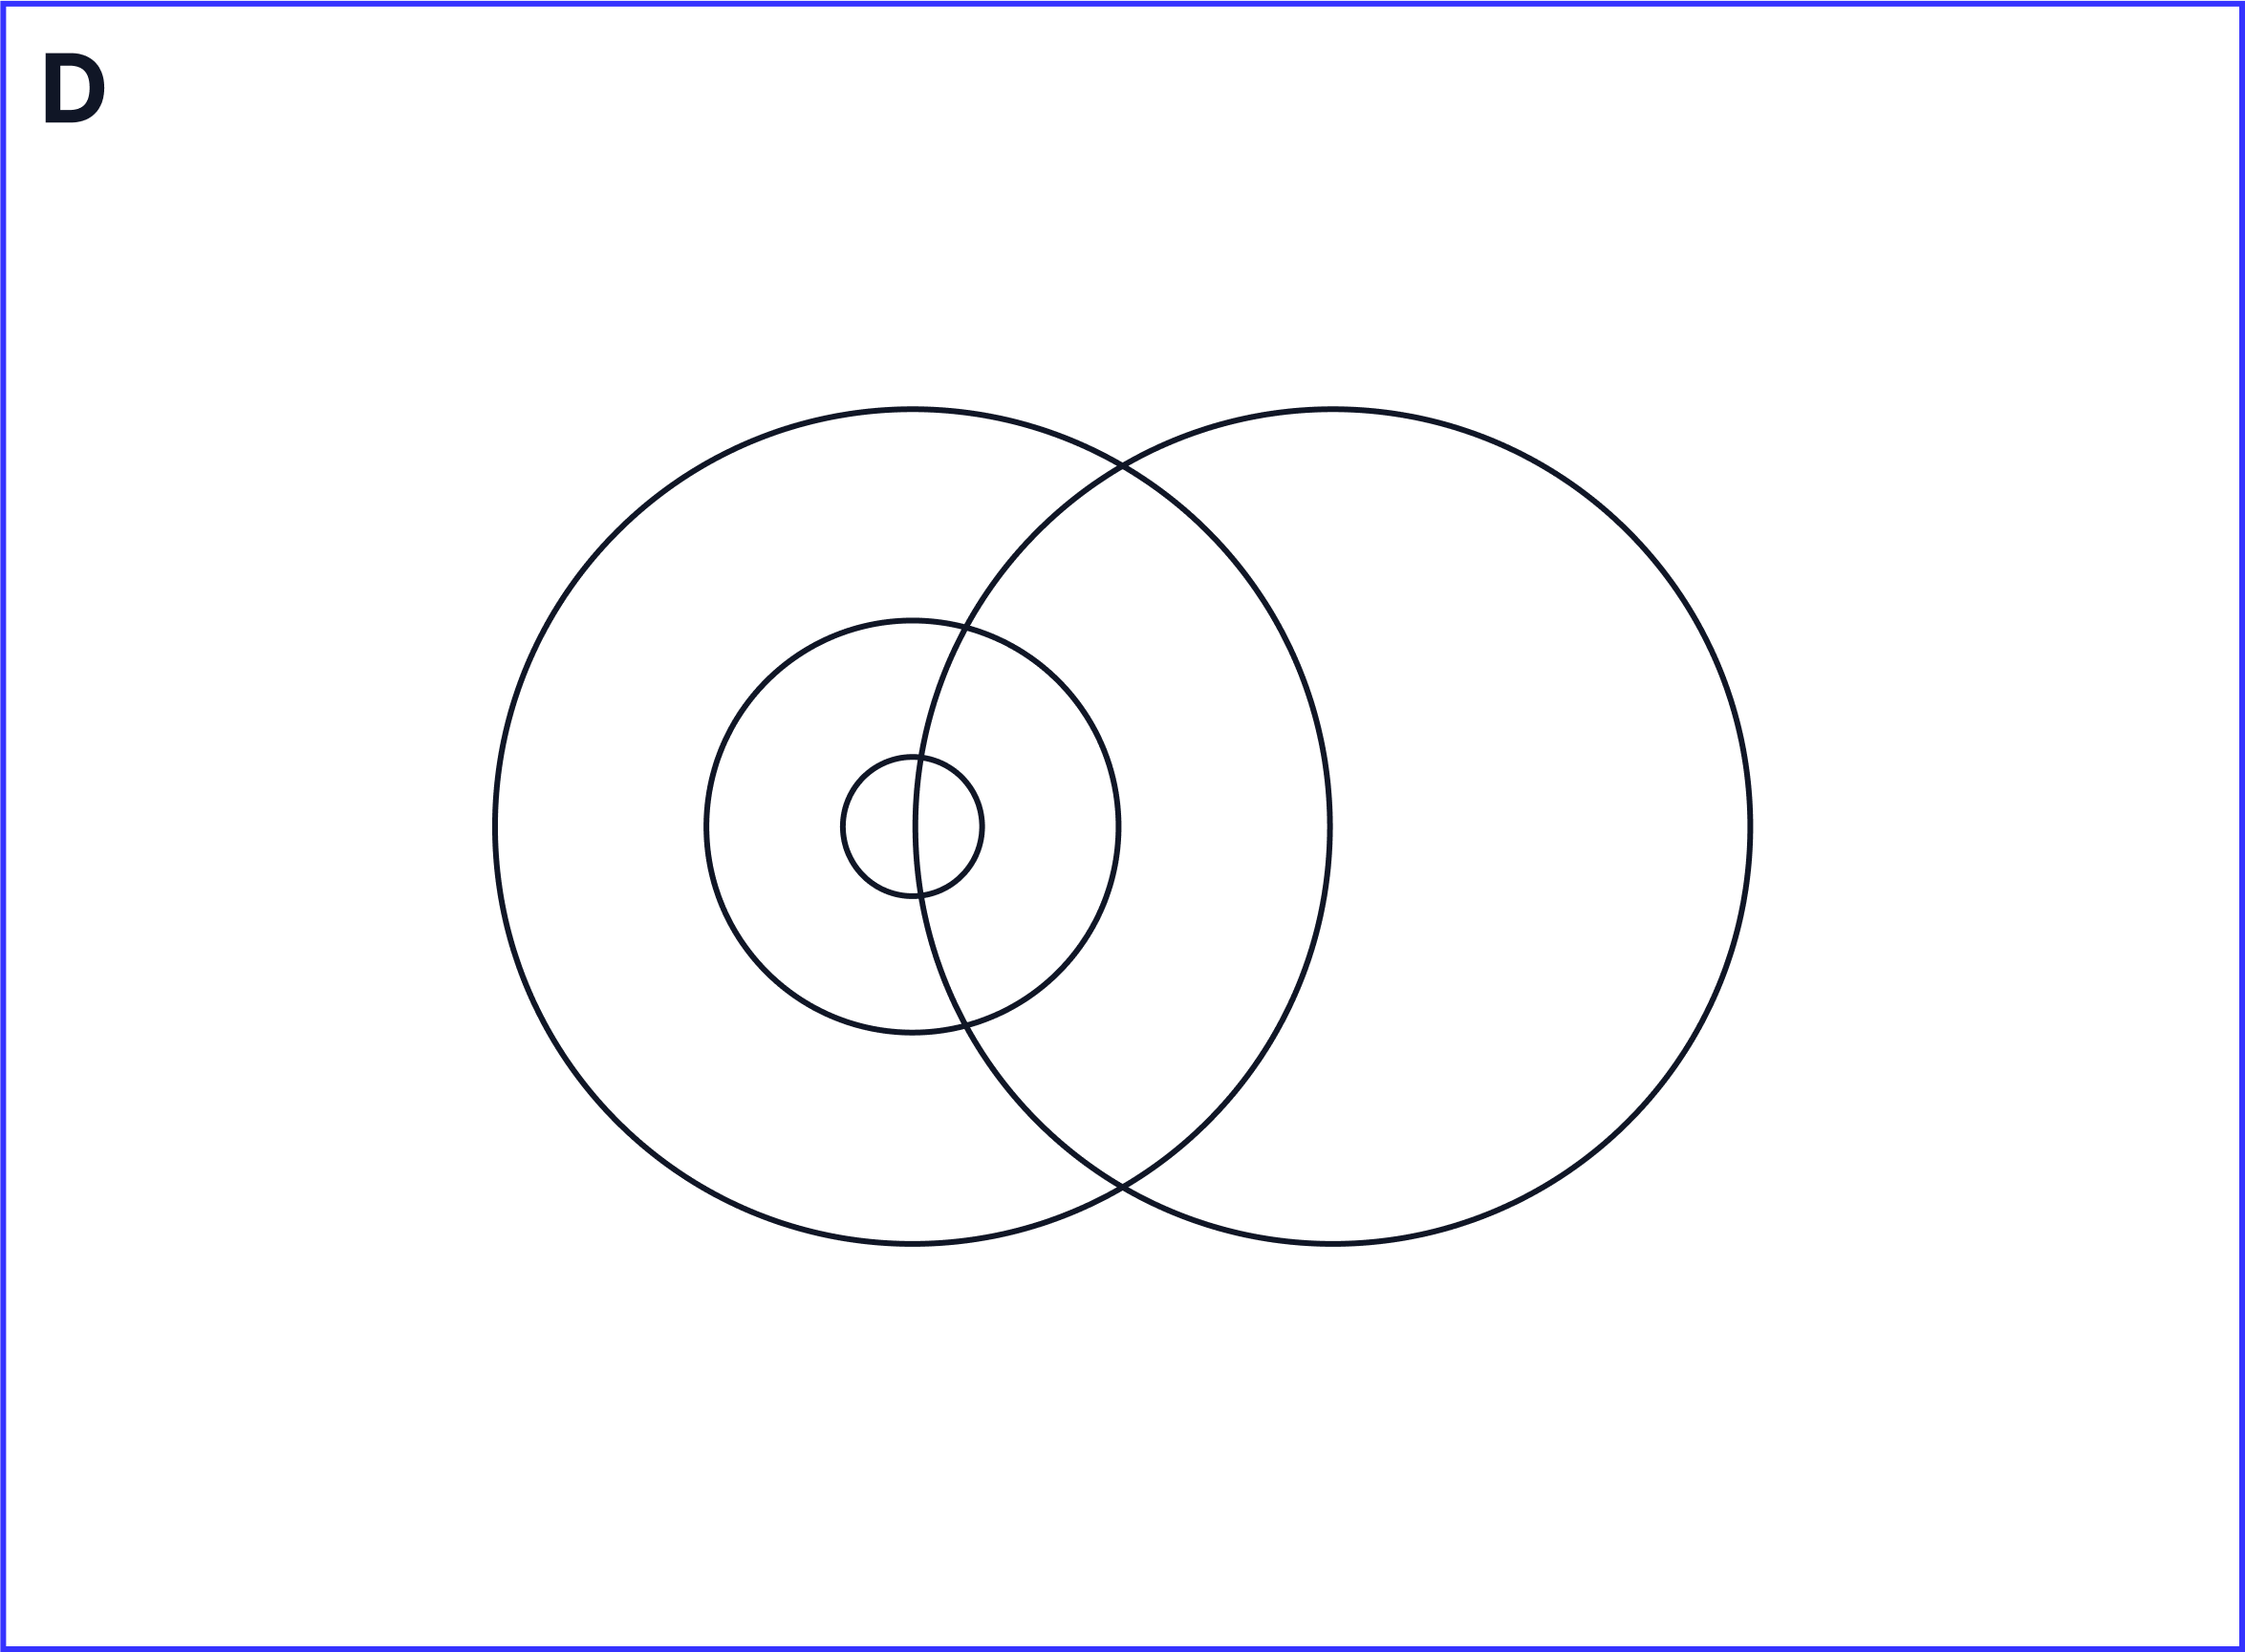
Which of the following diagrams best represents the information given?
Answer
C.
Worked Solution
-
For this question, you will need to draw your own Venn Diagram to help you decide which is the correct answer.
-
Firstly, we will break down the question into each of the statements which are the following:
-
All cats are mammals
-
No cats are reptiles
-
Some mammals are reptiles
-
All snakes are reptiles
-
-
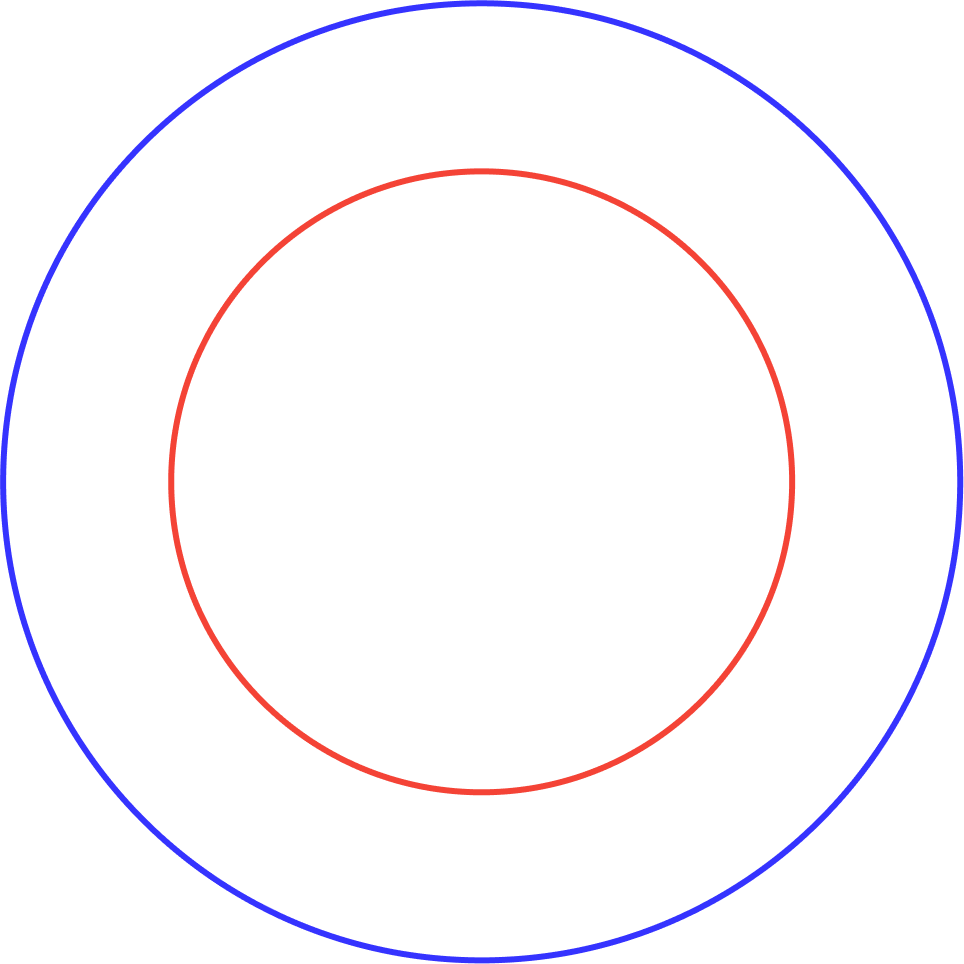
For the first statement - all cats are mammals, we would draw a circle enclosed in another circle, as 100% cats (red) are mammals (blue) which would look like this:
-
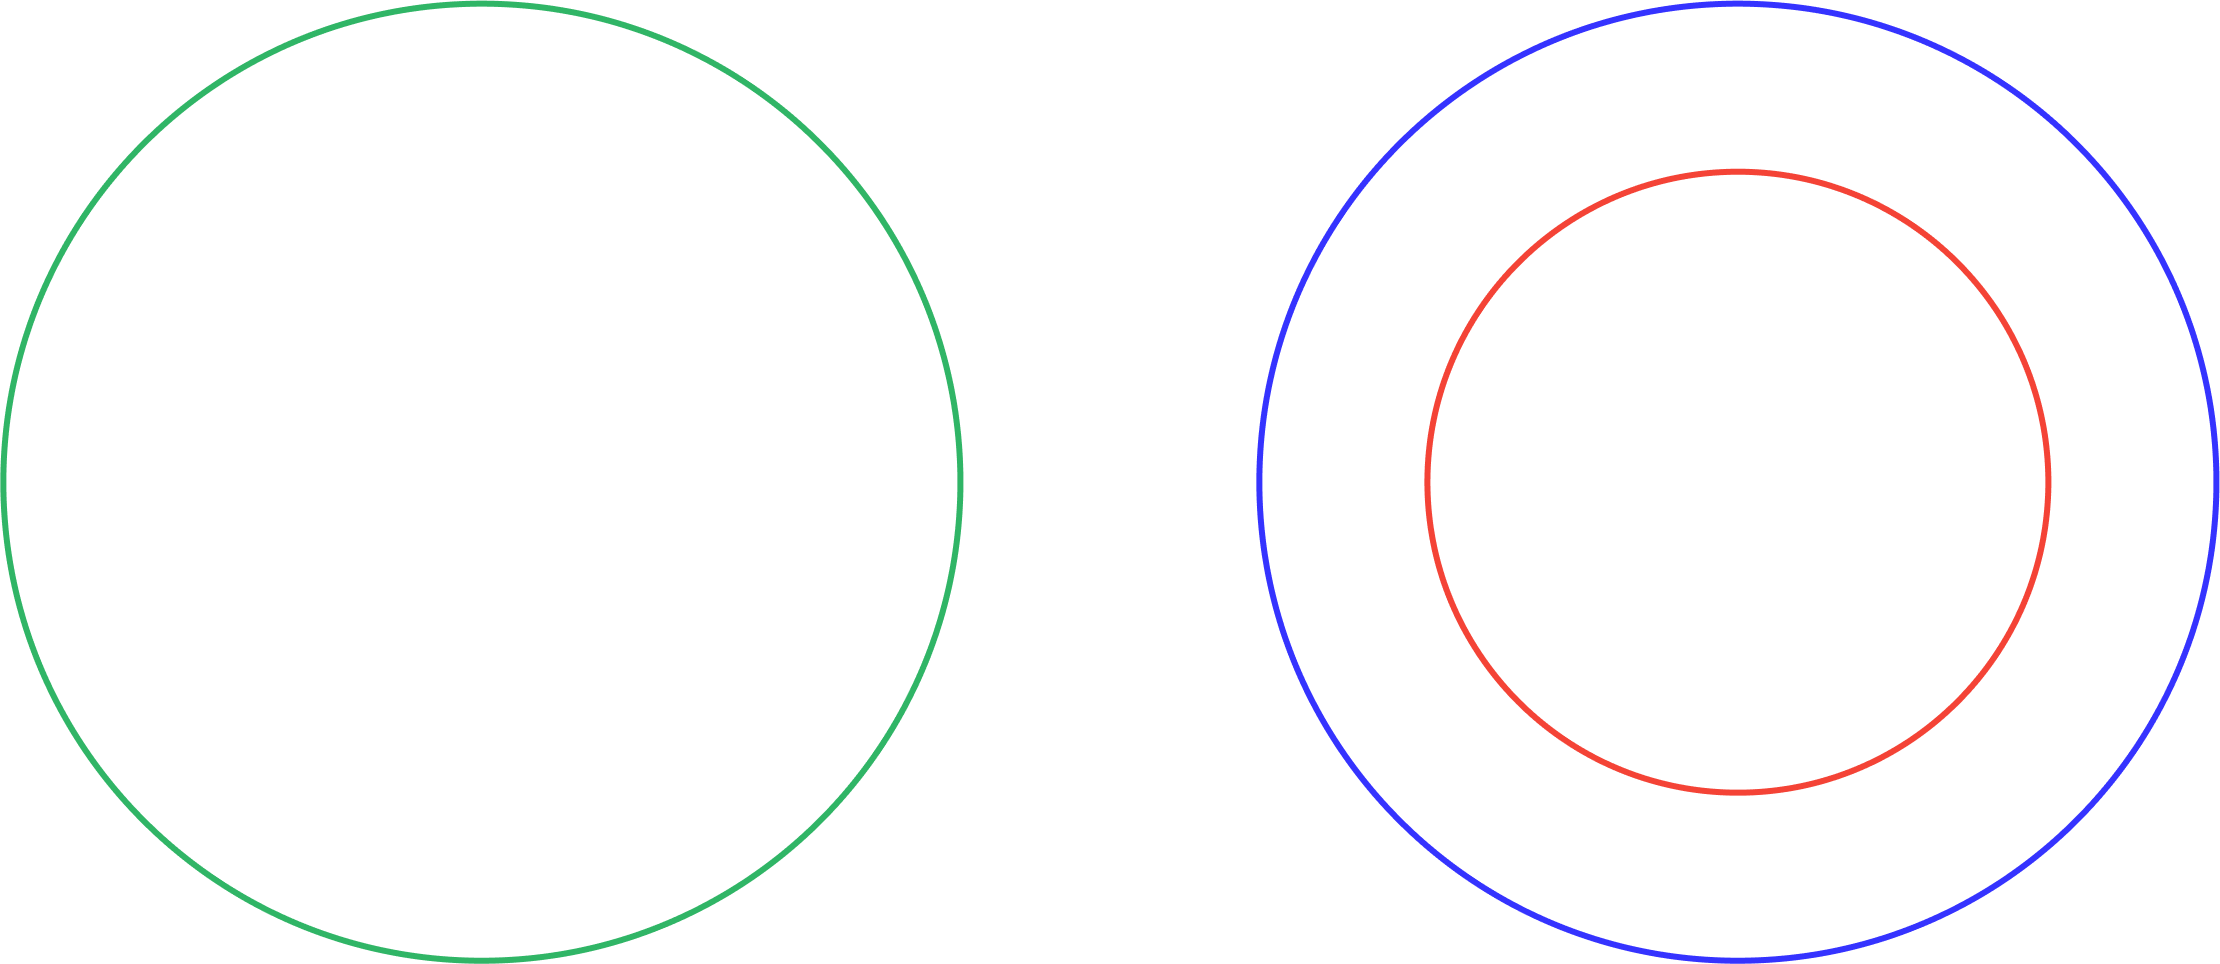
For the second statement - no cats are reptiles, there would be no overlap between the reptiles (green) and cats (red), as 0% of cats are reptiles which would look like this:
-
For the third statement - some mammals are reptiles, there would be some overlap between mammals (blue) and reptiles (green) therefore, our Venn diagram will now look like this:
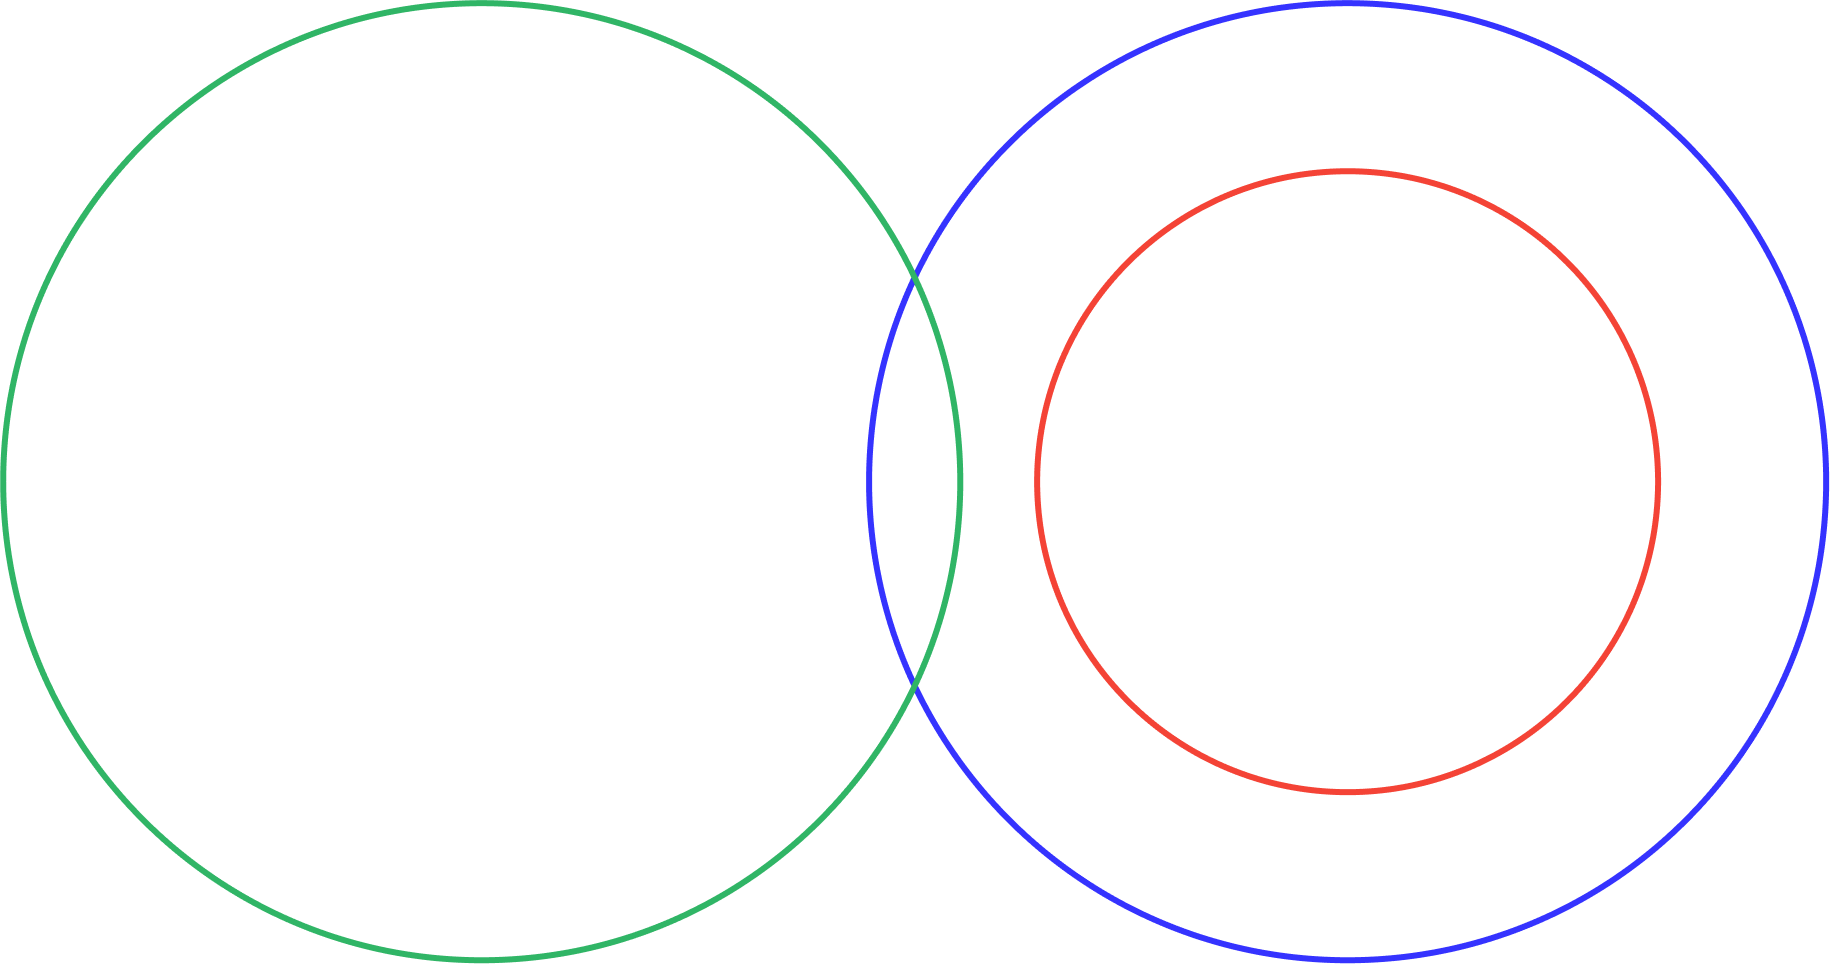
-
For the fourth statement - all snakes are reptiles , the ‘snake circle’ would be completely enclosed by the reptile circle, as 100% of snakes (orange) are reptiles (green) which means our final Venn diagram would look like this:
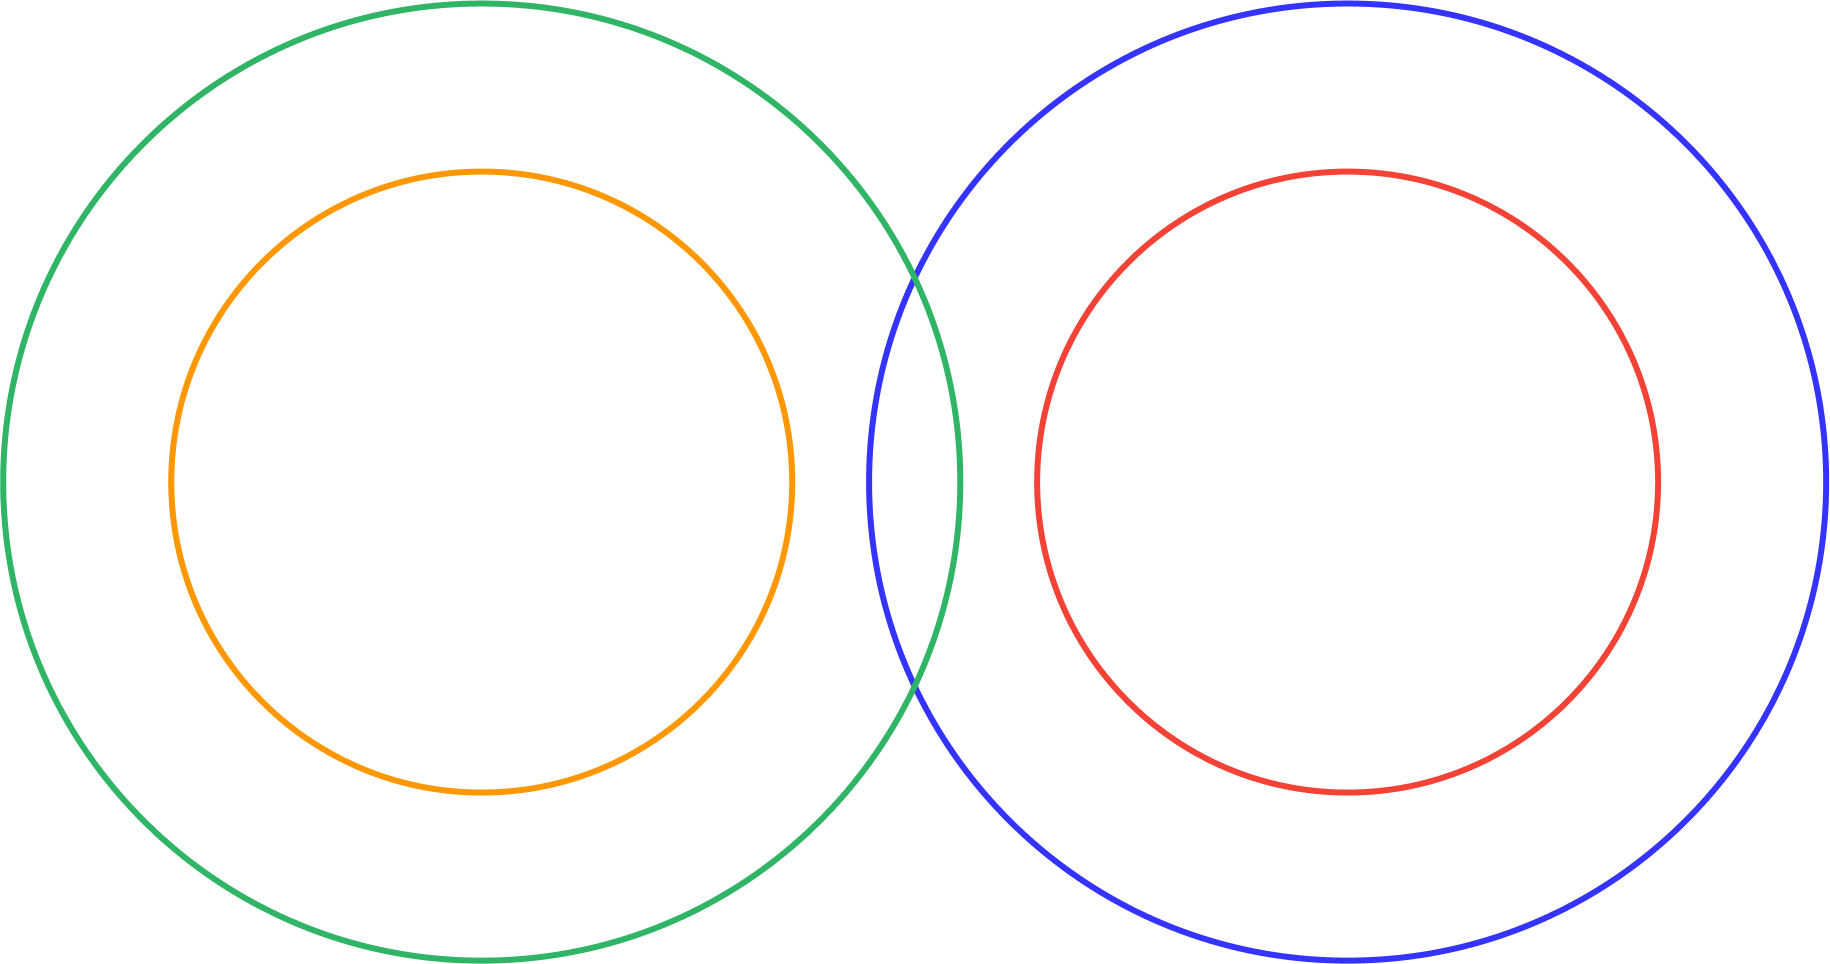
-
The Venn diagram which looks closest to this, is option C.
Question 3 - Hard
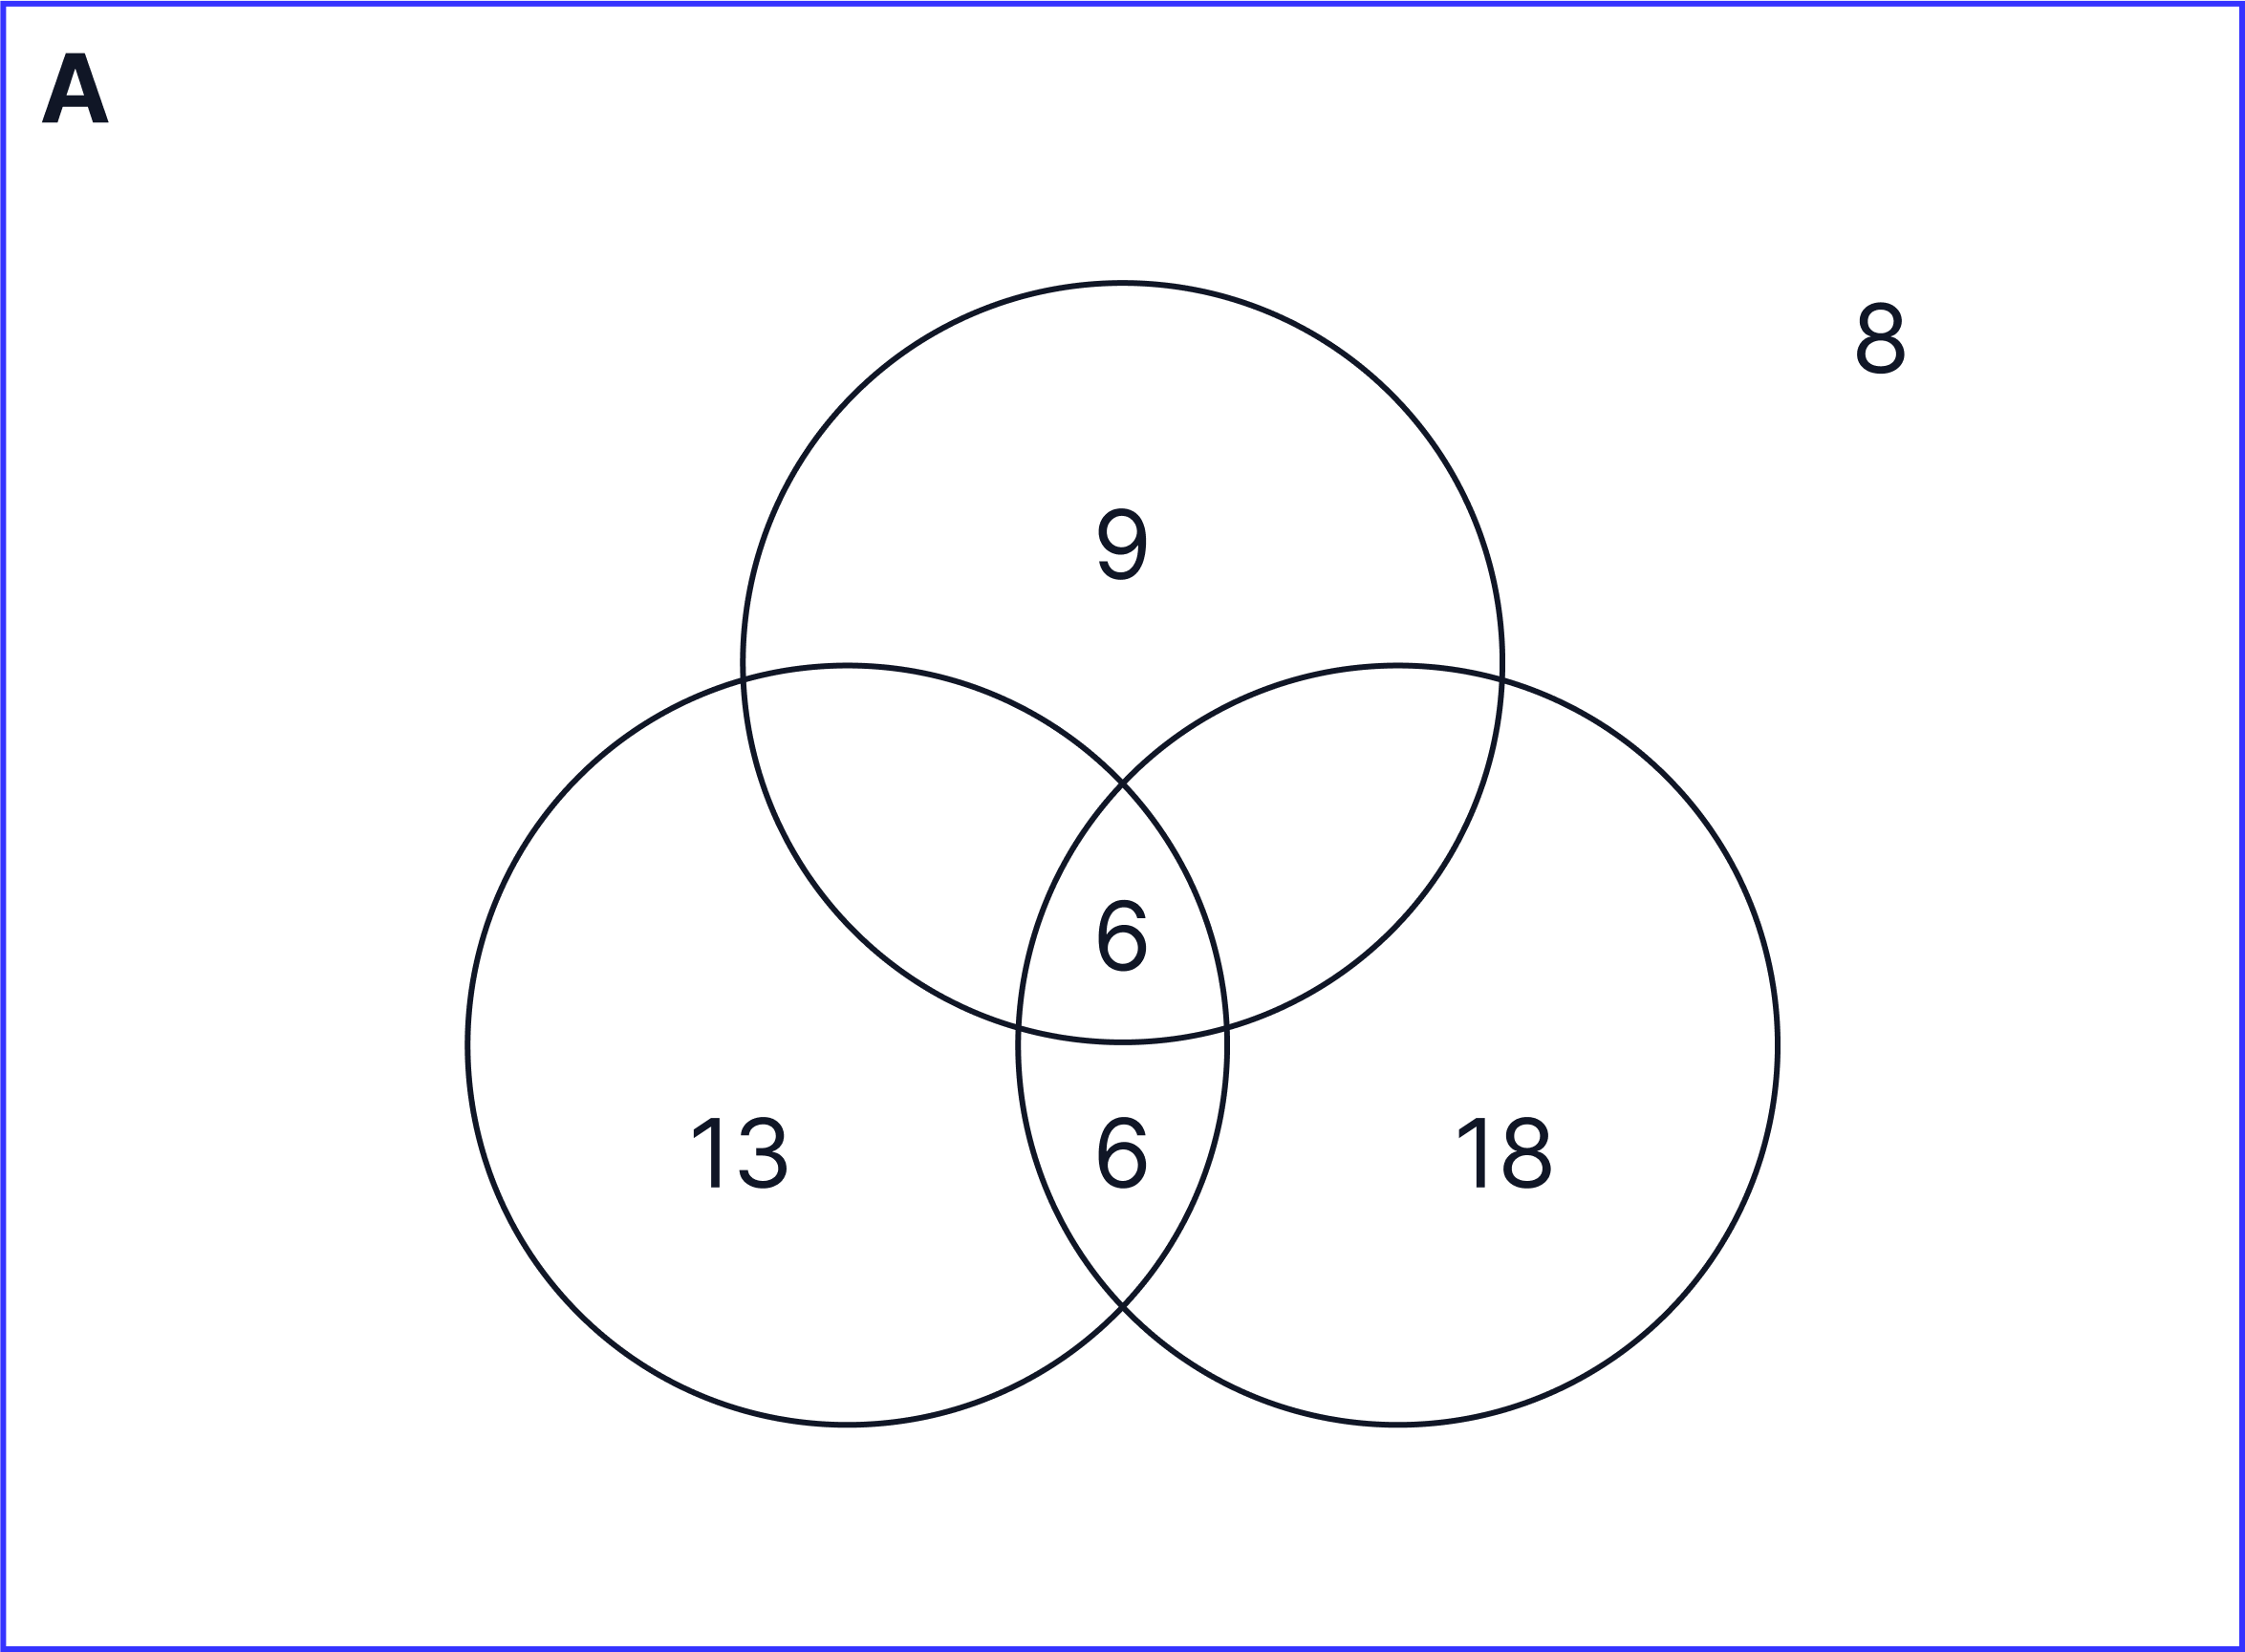
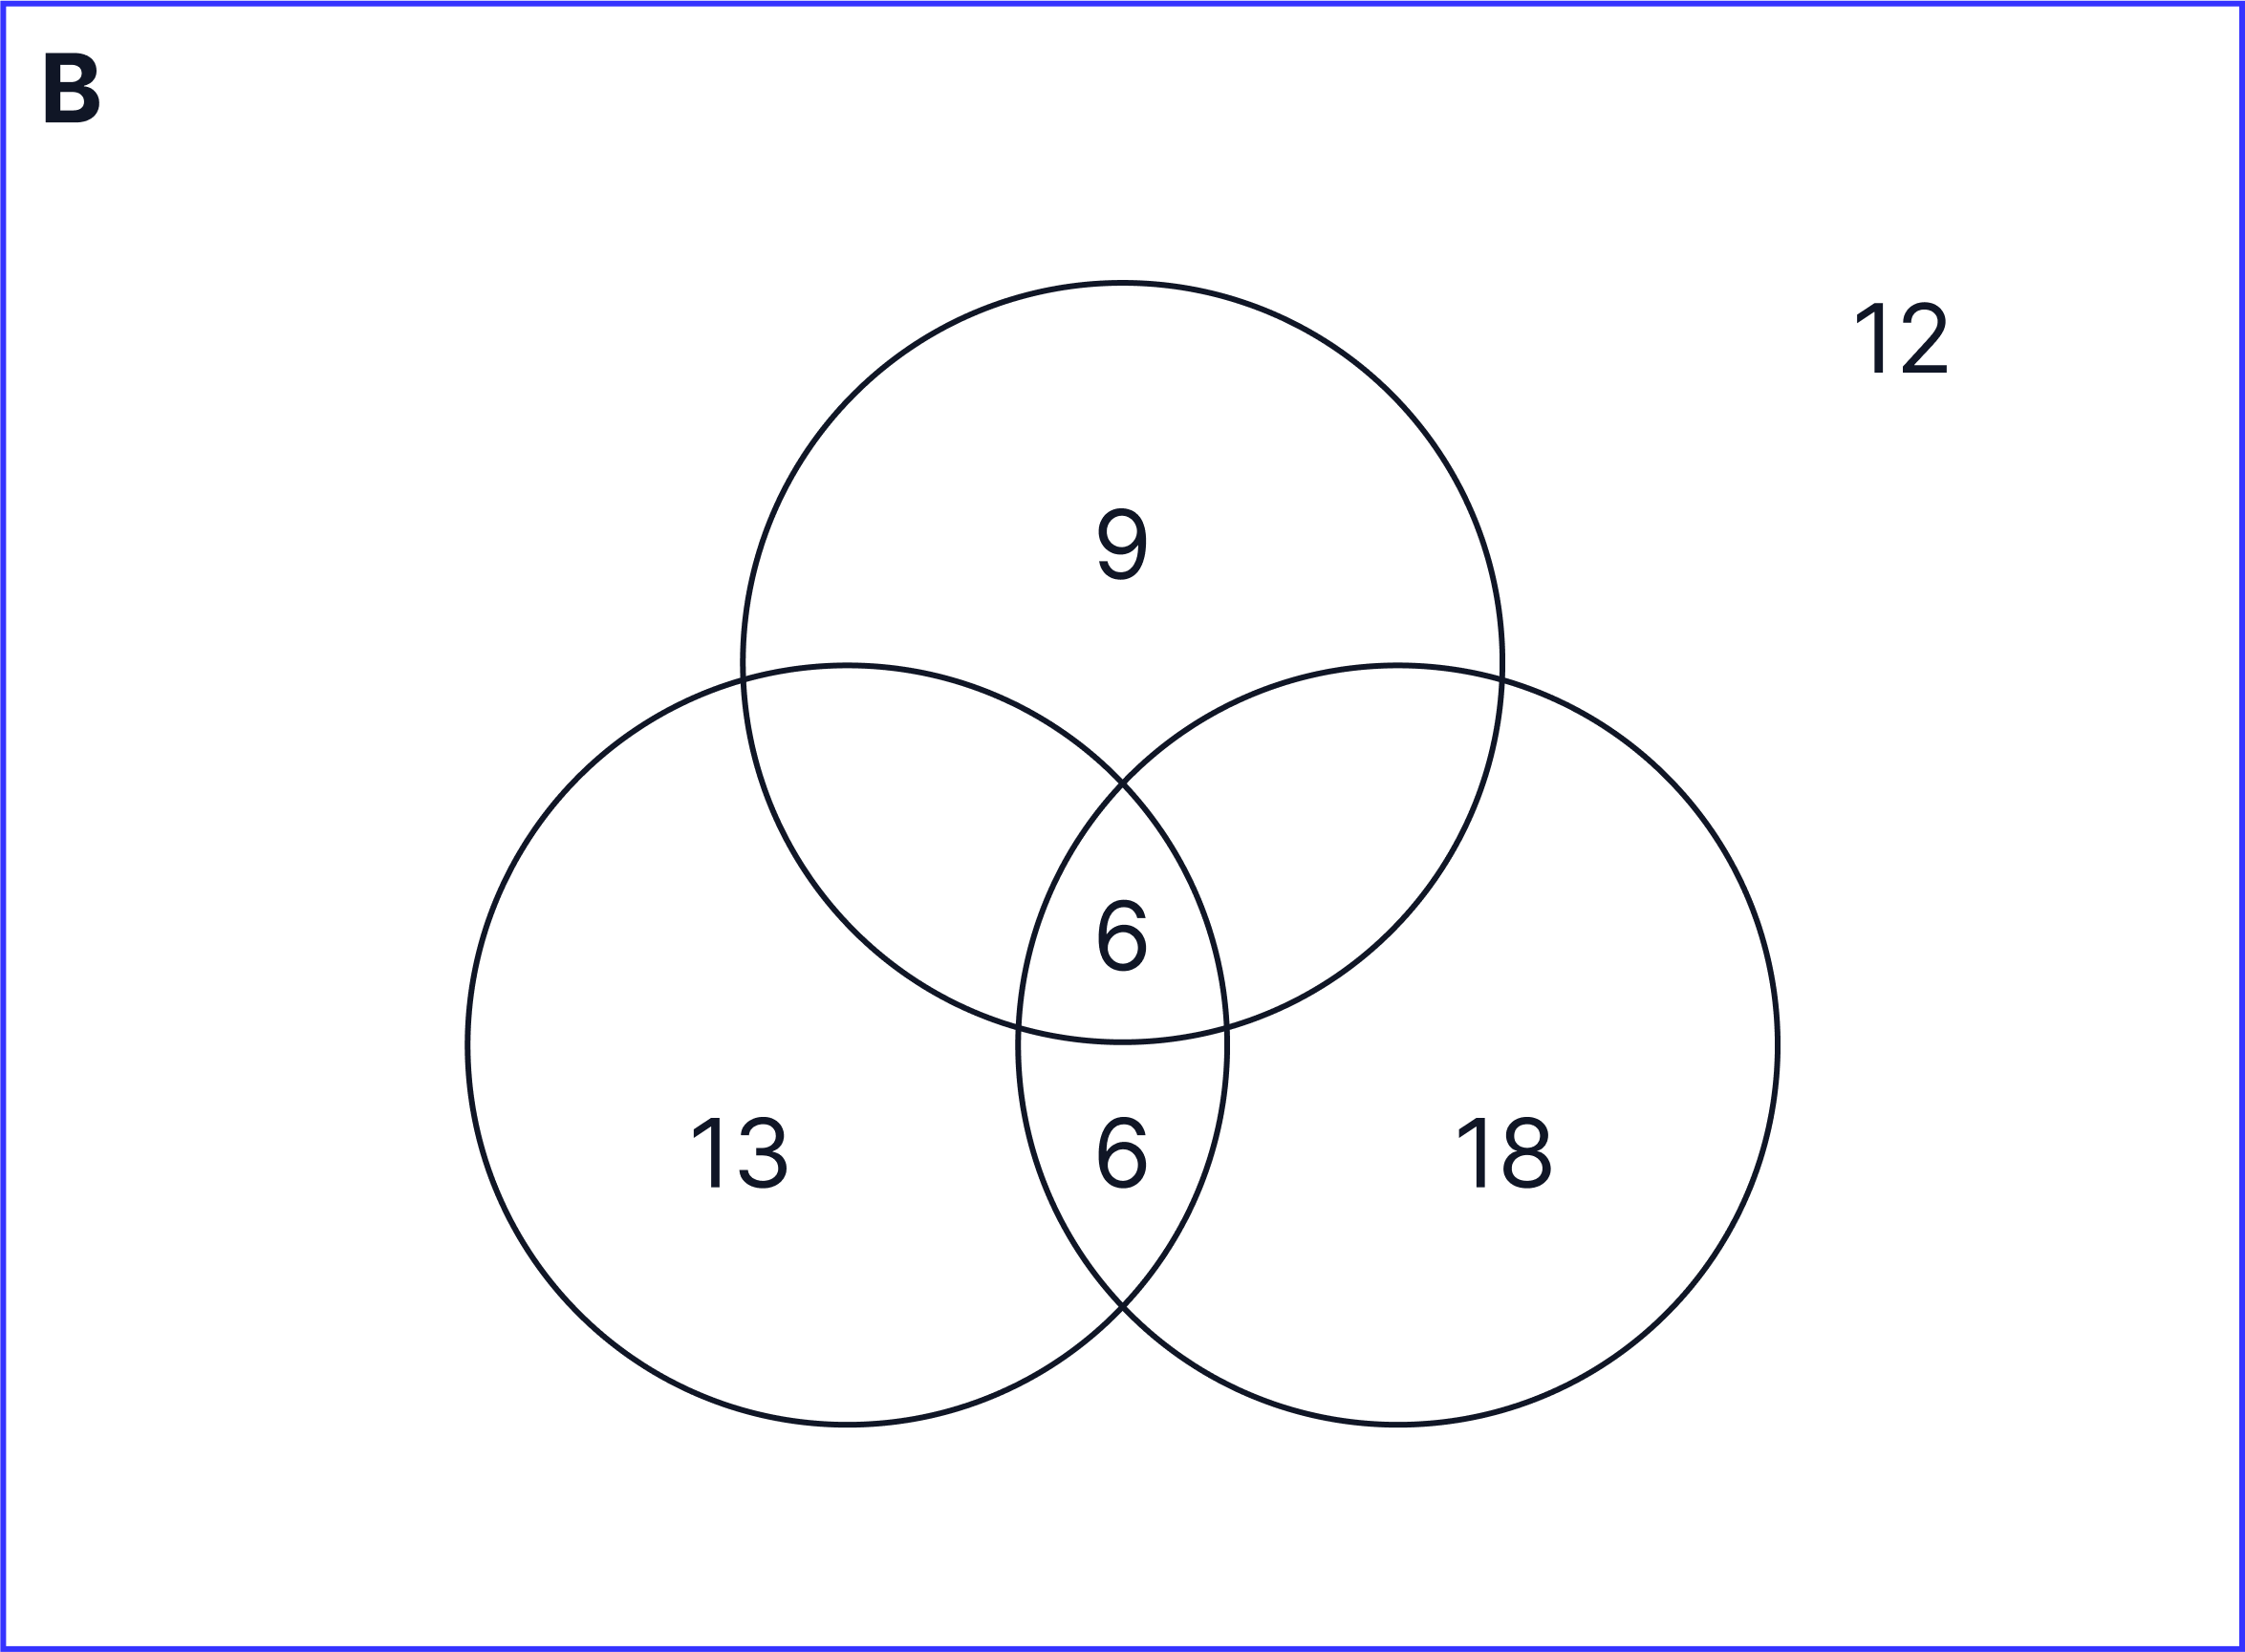
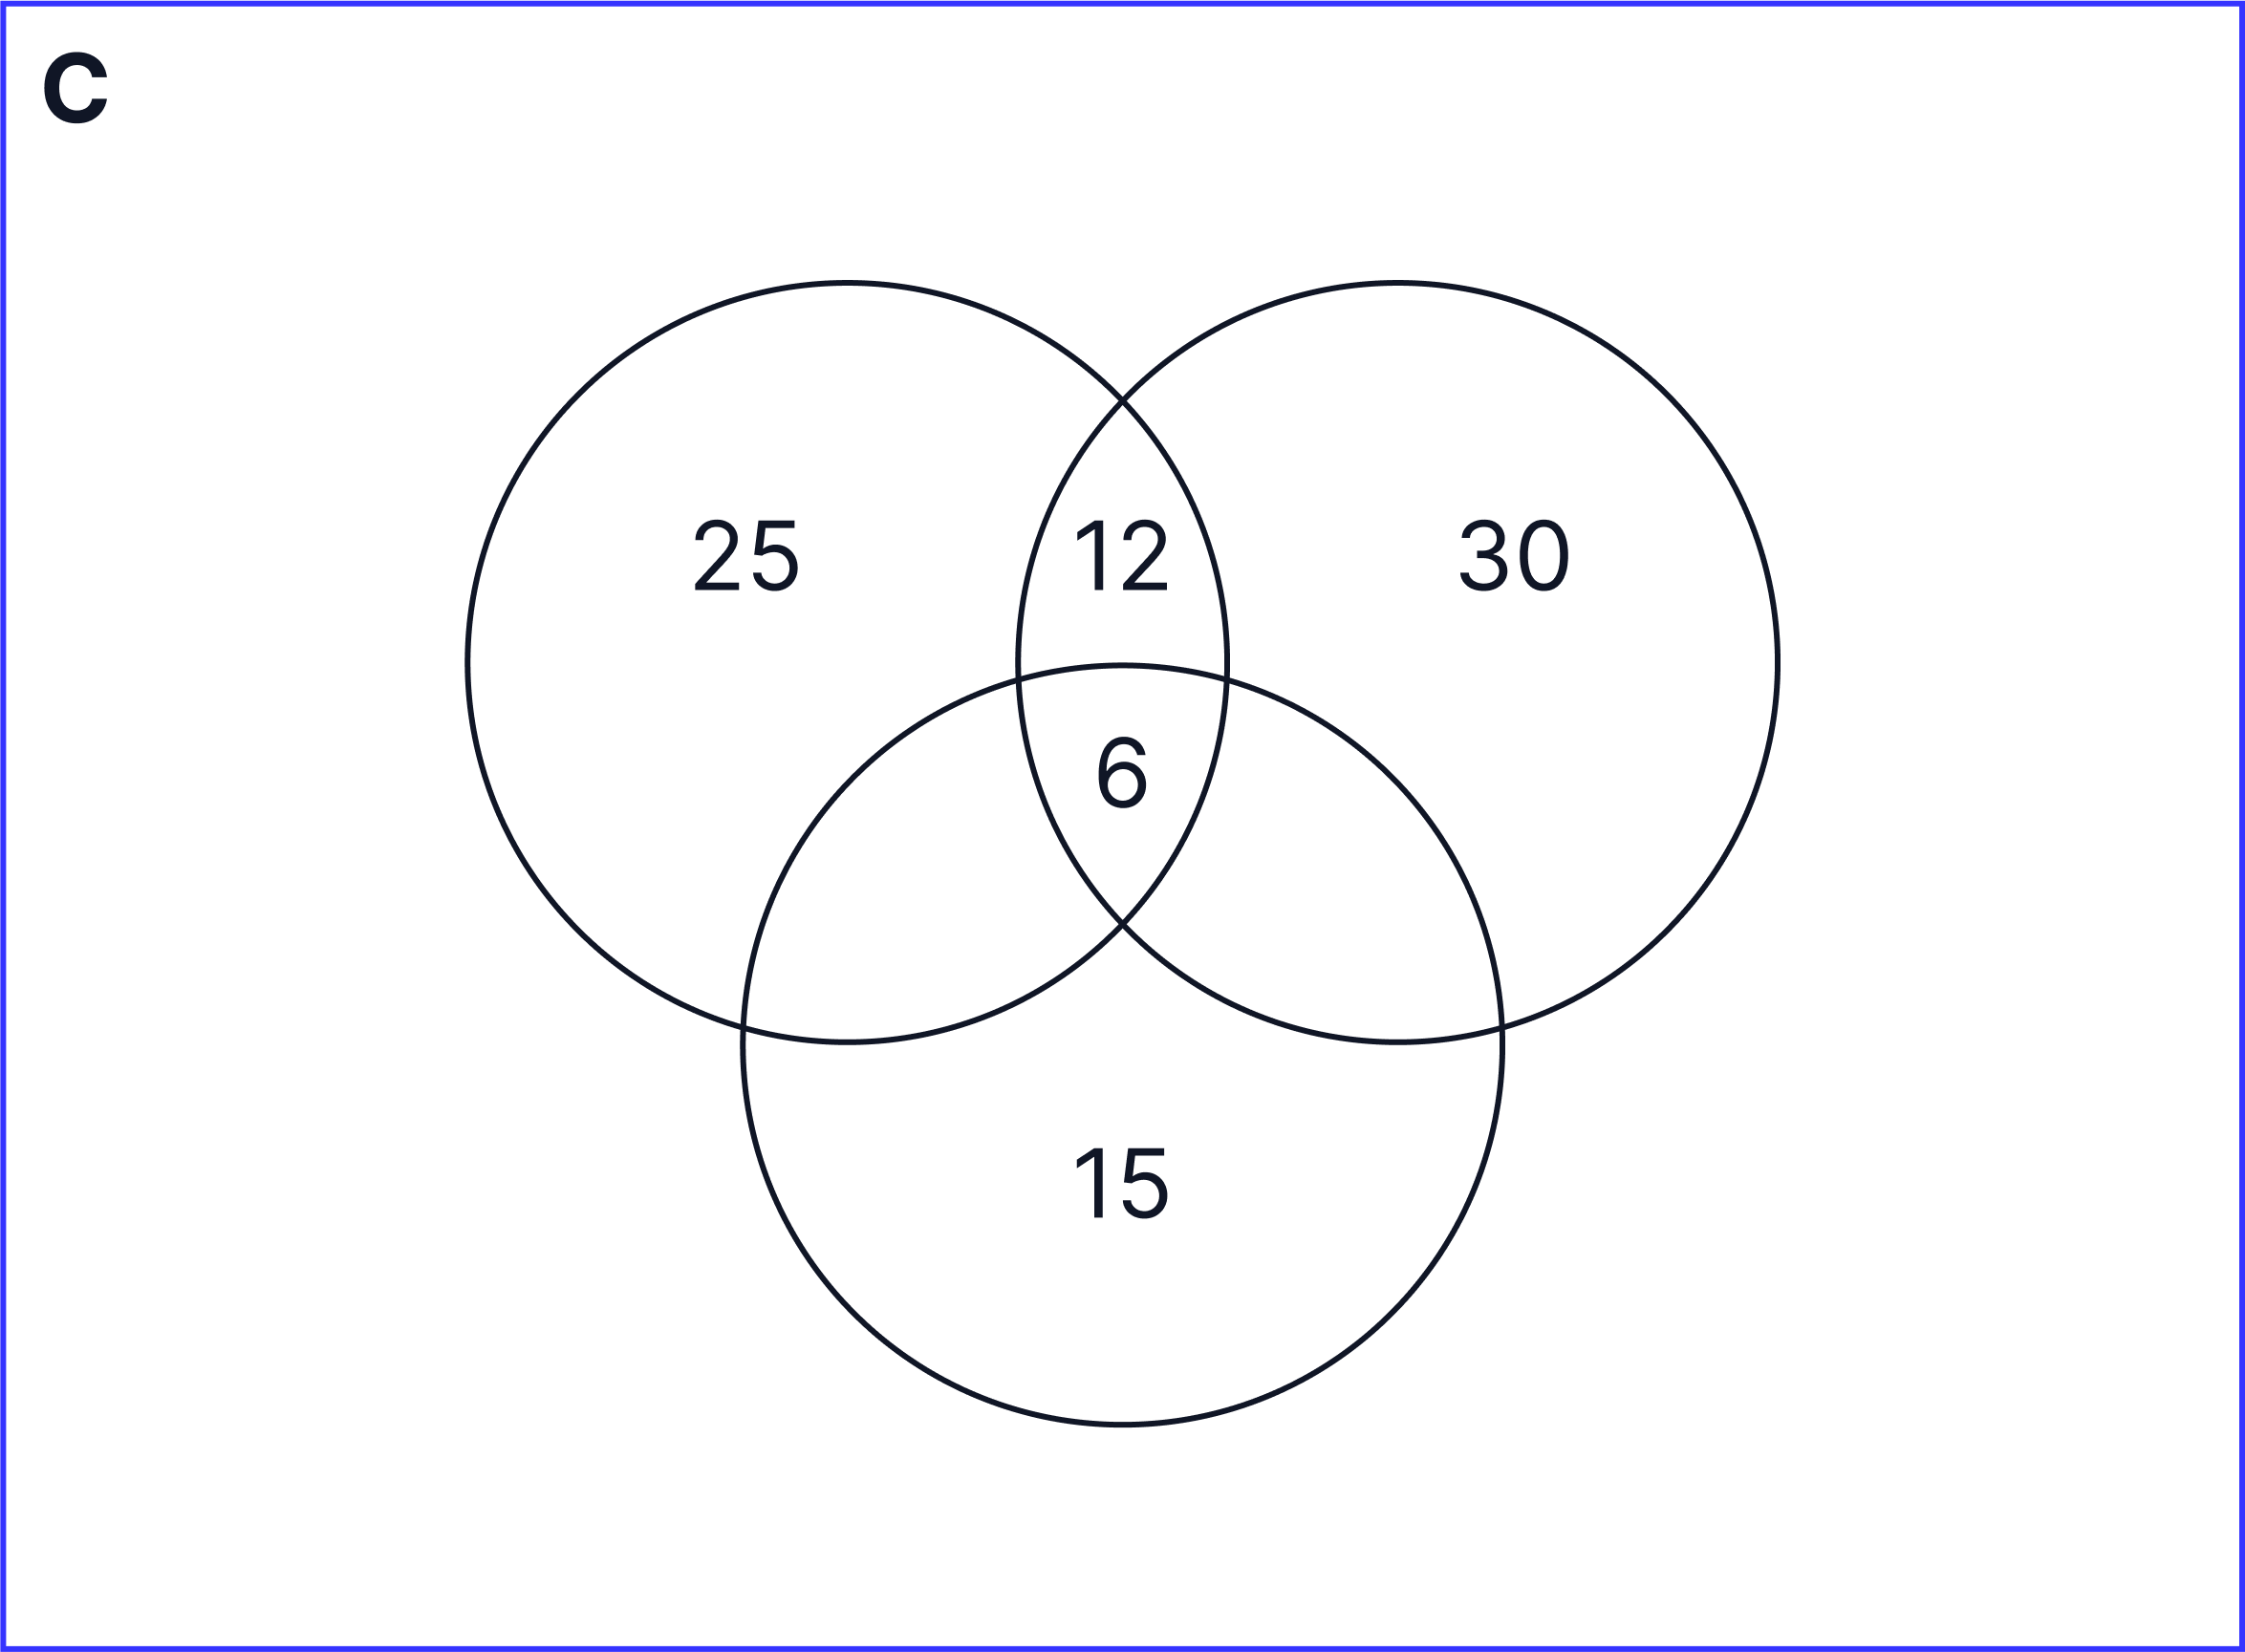
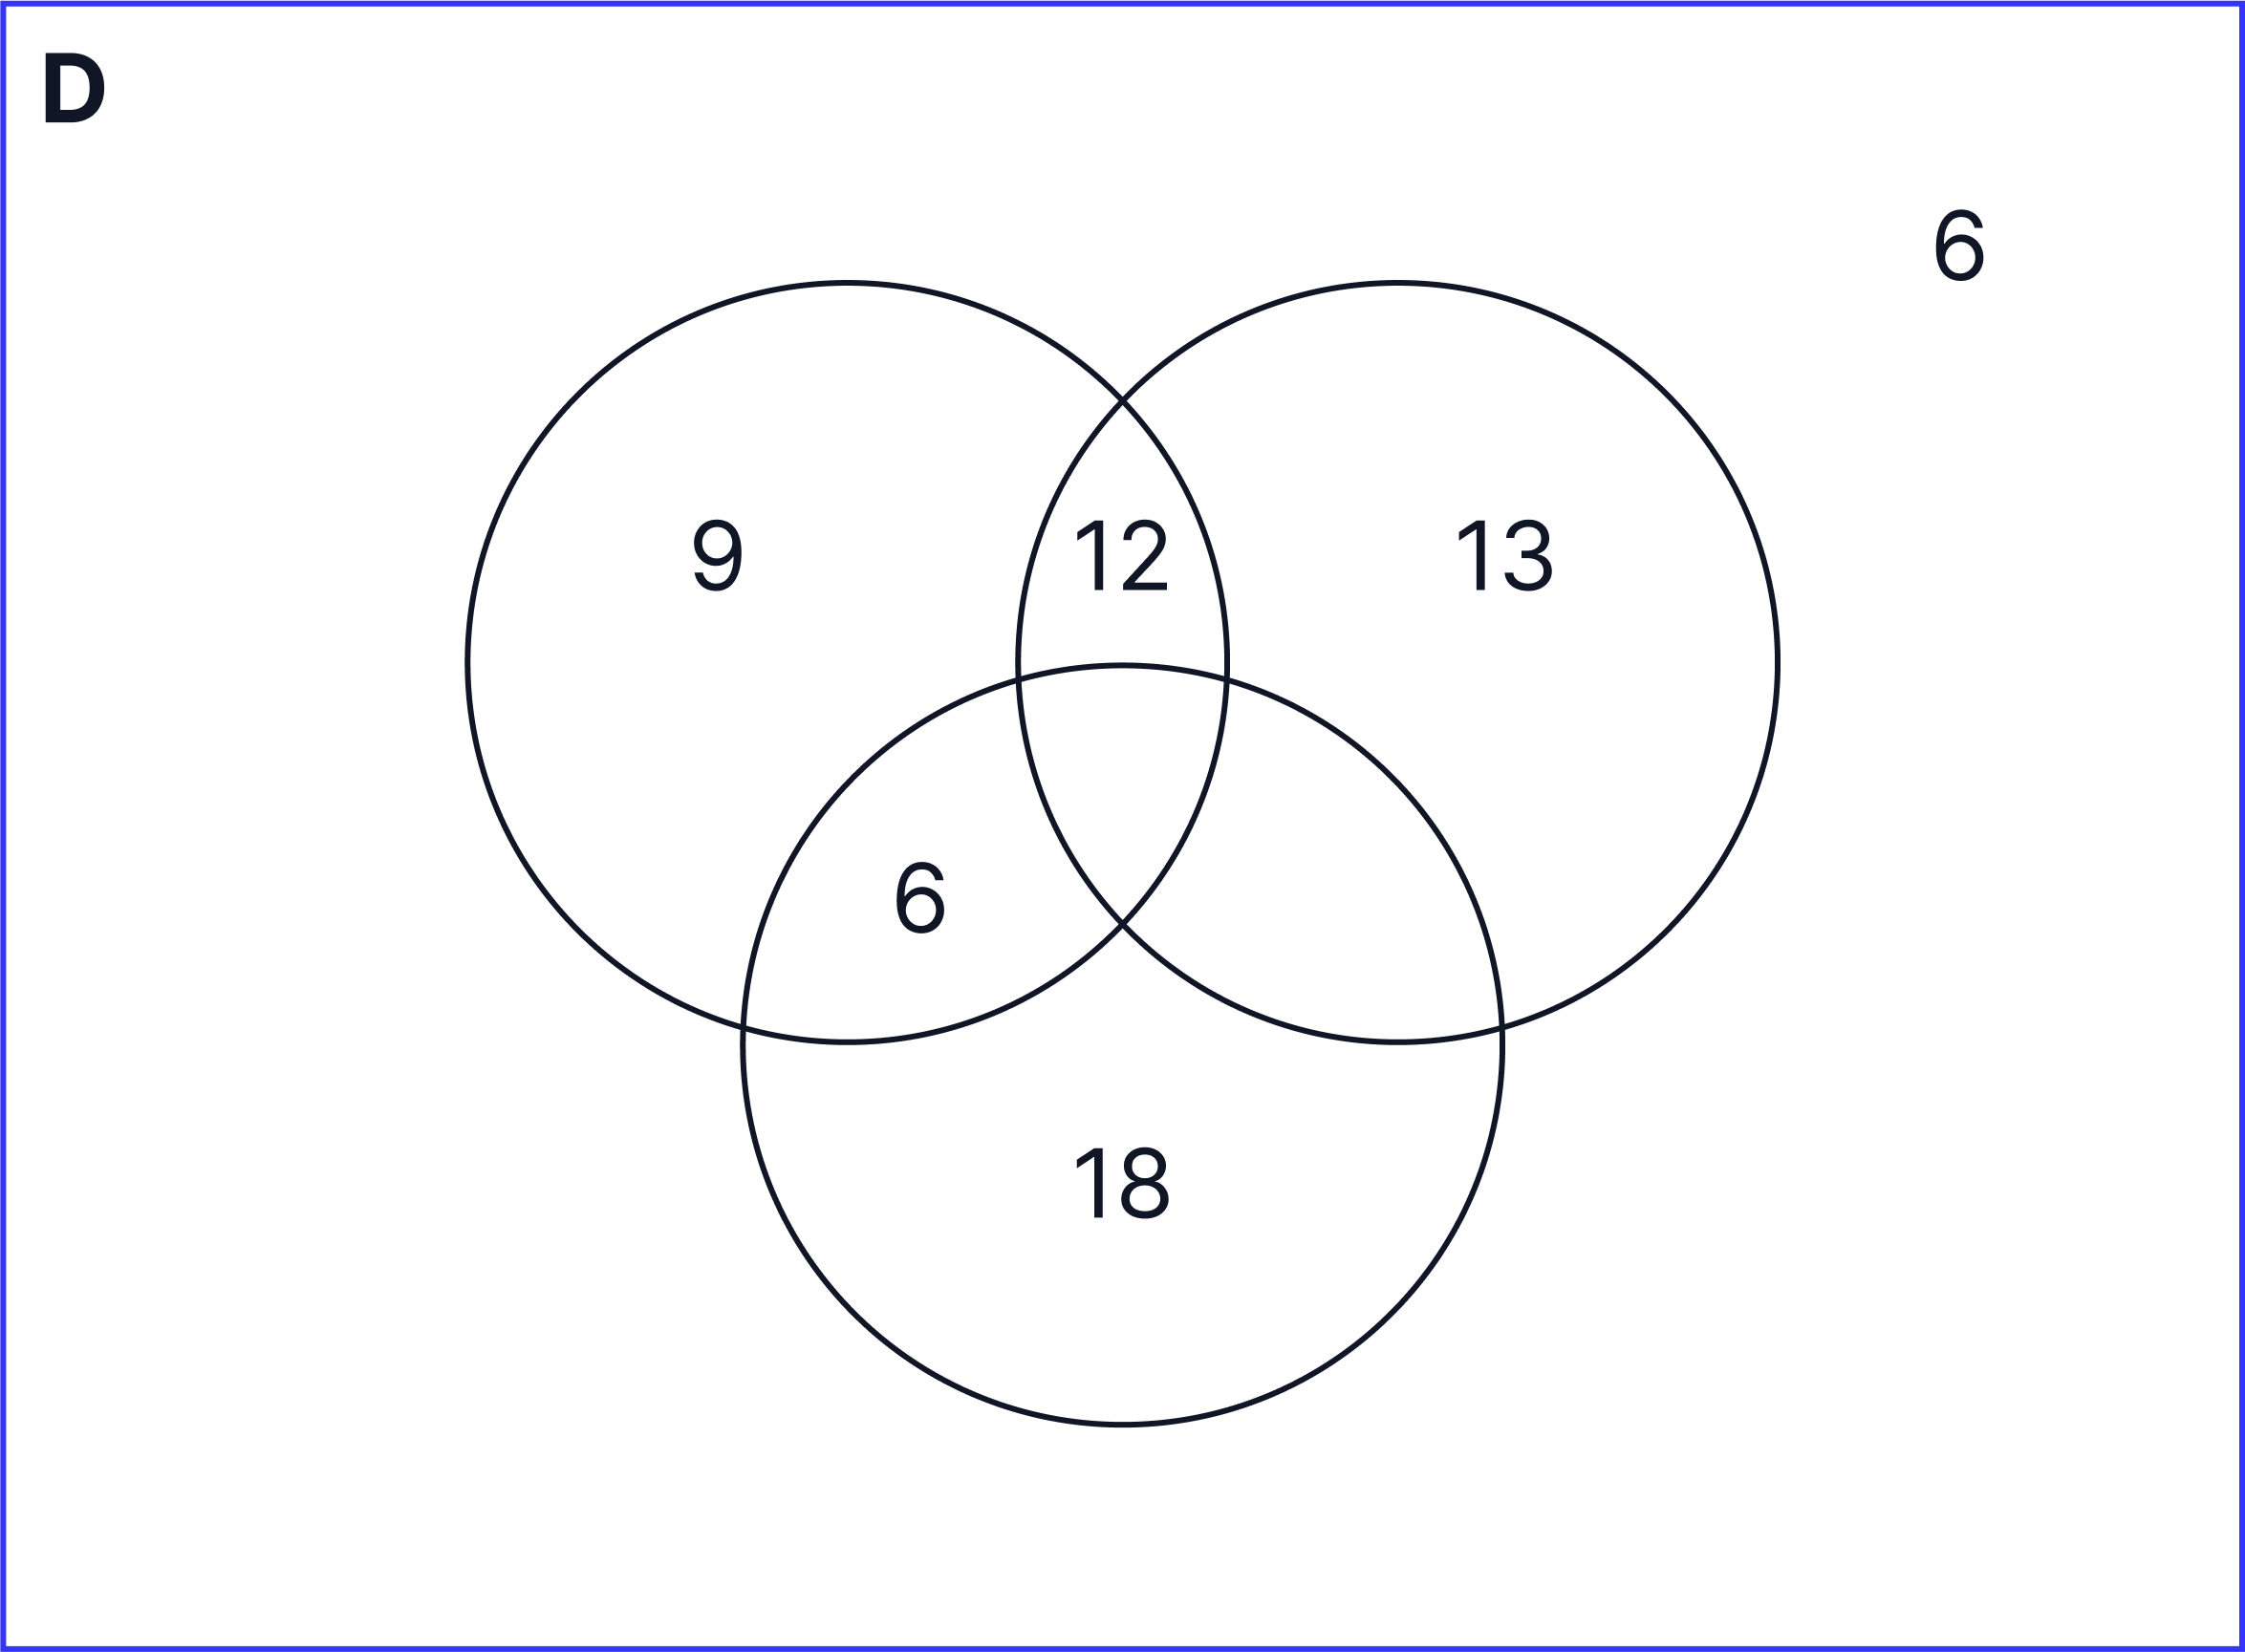
A holiday club is organising activities for 60 students. 25 students are doing tennis, 30 students are doing football, 15 students are doing basketball, 12 students are doing tennis and football and of these, 6 students are also doing basketball.
Which of the following diagrams best represents the above data?
Answer
A.
Worked Solution
Identify the key information from the question:
- Total students = 60
-
Tennis = 25
-
Football = 30
-
Basketball = 15
-
Tennis + Football = 12
-
Tennis + Football + Basketball = 6
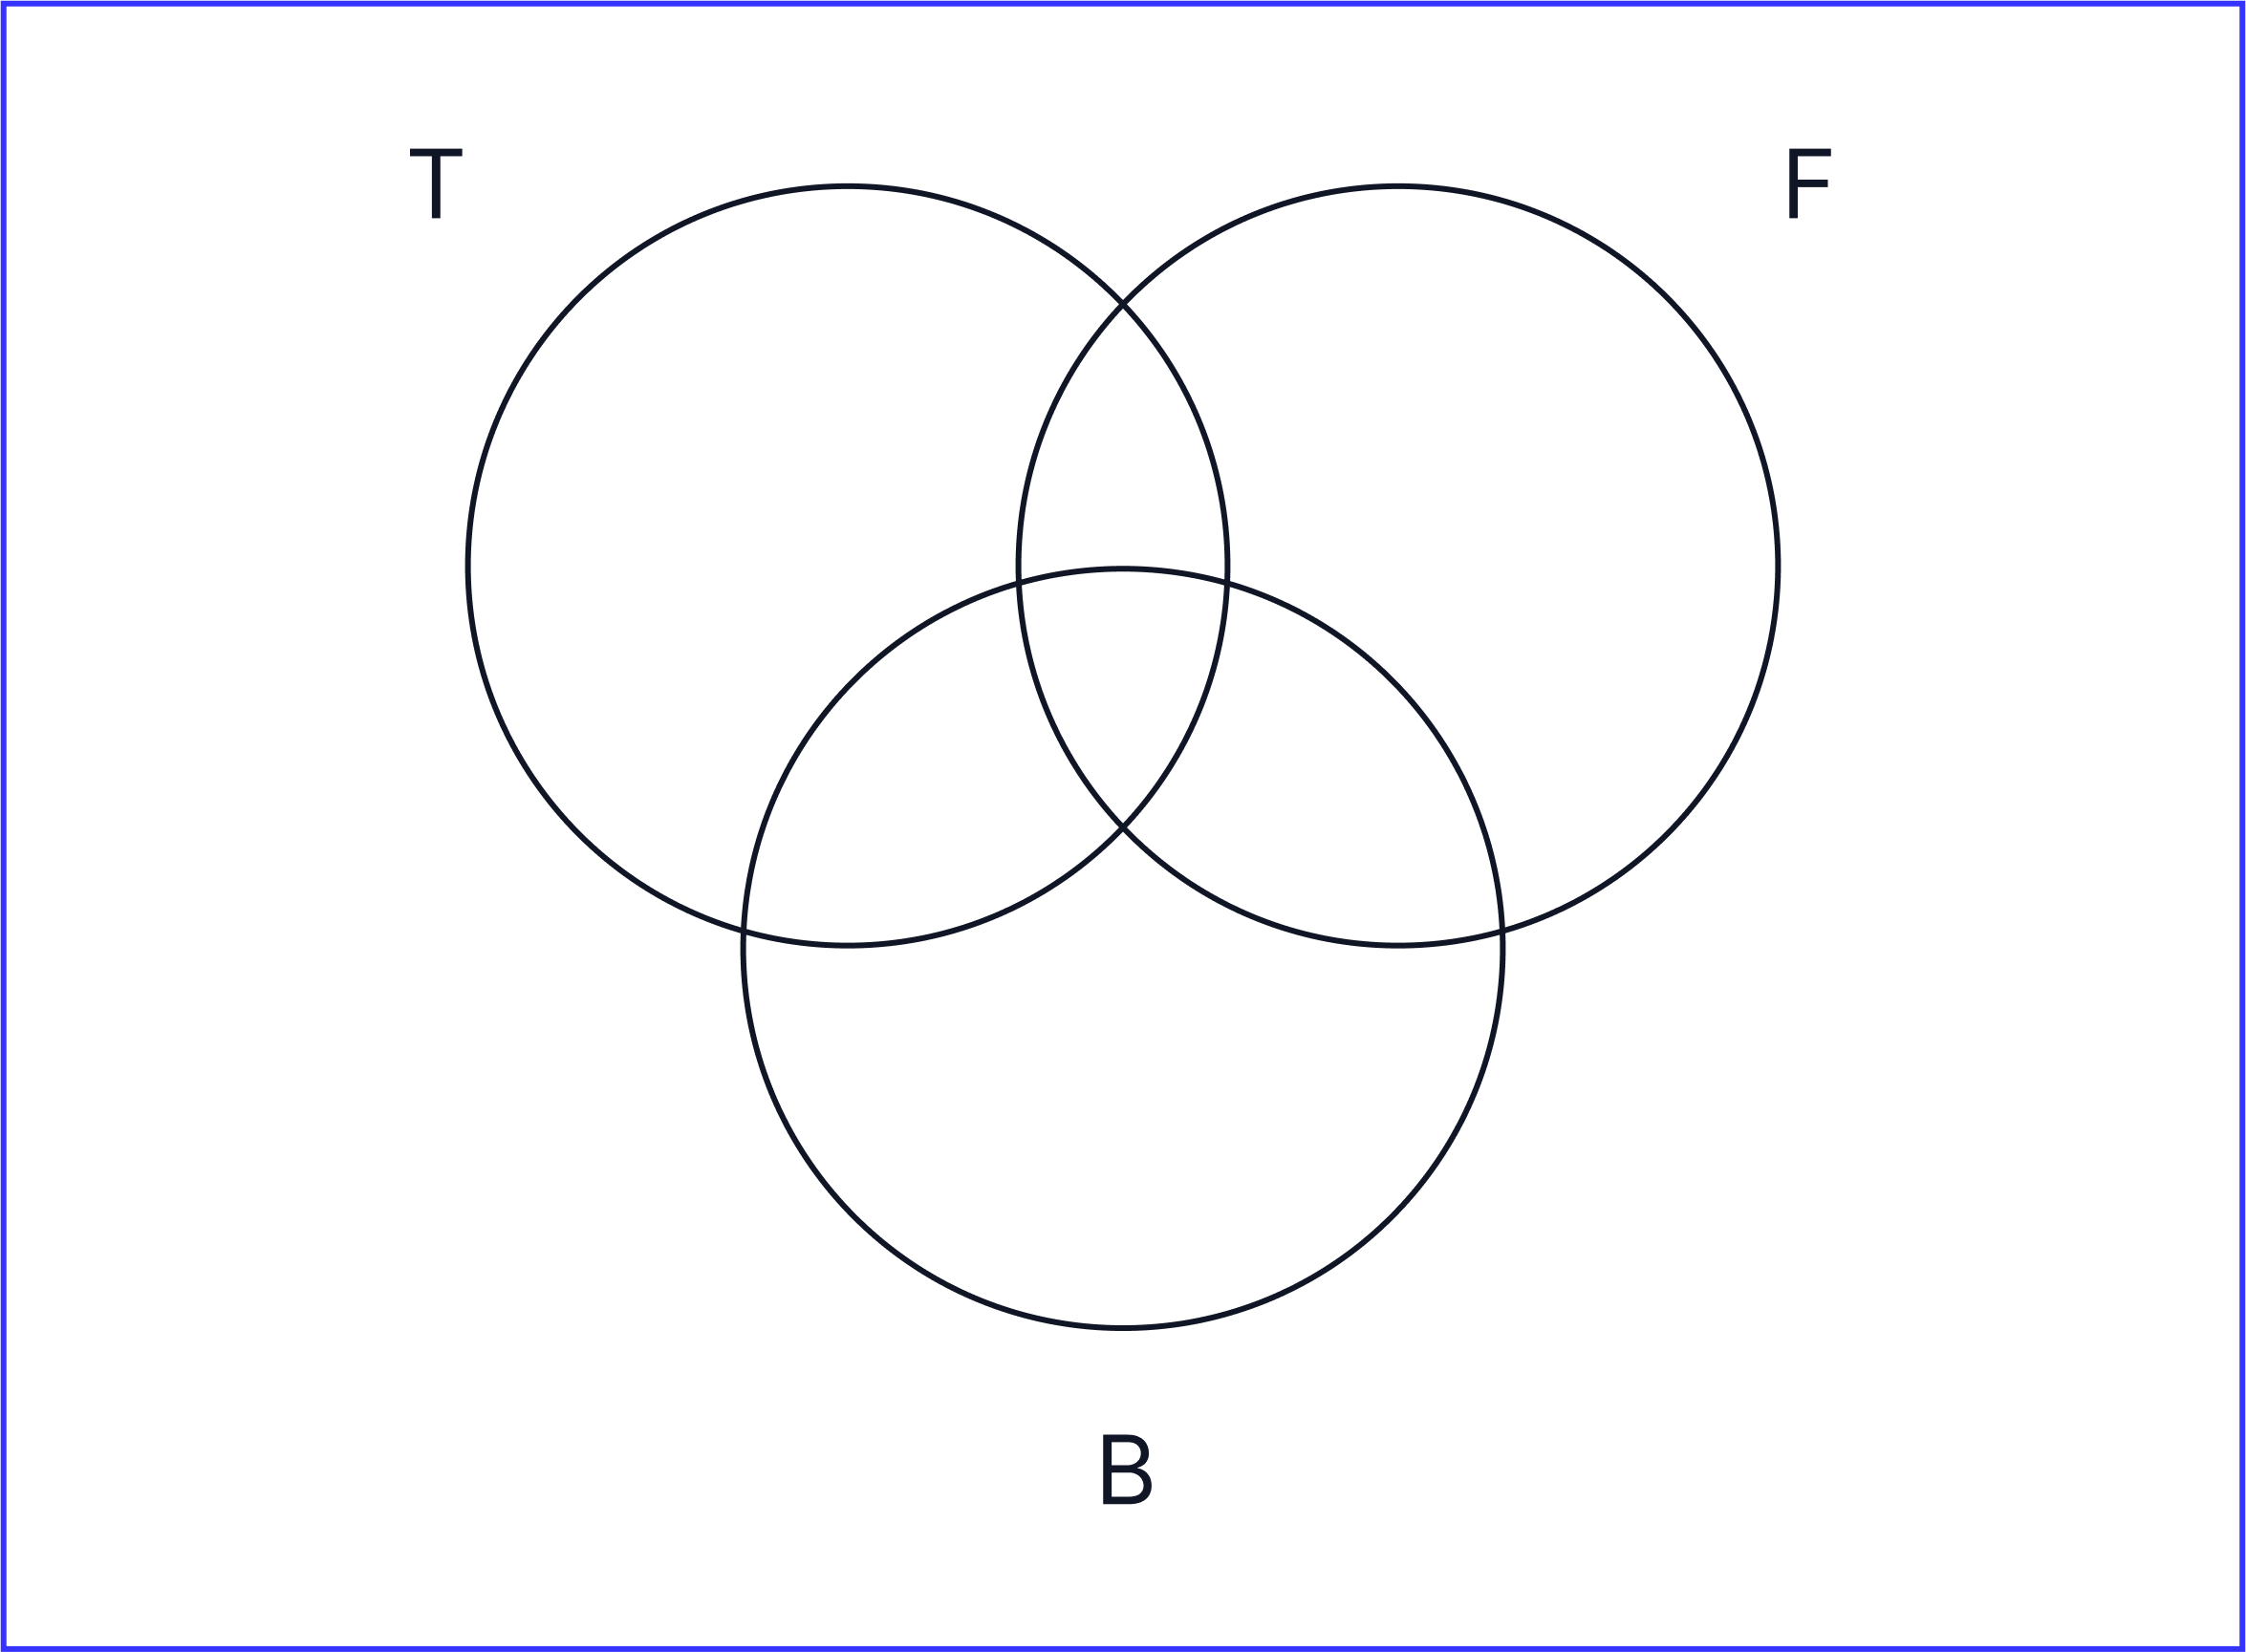
Draw out a Venn diagram to help you organise the information and fill it in using the information given:
-
To save time, write the first letter of each sport e.g. T = tennis, F = football and B = basketball.
Using the information, fill in the Venn diagram:
-
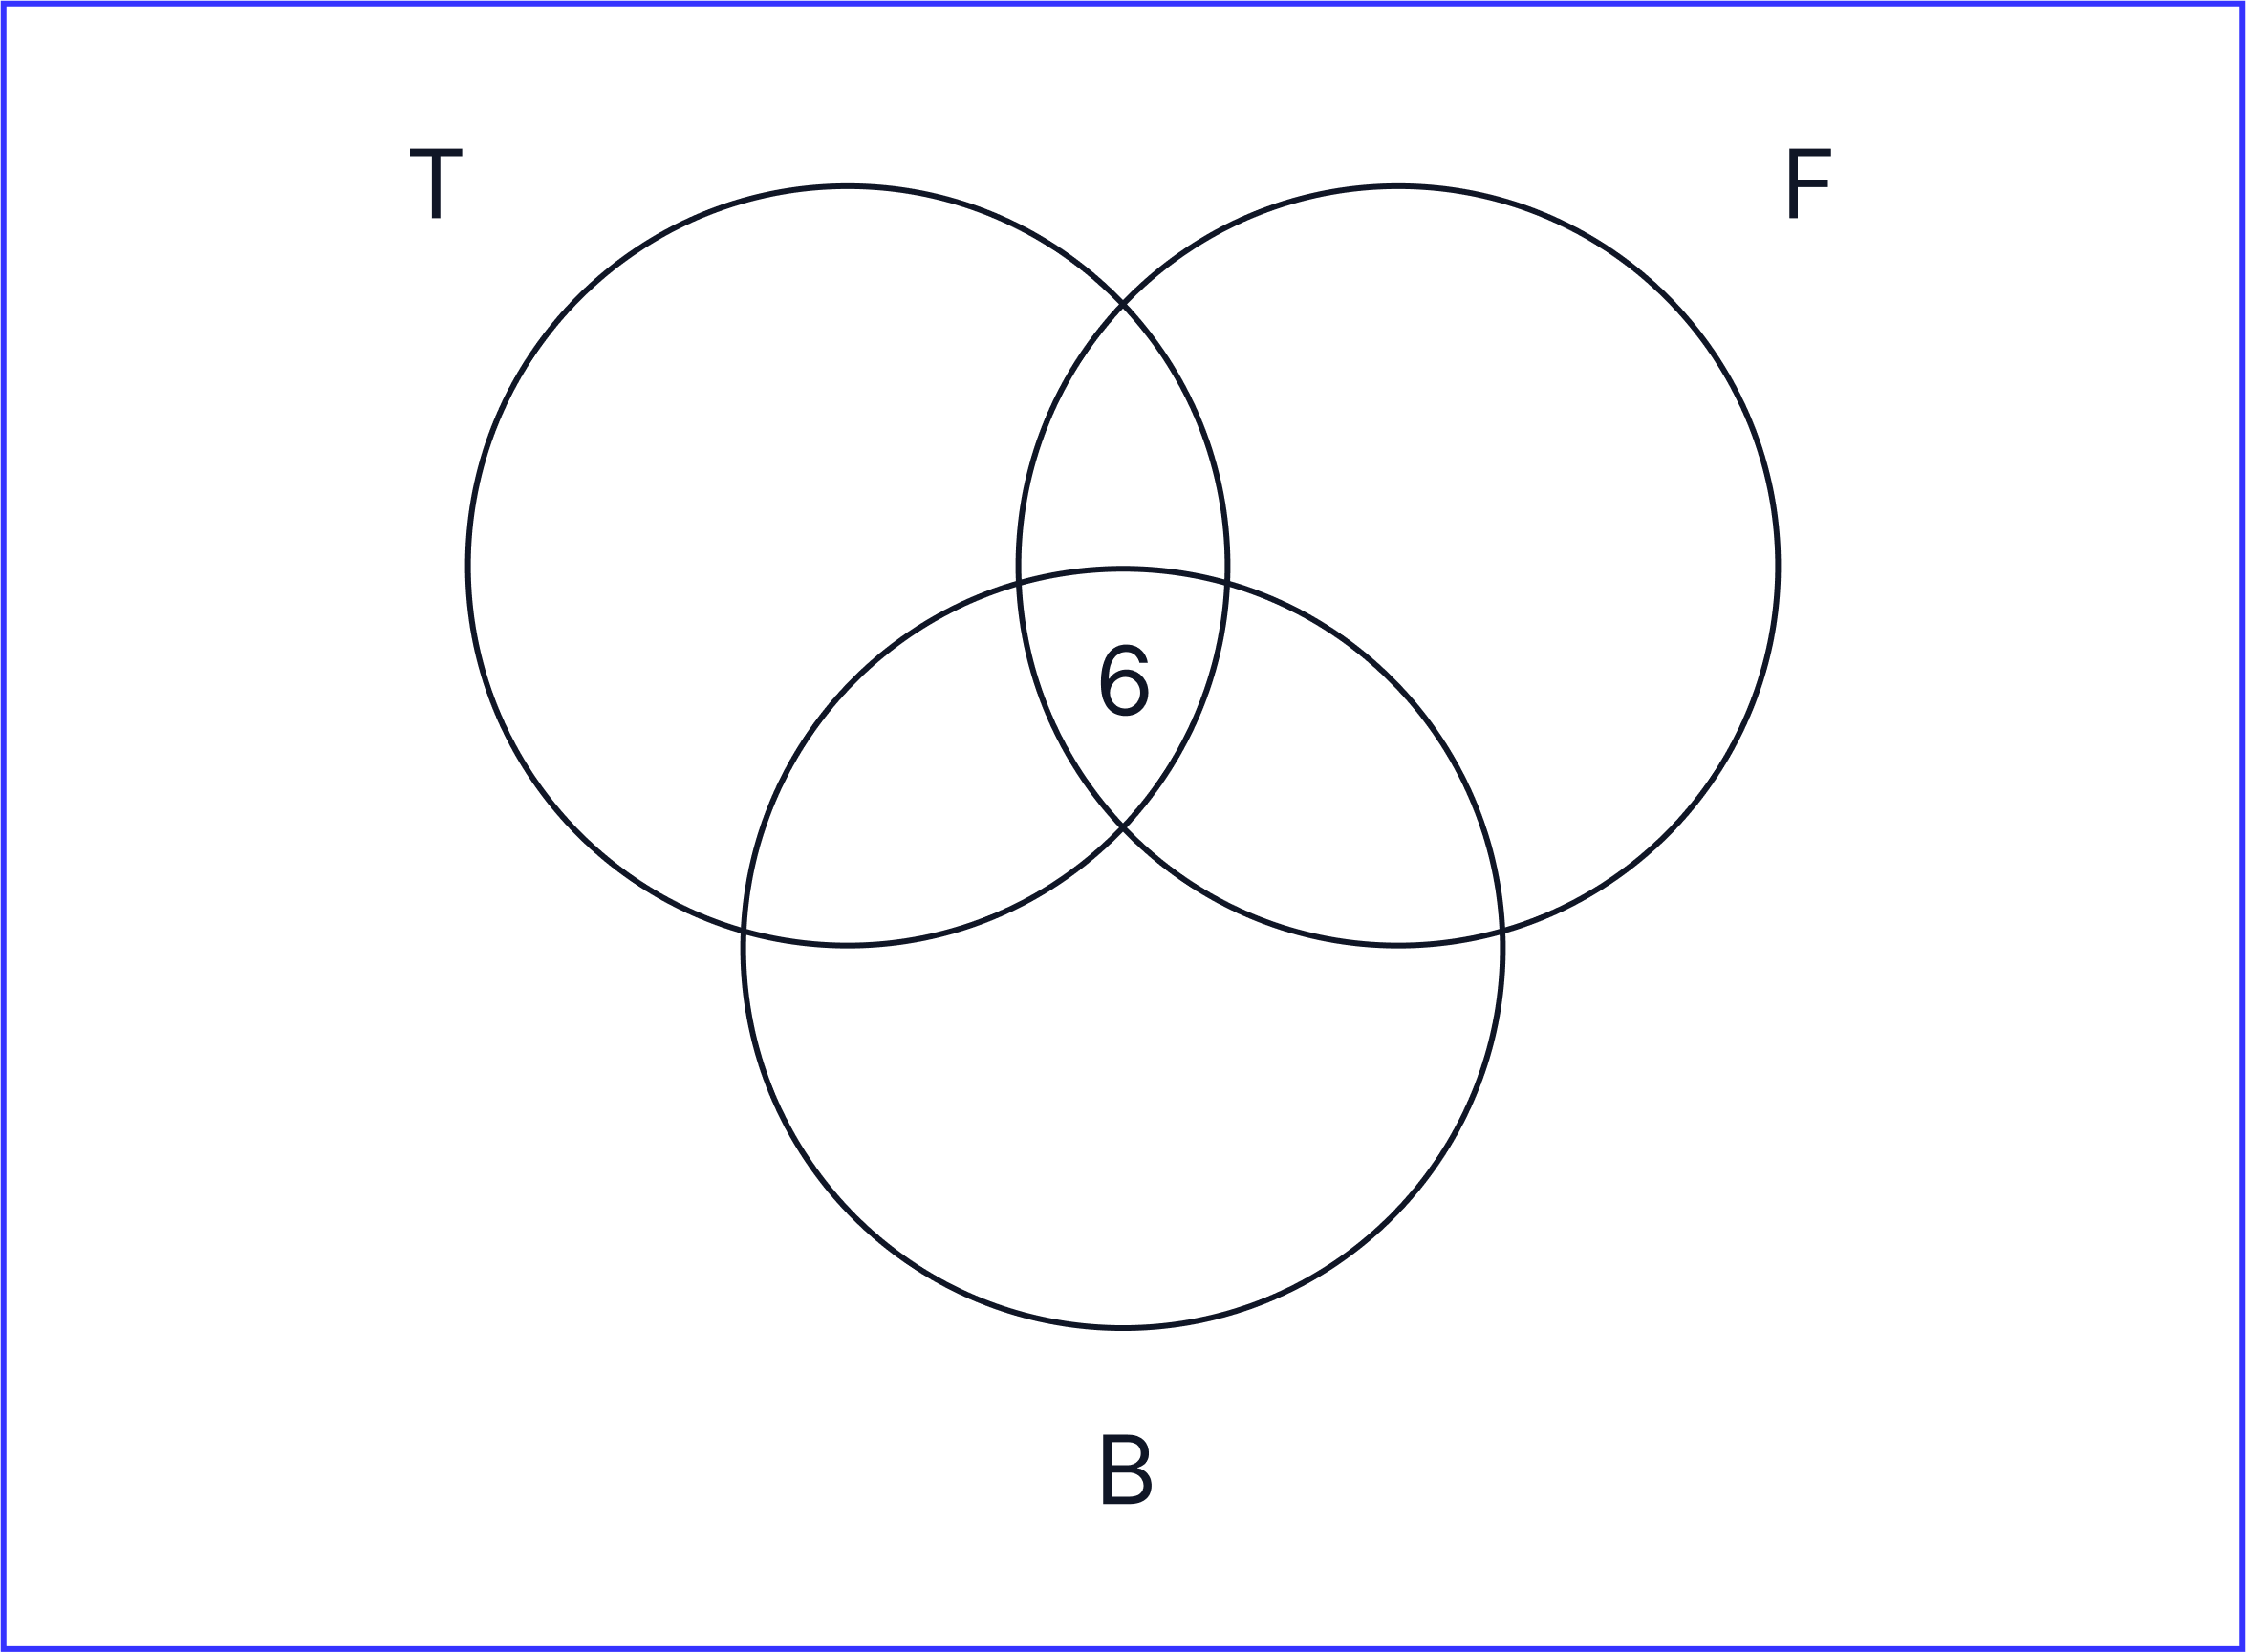
The question states ‘12 students are doing tennis and football and of these, 6 students are also doing basketball’
-
From this statement, we can conclude that 6 students in total are doing tennis, football and basketball. Therefore we can fill in our Venn diagram like this:
The question states that 12 students are doing tennis and football.
-
Therefore, the overlap between tennis and football must be equal to 12 (12-6 = 6).
-
Therefore, the number of students who are doing tennis and football only must be 6.
-
The total of the overlap between tennis and football is equal to 12 (6+6 = 12) which also shows us that our calculation is correct. Therefore our Venn diagram will look like this:
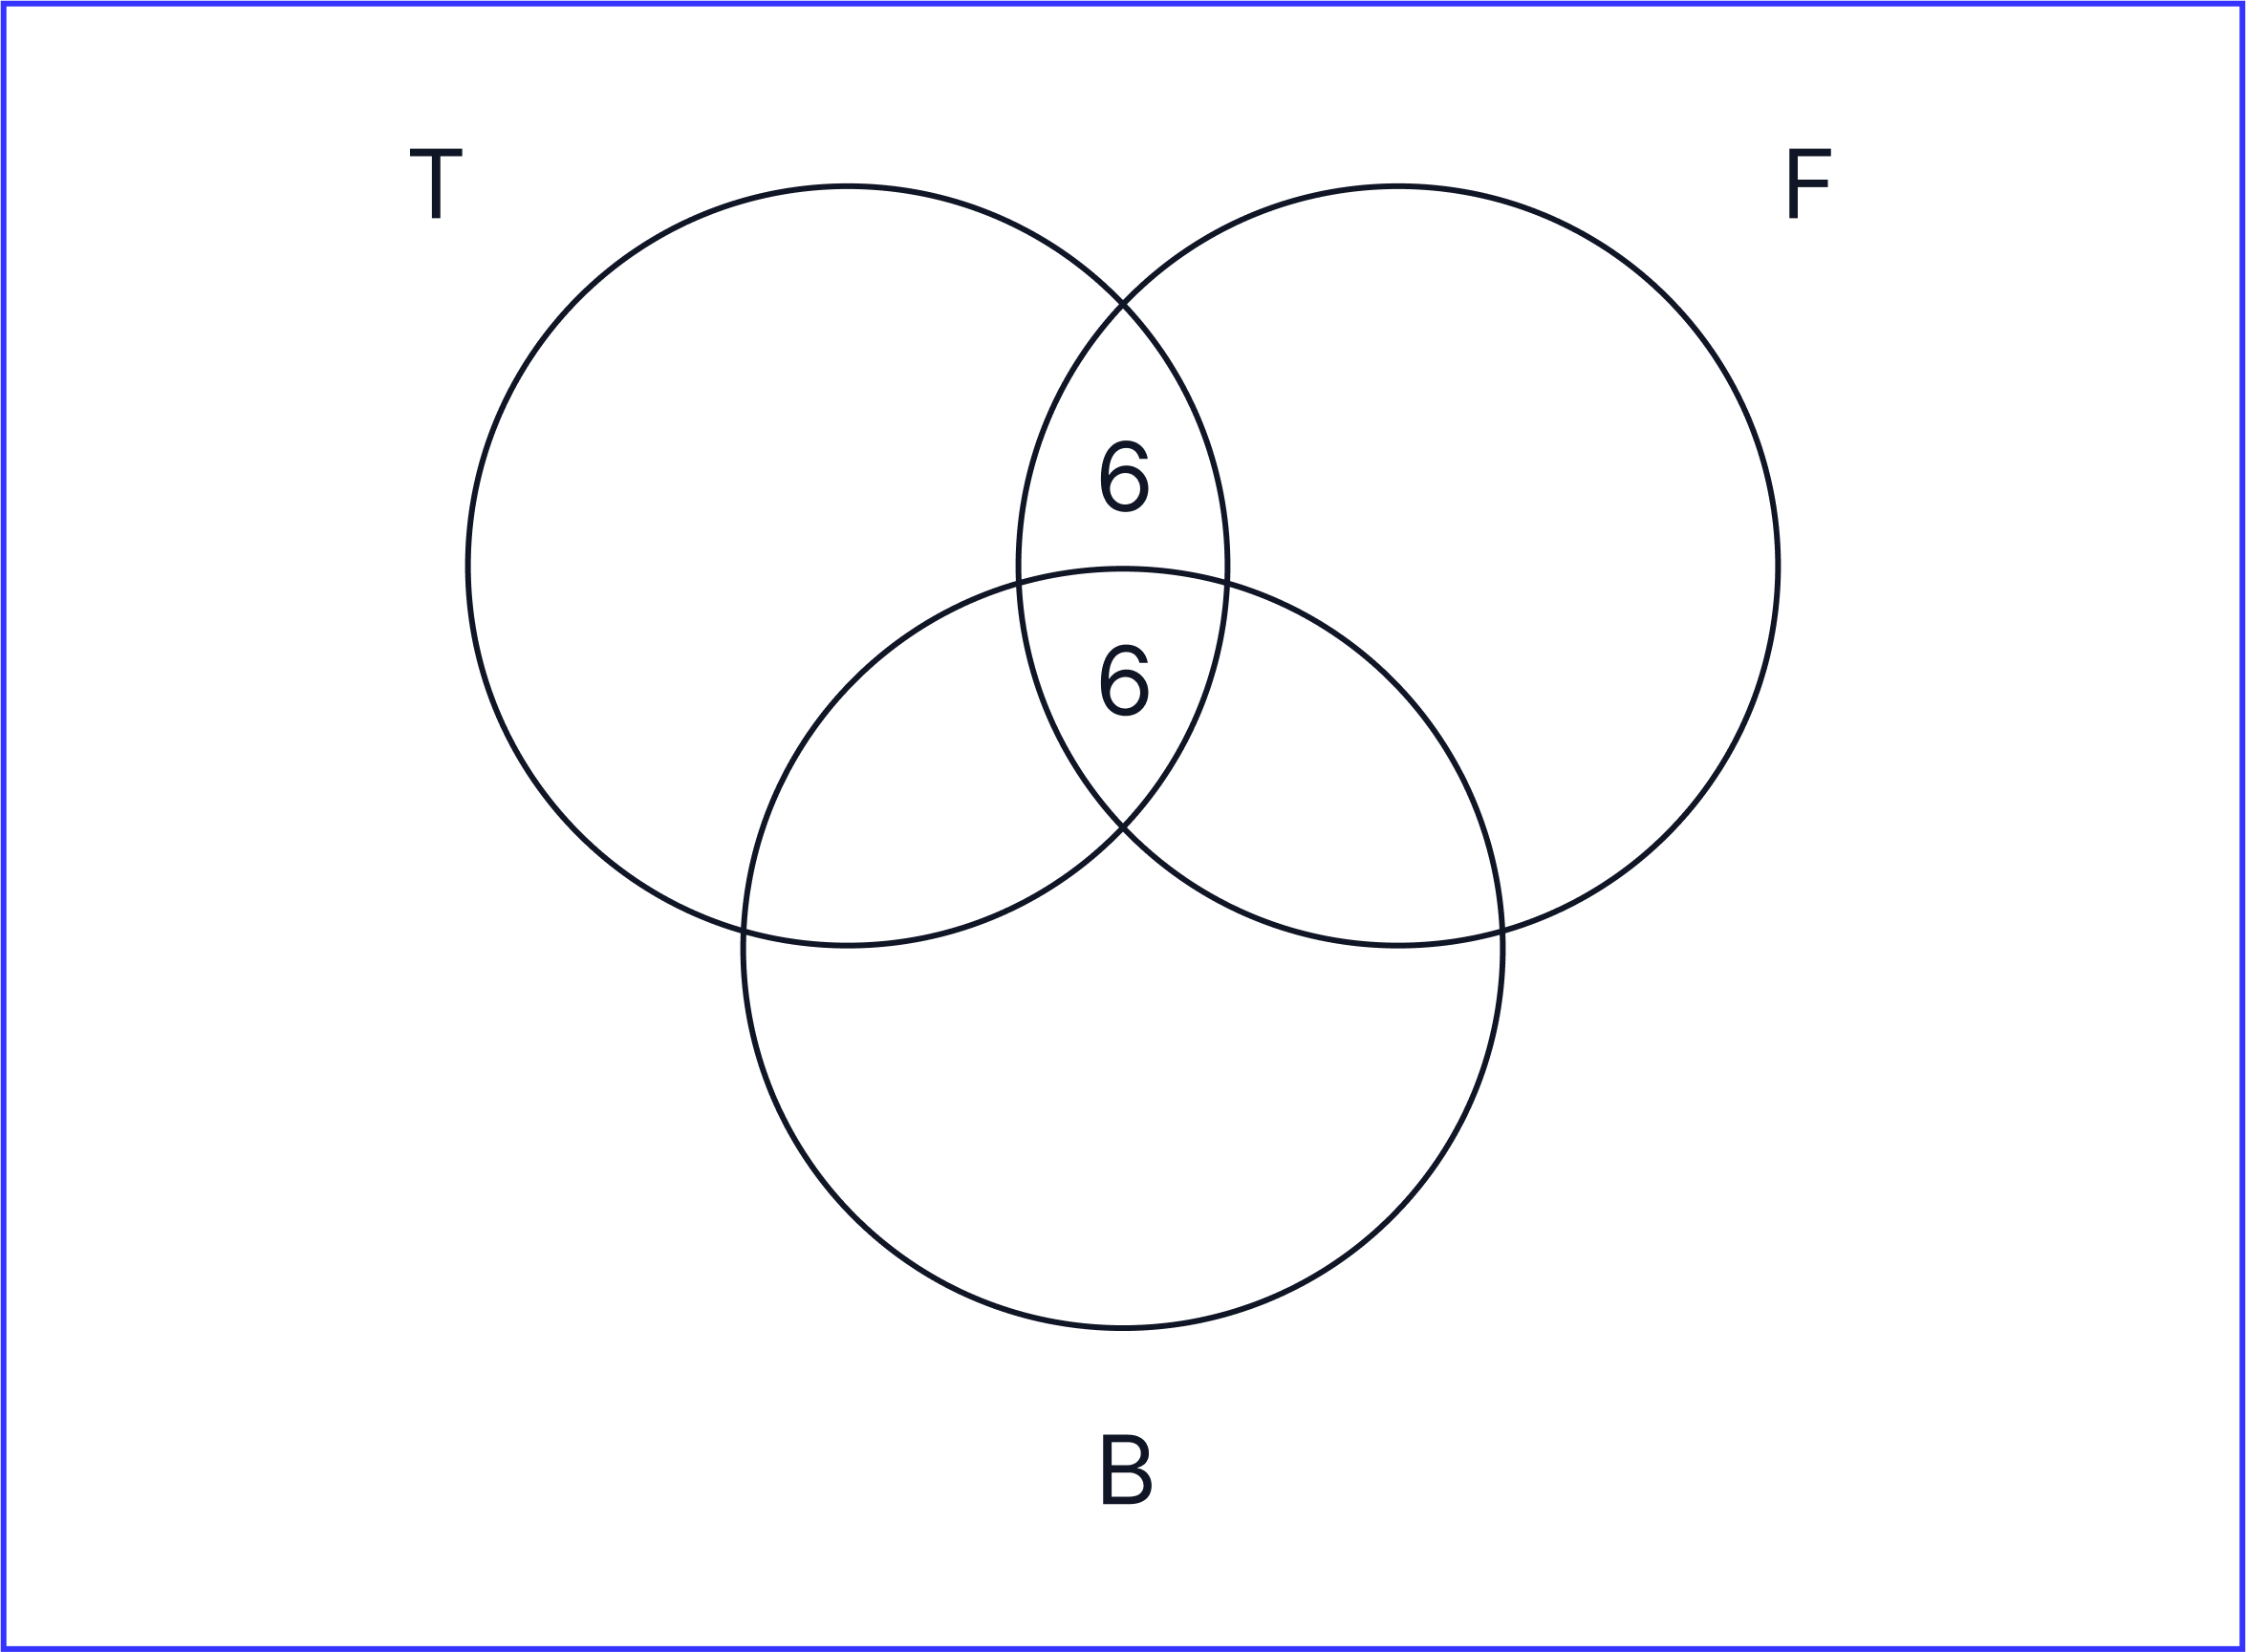
30 students are doing football. Therefore, the total number of students in the ‘football circle’, must be equal to 30.
- We already know 12 people are doing football from our Venn diagram. Therefore, we now need to calculate the number of students who will be playing football only, using the following calculation:
30 - 6 - 6 = 18
- Therefore, we know that 18 students are only playing football.
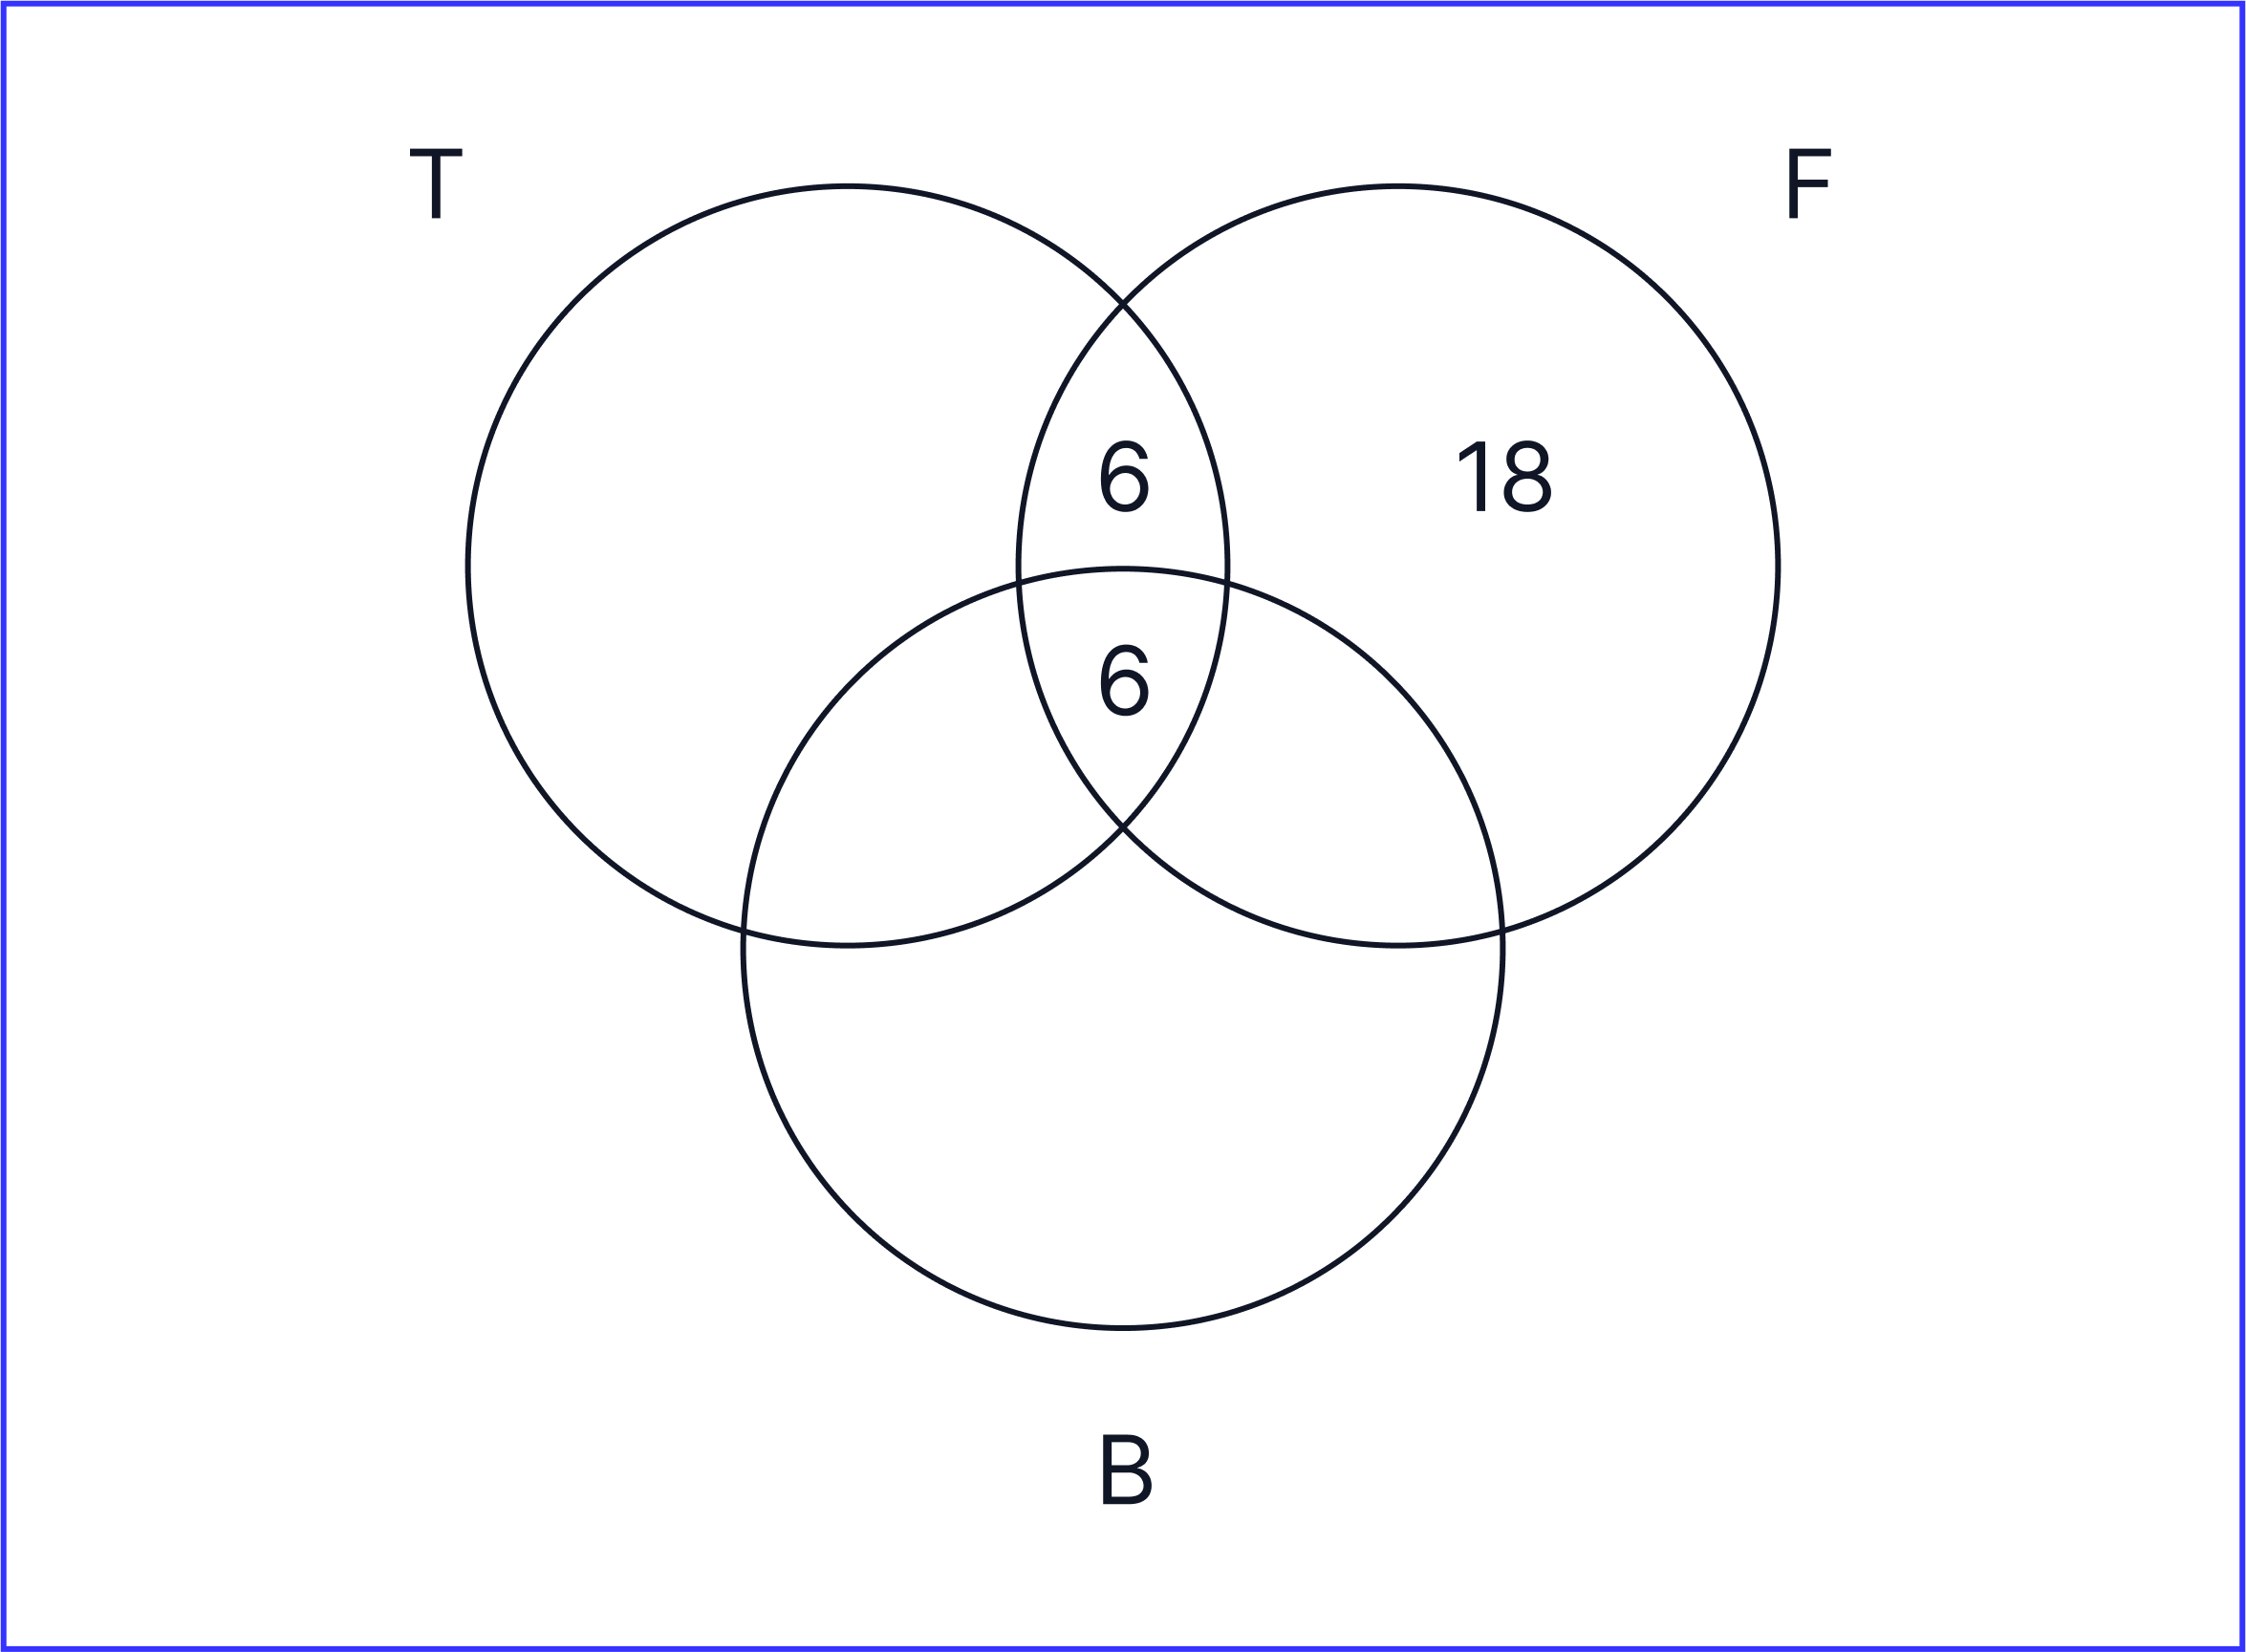
Now, we just need to do the same process for tennis and basketball:
-
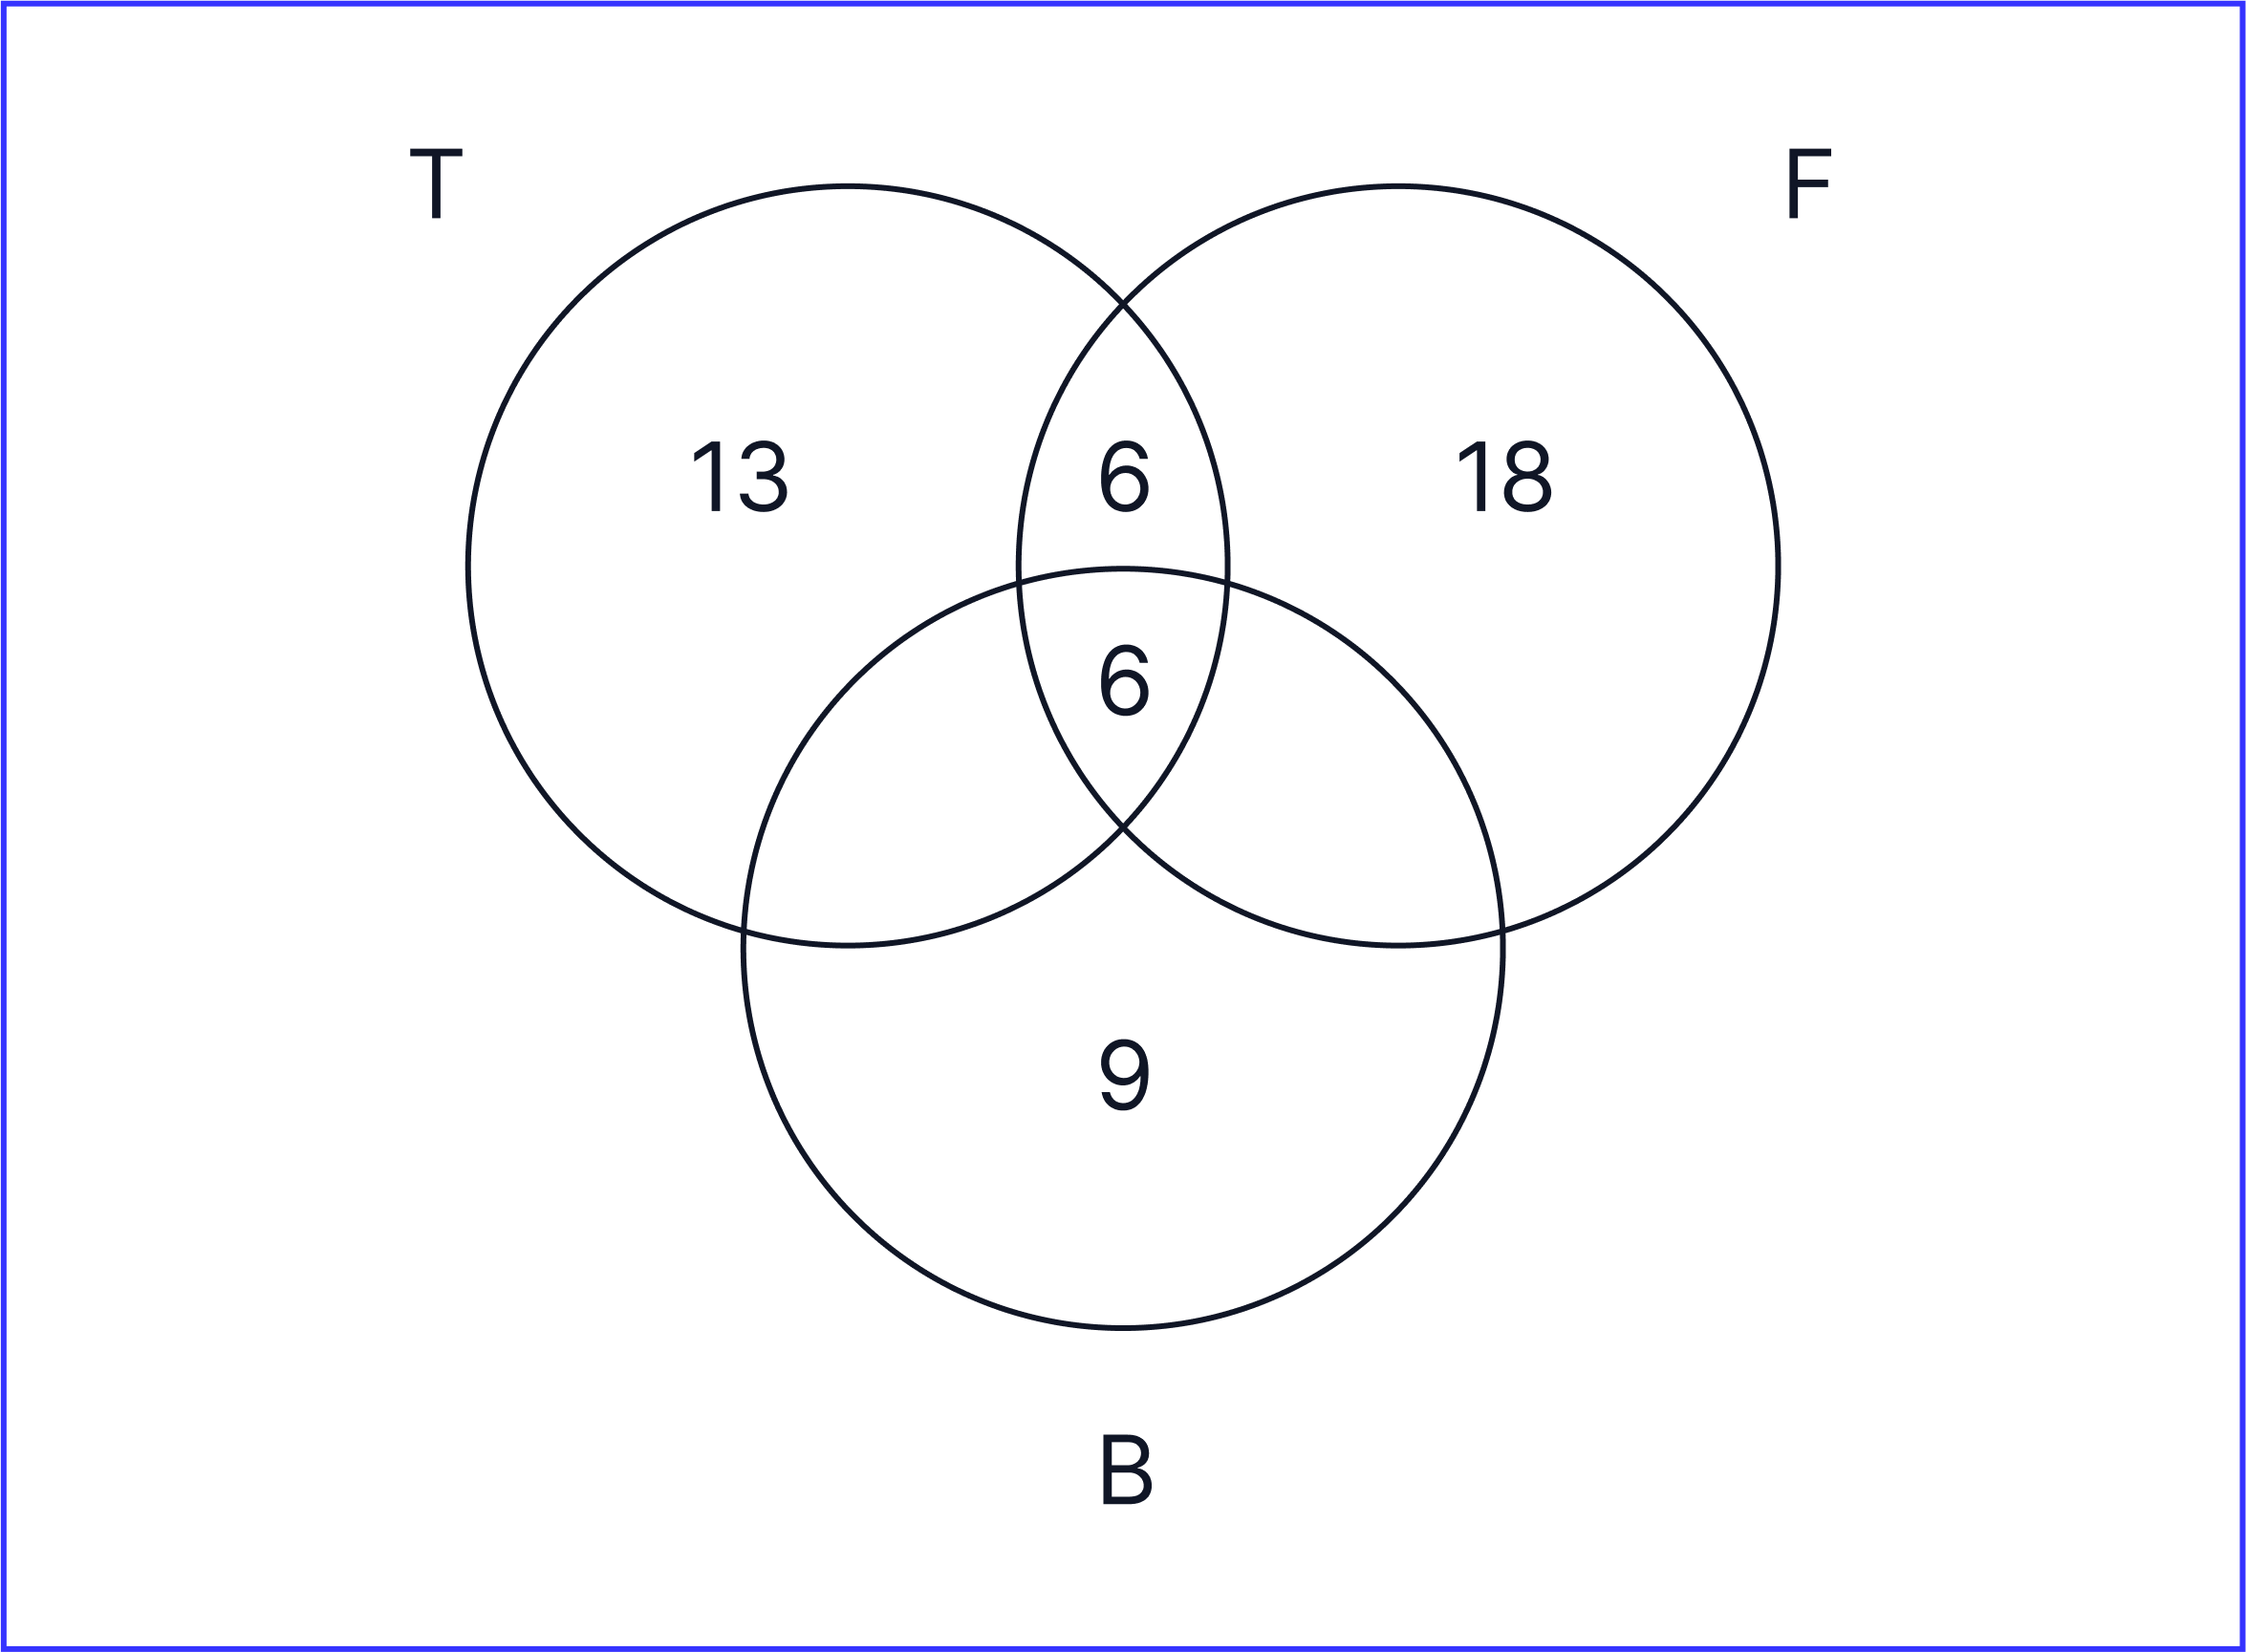
Basketball:
-
15 students are playing basketball. To calculate the number of students who are playing basketball only, we need to do the following calculation:
15 - 6 = 9
-
Therefore, 9 students are only playing basketball.
-
-
Tennis:
-
25 students are playing tennis. To calculate the number of students who are playing tennis only, we need to do the following calculation:
25 - 6 - 6 = 13
-
Therefore, 13 students are only playing basketball.
-
Therefore, our Venn diagram will now look like this:
-
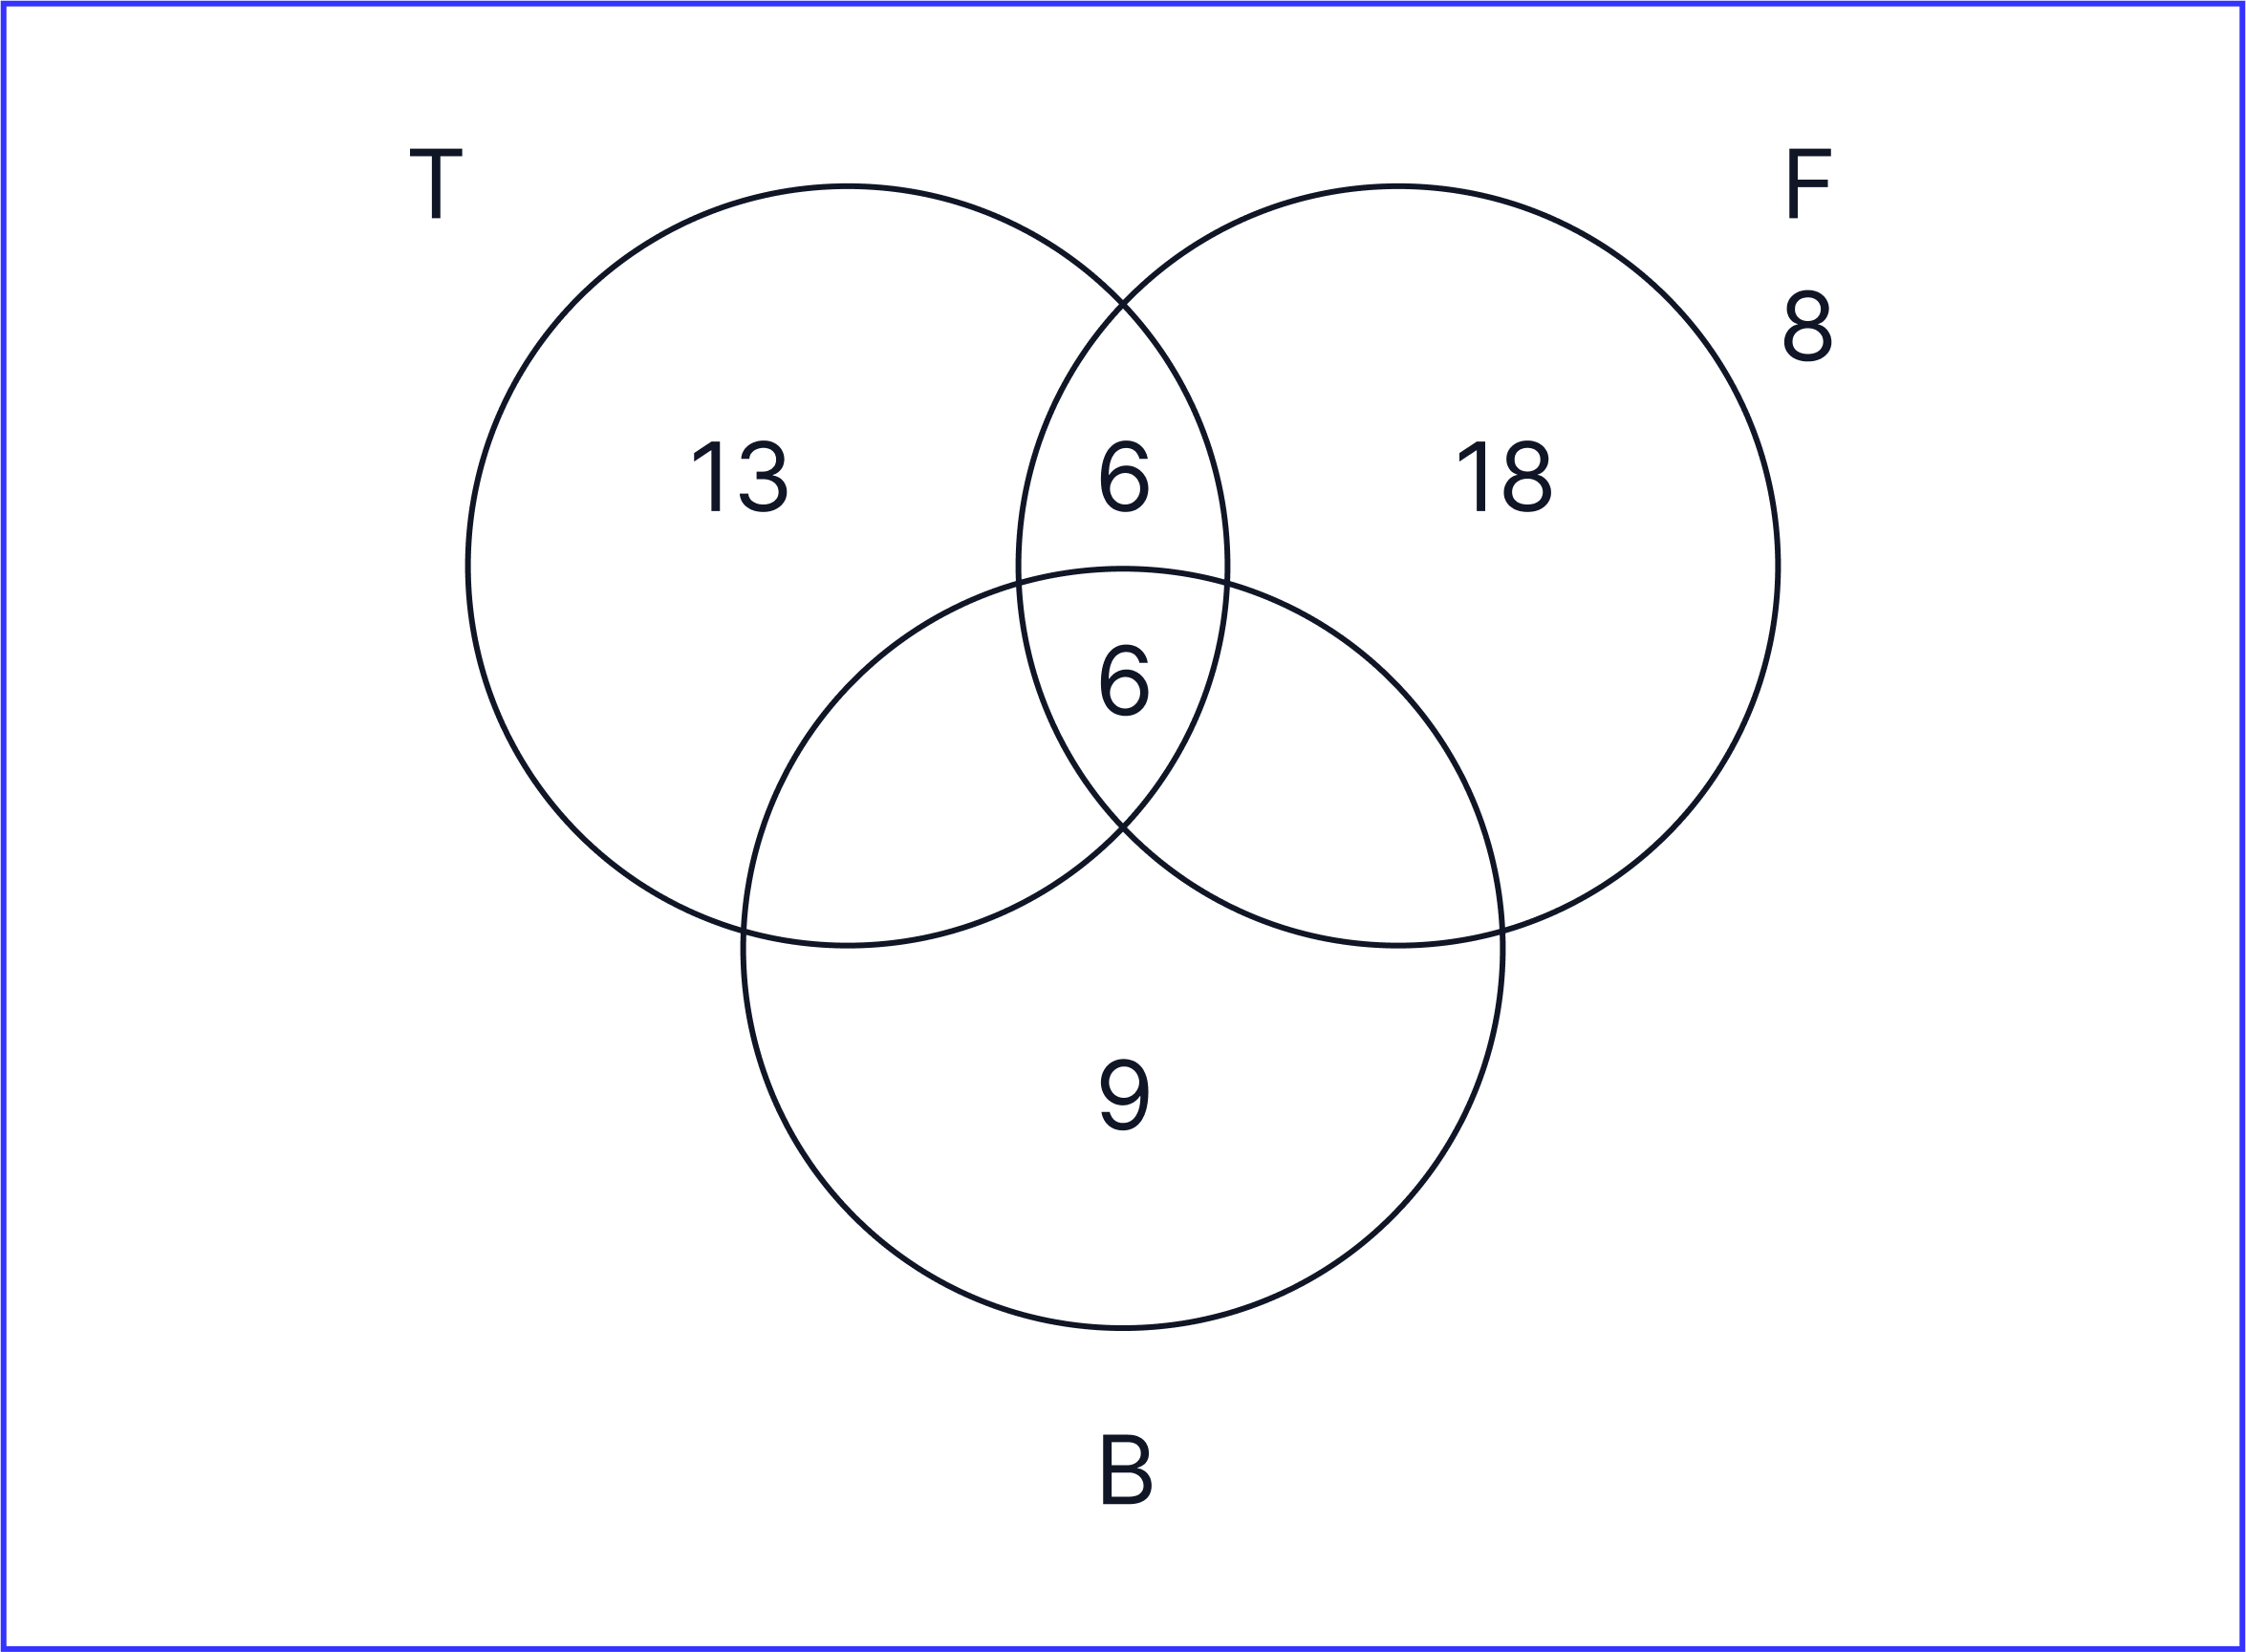
In total, there are 60 students. However, the numbers in our Venn diagram only add up to 52:
13 + 6 + 6 + 18 + 9 = 52
-
To calculate the number of students which will not be doing tennis, football or basketball, we will need to do the following calculation:
60 - 52 = 8
-
Therefore, there will be 8 students which will be on the outside of the Venn diagram as shown below:
-
The Venn diagram which looks the closest to our Venn diagram is A.
Worked Examples Video