Interpreting results from a statistical test
Laura Armstrong & Joe Wolfensohn
Teachers


Contents
Recall Questions
This topic requires prior knowledge of choosing a statistical test. You can test your knowledge on these below.
When do we use the student T-test?
When comparing two mean values.
When do we use a correlation co-efficient?
When looking for a significant correlation / association between two variables.
What test do we use if we have categoric data?
Chi squared
Topic Explainer Video
Check out this @LauraDoesBiology video that explains interpreting results from a statistical test or read the full notes below. Once you've gone through the whole note, try out the practice questions!
What Happens After Doing a Statistical Test?
Once you complete a statistical test (e.g. t-test, chi-squared, Spearman's rank), you get a test statistic.
You then compare this statistic to a critical value OR look at the p-value to decide:
Do we accept or reject the null hypothesis ?
Is there a statistically significant result?
Interpreting p-values
In AQA exam questions, they often tell you the P value, such as in this example question…
‘Scientists used a statistical test to determine whether there was a significant difference in the mean amino acid concentration in two types of white wine. They obtained a value for P of 0.04.’
(This is telling us there is 4% probability that this difference occurred by chance as 0.04 is equal to 4%)
What does a p-value represent?
The p-value tells you the probability that the difference or correlation happened by chance.
|
If p is... |
Interpretation |
Conclusion |
|---|---|---|
|
p < 0.05 |
Less than 5% probability difference/ correlation is due to chance |
Reject the null hypothesis - difference / correlation is statistically significant |
|
p = 0.05 |
Exactly 5% probability difference/ correlation is due to chance |
Reject the null hypothesis - right on the threshold for significance - difference / correlation is statistically significant |
|
p > 0.05 |
More than 5% probability difference/ correlation is due to chance |
Accept the null hypothesis - difference/ correlation is not statistically significant |
Instead of being given a p-value, you may have to use a critical value table to determine significance.
How to Use a Critical Value Table
-
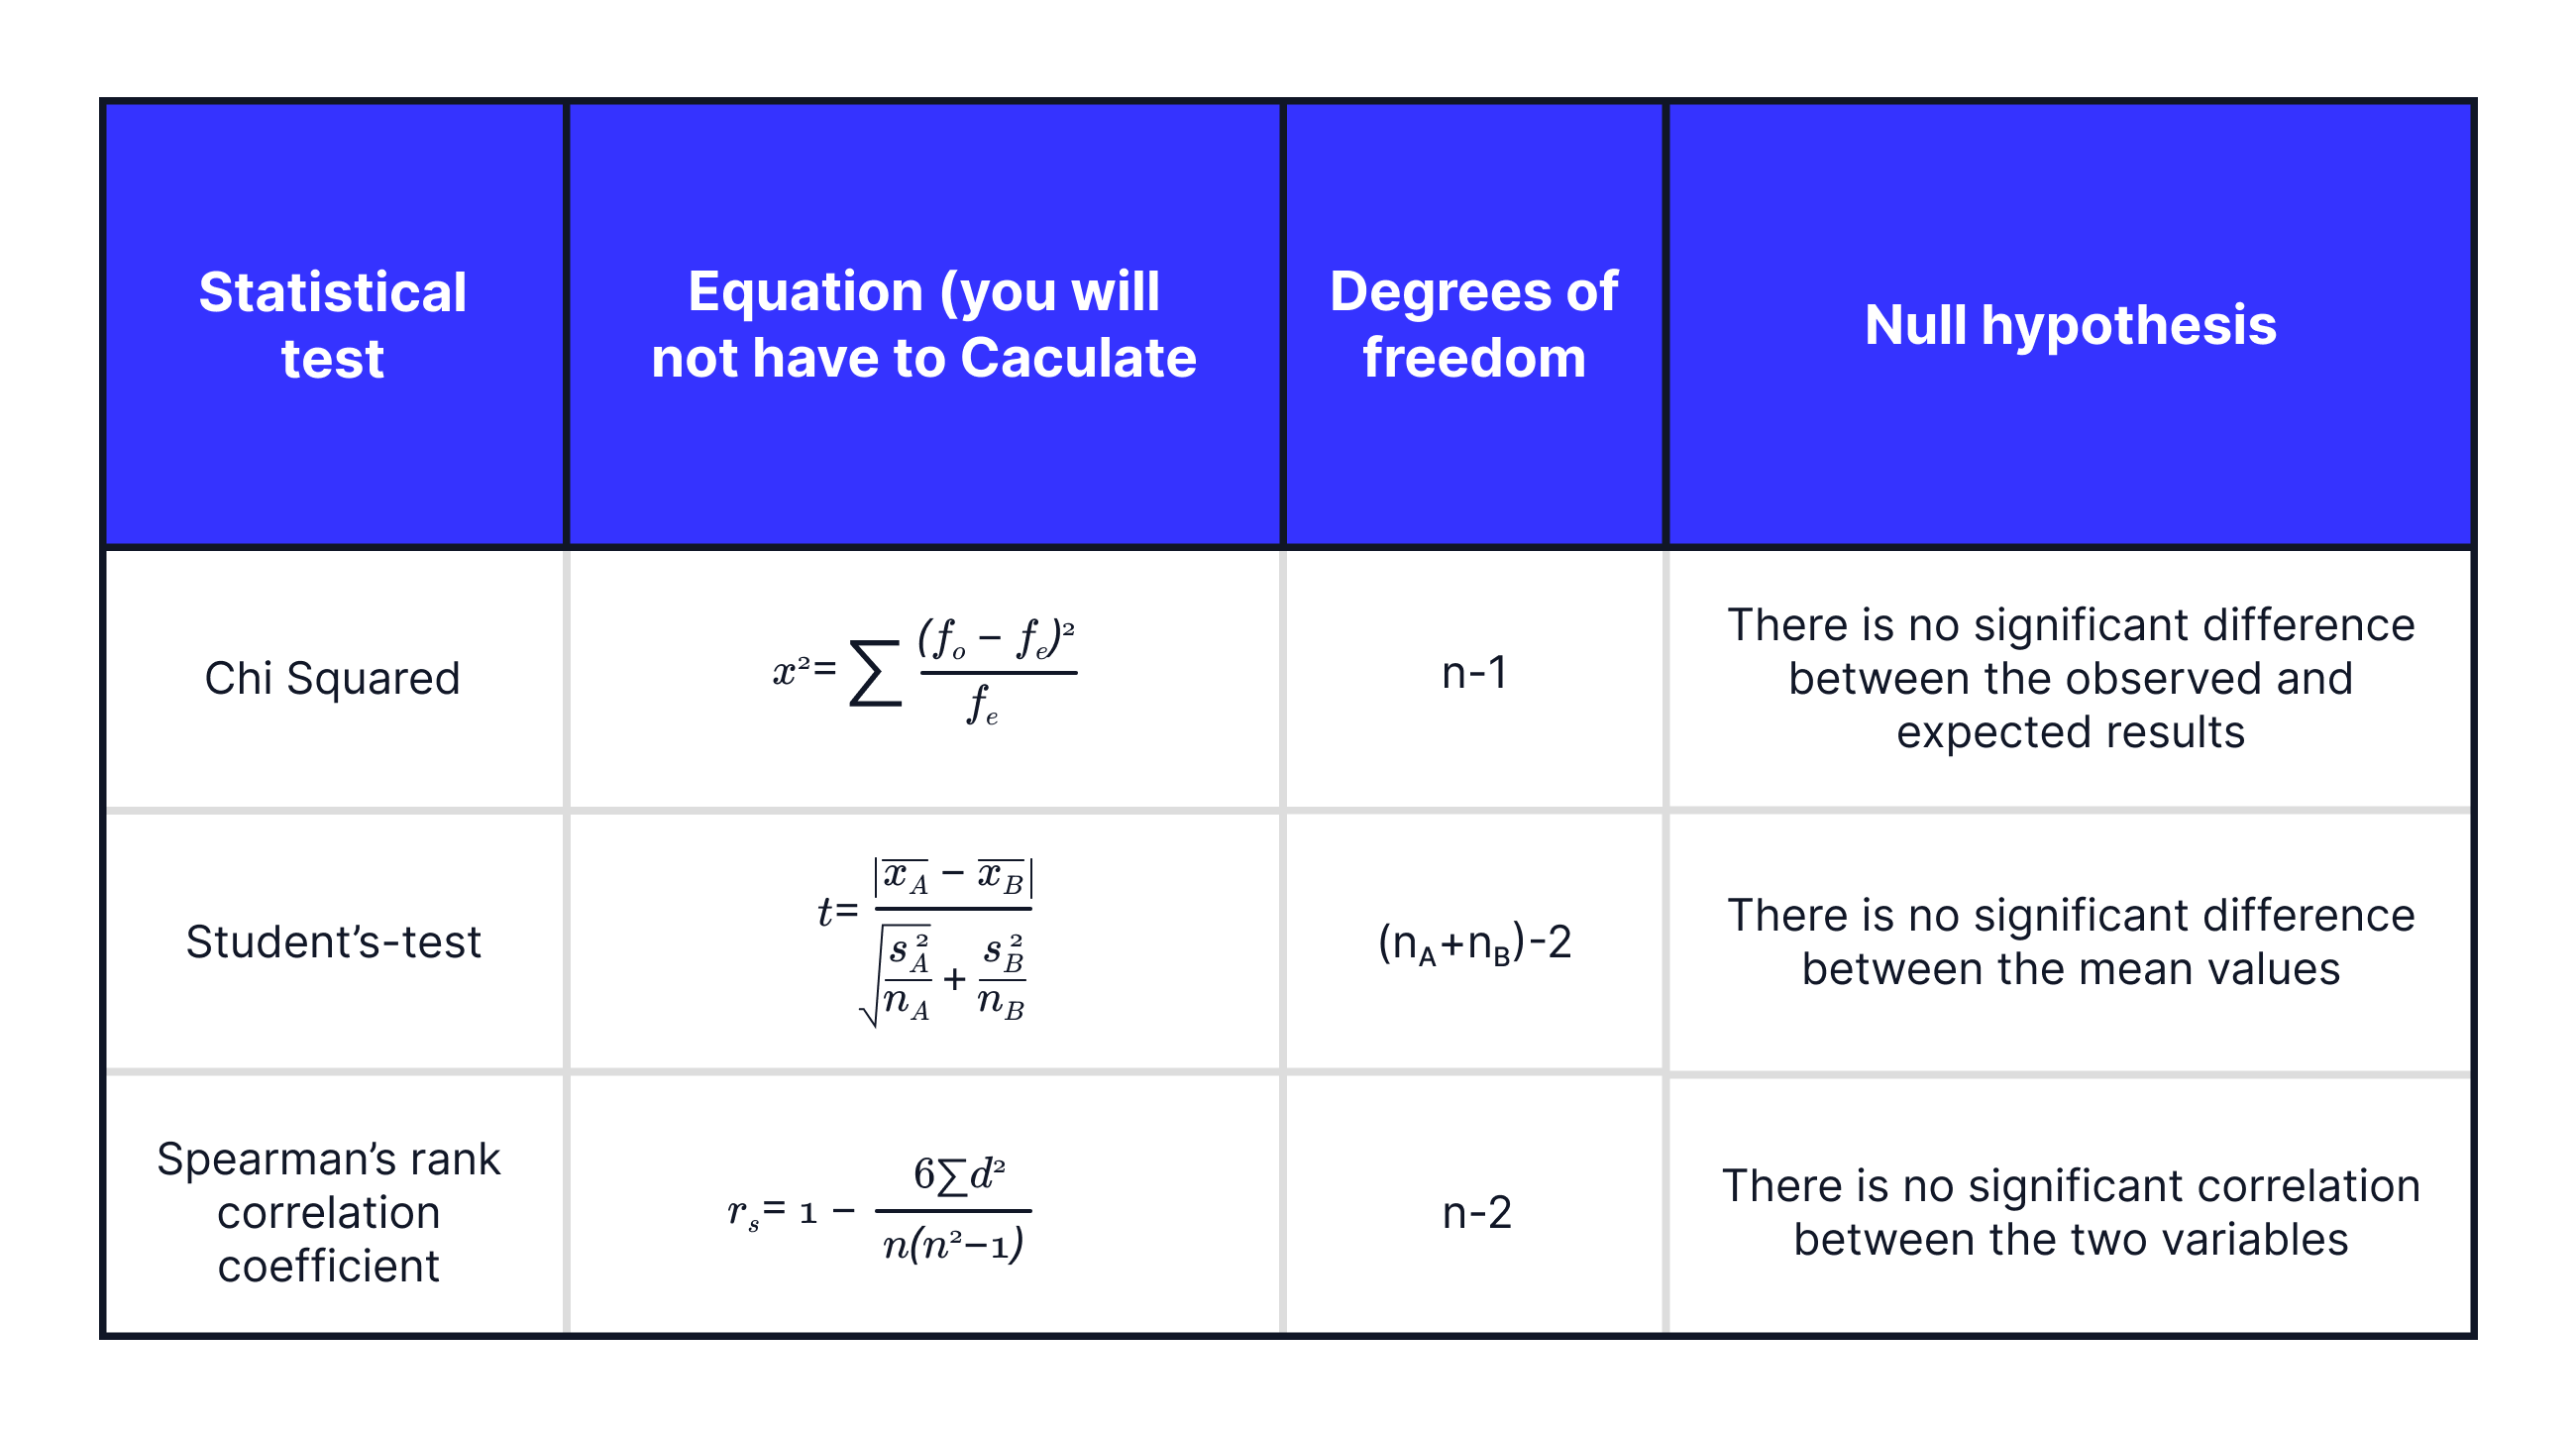
Find your degrees of freedom (df).
-
for t-test: df = (sample size₁ + sample size₂) – 2
-
for chi-squared: df = n – 1 (where n is the number of categories)
-
for Spearman’s rank: df = n – 2 (where n = the number of pairs of data)
-
Look up the critical value corresponding to:
-
The degrees of freedom
-
your chosen significance level (in Biology this is usually p = 0.05/ 5%).
-
Compare your calculated test statistic to the critical value:
-
If the test statistic > critical value → Reject the null hypothesis (significant difference/ correlation)
-
If the test statistic < critical value → Accept the null hypothesis (not a significant difference/ correlation)
Interpreting the r value from Spearman’s Rank
Spearman’s Rank (r) measures the strength and direction of correlation:
|
r value |
Meaning |
|---|---|
|
Close to +1 |
Strong positive correlation (as one increases, the other increases) |
|
Close to -1 |
Strong negative correlation (as one increases, the other decreases) |
|
Close to 0 |
No correlation (no relationship) |
Important: A high r value does not automatically mean significance - you must still compare to critical values or look at the p-value!
Summary Table
Showing how to calculate degrees of freedom and how to write a null hypothesis.
Key Terms
- p-value: Probability that difference/ correlation is due to chance
- Critical Value: Value from a table that a test statistic must exceed for difference/ correlation to be significant
- Null Hypothesis (H₀): Hypothesis assuming no effect, difference, or relationship
- Statistically Significant: A difference/ correlation unlikely to have occurred by chance (typically p < 0.05)
No answer provided.
Exam Tips
Always clearly state your conclusion, practice writing these examples out!
-
"Since p < 0.05, the probability of this difference/ correlation occurring by chance is less than 5%. We reject the null hypothesis. There is a statistically significant difference/correlation."
-
"Since p > 0.05, the probability of this difference/ correlation occurring by chance is more than 5%. We accept the null hypothesis. There is no statistically significant difference/correlation."
-
Never just say ‘the results’ are significant/ not significant. Always say ‘difference’ or ‘correlation’ depending on the data!
If using a critical value table, remember to state whether the test statistic is greater or smaller than the critical value.
No answer provided.
A t-test was carried out to compare the mean blood glucose levels between two groups. The calculated t-value was 2.45, the critical value at p = 0.05 is 2.10. Explain whether the difference between the groups is statistically significant. (4 marks)
-
The calculated t-value (2.45) is greater than the critical value (2.10).
-
Therefore, the probability of this difference occurring by chance is less than 0.05 / 5%.
-
We reject the null hypothesis.
-
The difference in blood glucose levels is statistically significant.
In an investigation, the population density of plants in a regularly cut lawn was compared with that in a lawn which was only cut occasionally.

What conclusions can be drawn from the results of this investigation? (4 marks)
-
Daisy, dandelion and buttercup show statistically significant differences
-
As the probability of these differences occurring by chance was less than 0.05/ 5%
-
Buttercups show the greatest significant difference (less than 1% probability of this difference occurring by chance)
-
Regular cutting linked to significant increase in density of daisy / dandelion or
linked to significant decrease in density of buttercup
Practice Question
Try to answer the practice question from the TikTok on your own, then watch the video to see how well you did!