Required Practical - Sampling To Measure Population Size And The Effect Of A Factor On Distribution
Laura Armstrong & Joe Wolfensohn
Teachers


Contents
Recall Questions
This topic requires prior knowledge of sampling using quadrats and transects.
What is a quadrat used for?
To sample plants (or very slow-moving animals) and estimate population size.
What is a transect used for?
To study how the distribution of organisms changes across an area.
Give one abiotic factor that can affect the distribution of plants.
Examples: light intensity, temperature, soil pH, moisture levels.
Topic Explainer Video
Check out this @lauradoesGCSEbiology video that explains the required practical - sampling to measure population size and the effect of a factor on distribution, then read the study notes. Once you’ve gone through them, don’t forget to try the practice questions!
Required Practical - Sampling
Purpose of the Required Practical
This practical teaches you how to:
- Estimate the population size of an organism (e.g. daisy plants).
- Investigate how an abiotic factor (like light) affects where organisms are found.
Method 1: Using Quadrats to Estimate Population Size – Re-cap
Key Steps:
- Place quadrats randomly in your study area (e.g. use a random number generator to select co-ordinates).
- Count the number of the target organism in each quadrat.
- Use a large number of quadrats.
- Calculate the mean number per quadrat.
- Multiply the mean number per metre2 by the total area to estimate the population.
Example:
If the mean number of daisies per m² is 3, and the field is 100 m², then estimated total daisies = 300.
Method 2: Using Transects to Measure Distribution- Re-cap
Key Steps:
- Stretch a transect line (like a tape measure) across your study area.
- Place a quadrat at regular intervals along the line (e.g. every 1 m).
- Count or estimate percentage cover of the organism in each quadrat.
- Measure the abiotic factor (e.g. light using a light metre) at each point.
- Look for patterns - does the distribution change as the abiotic factor changes?
Example:
More plants may grow in an open field than under trees as there’s more light for photosynthesis and less competition for water and minerals.
Step-by-Step Method: Investigating Distribution Across a Pollution Gradient
Aim: To find out how the number of a particular plant species (e.g. daisies) changes with distance from a road, and how pollution (e.g. exhaust fumes) might affect its distribution.
Equipment:
- 50 m measuring tape (transect line)
- Quadrat (e.g. 0.5 m × 0.5 m)
- Notebook and pen
- Calculator
Method:
Choose the site:
- Select an area running at a right angle from the road edge into a field.
Lay out the transect:
- Stretch a measuring tape from the edge of the road to 50 m into the field.
Decide sampling points:
- Mark points at regular intervals along the transect, e.g. every 5 m: 0 m, 5 m, 10 m … up to 50 m.
Count the plants:
- At each sampling point, place the quadrat on the ground and count the number of target plant species (e.g. daisies) inside the quadrat at each point.
- If the plants are too numerous or hard to count, estimate percentage cover using the gridded squares method.
Record other abiotic observations (optional):
- Measure light intensity if relevant (though in this case the main factor is pollution).
Repeat:
- If possible, repeat the transect at least 2 more times at different places along the road to get more representative data. Remember to use many quadrats alongside each transect.
Record results:
- Record your data in a table:
|
Distance from road (m) |
Number of daisies (transect 1) |
Number of daisies (transect 2) |
Number of daises (transect 3) |
Mean number of daisies |
|
0 |
||||
|
5 |
||||
|
10 |
||||
|
… |
||||
|
50 |
Analyse your data:
- Calculate the mean number of daisies at each distance using your repeats.
- Plot a line graph of distance from road on the x-axis and mean number of daisies on the y-axis.
Interpret your results:
- Look for a pattern - for example, are there fewer plants near the road due to higher pollution?
- Link your findings to abiotic factors: exhaust fumes and salt in winter can damage plants and reduce plant growth near roads.
Key idea:
- If the number of plants increases as you move away from the road, you can suggest that pollution close to the road affects their distribution.
Key Terms and Definitions
- Quadrat - A square frame of known area used for sampling.
- Transect - A line used to study distribution changes.
- Population - The number of one species in an area.
- Distribution - Where organisms are found.
- Abiotic factor - A non-living factor affecting an ecosystem (e.g. light).
No answer provided.
Exam Tips:
When using a transect, describe how you would measure the abiotic factor (e.g. light meter to measure light intensity or pH meter to measure pH of the soil).
Always think about repeats! Use many quadrats and always carry out repeat transects.
No answer provided.
Practice Question
Some students investigated the distribution of dandelion plants in a grassy field. The grassy field was between two areas of woodland.
Image 1 shows two students recording how many dandelion plants there are in a 1 m x 1 m quadrat.
Image 1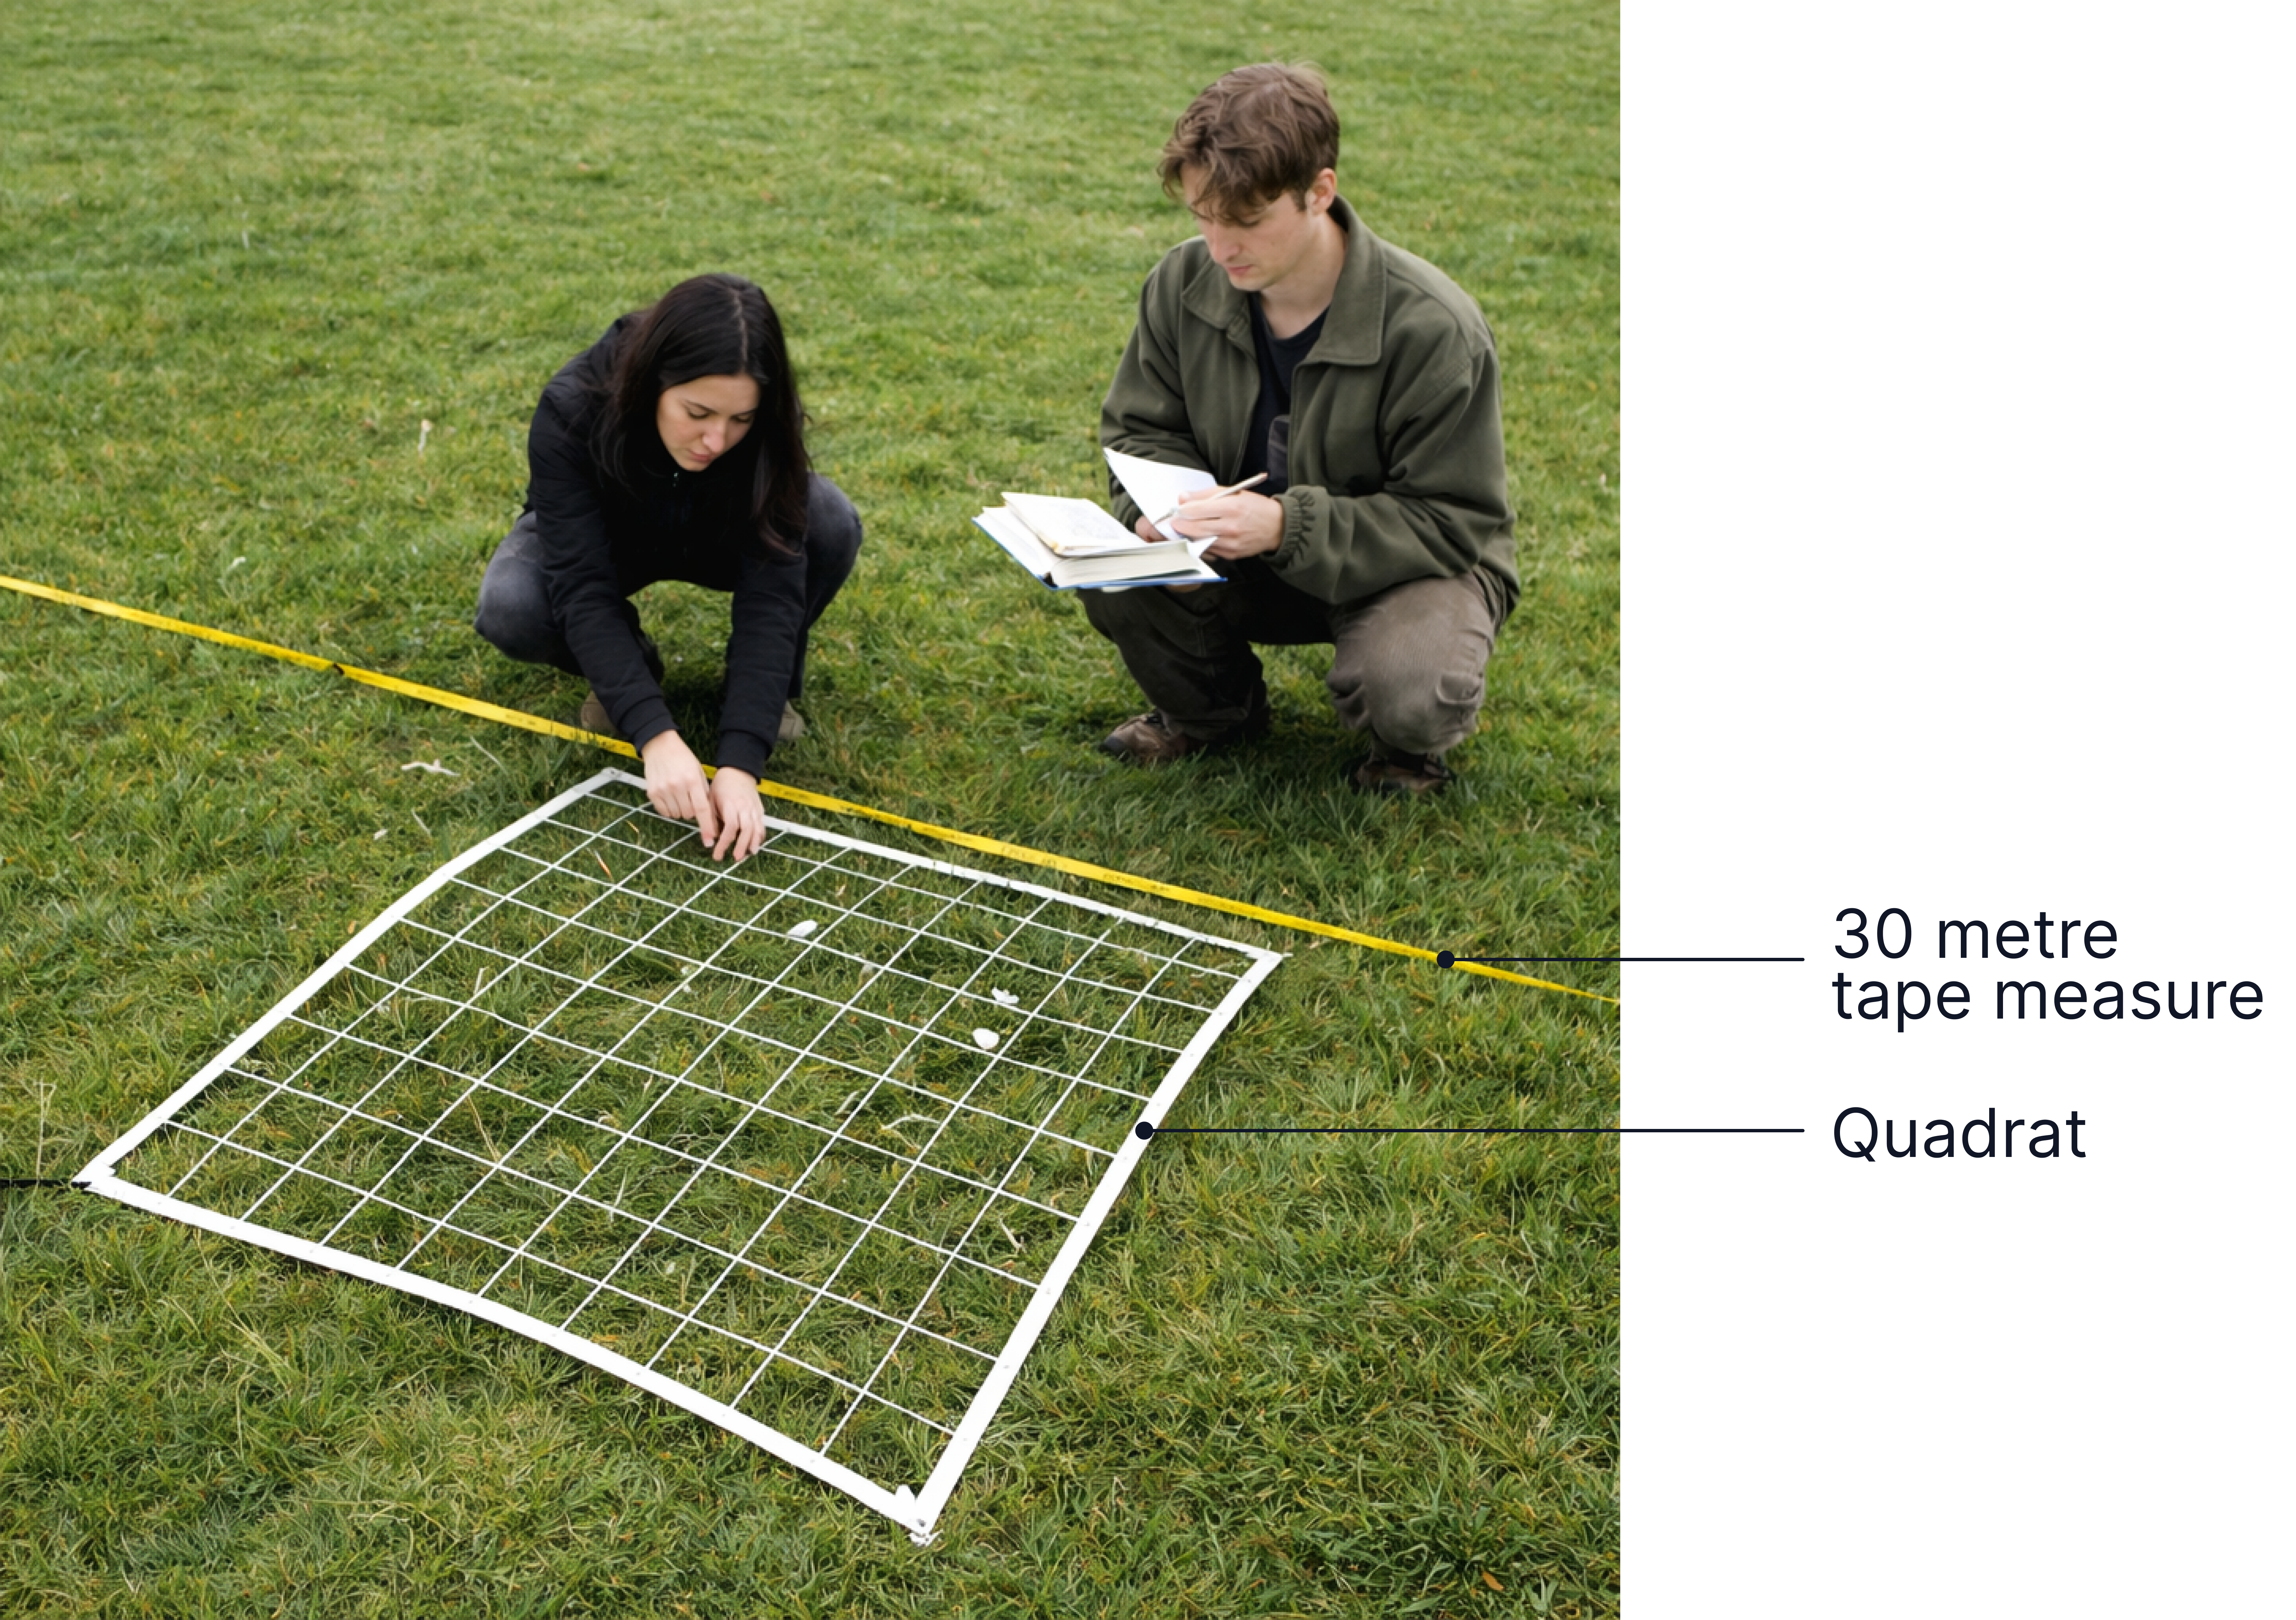
Image 2 shows a section across the area studied and Image 3 shows a bar chart of the students’ results.
Image 2
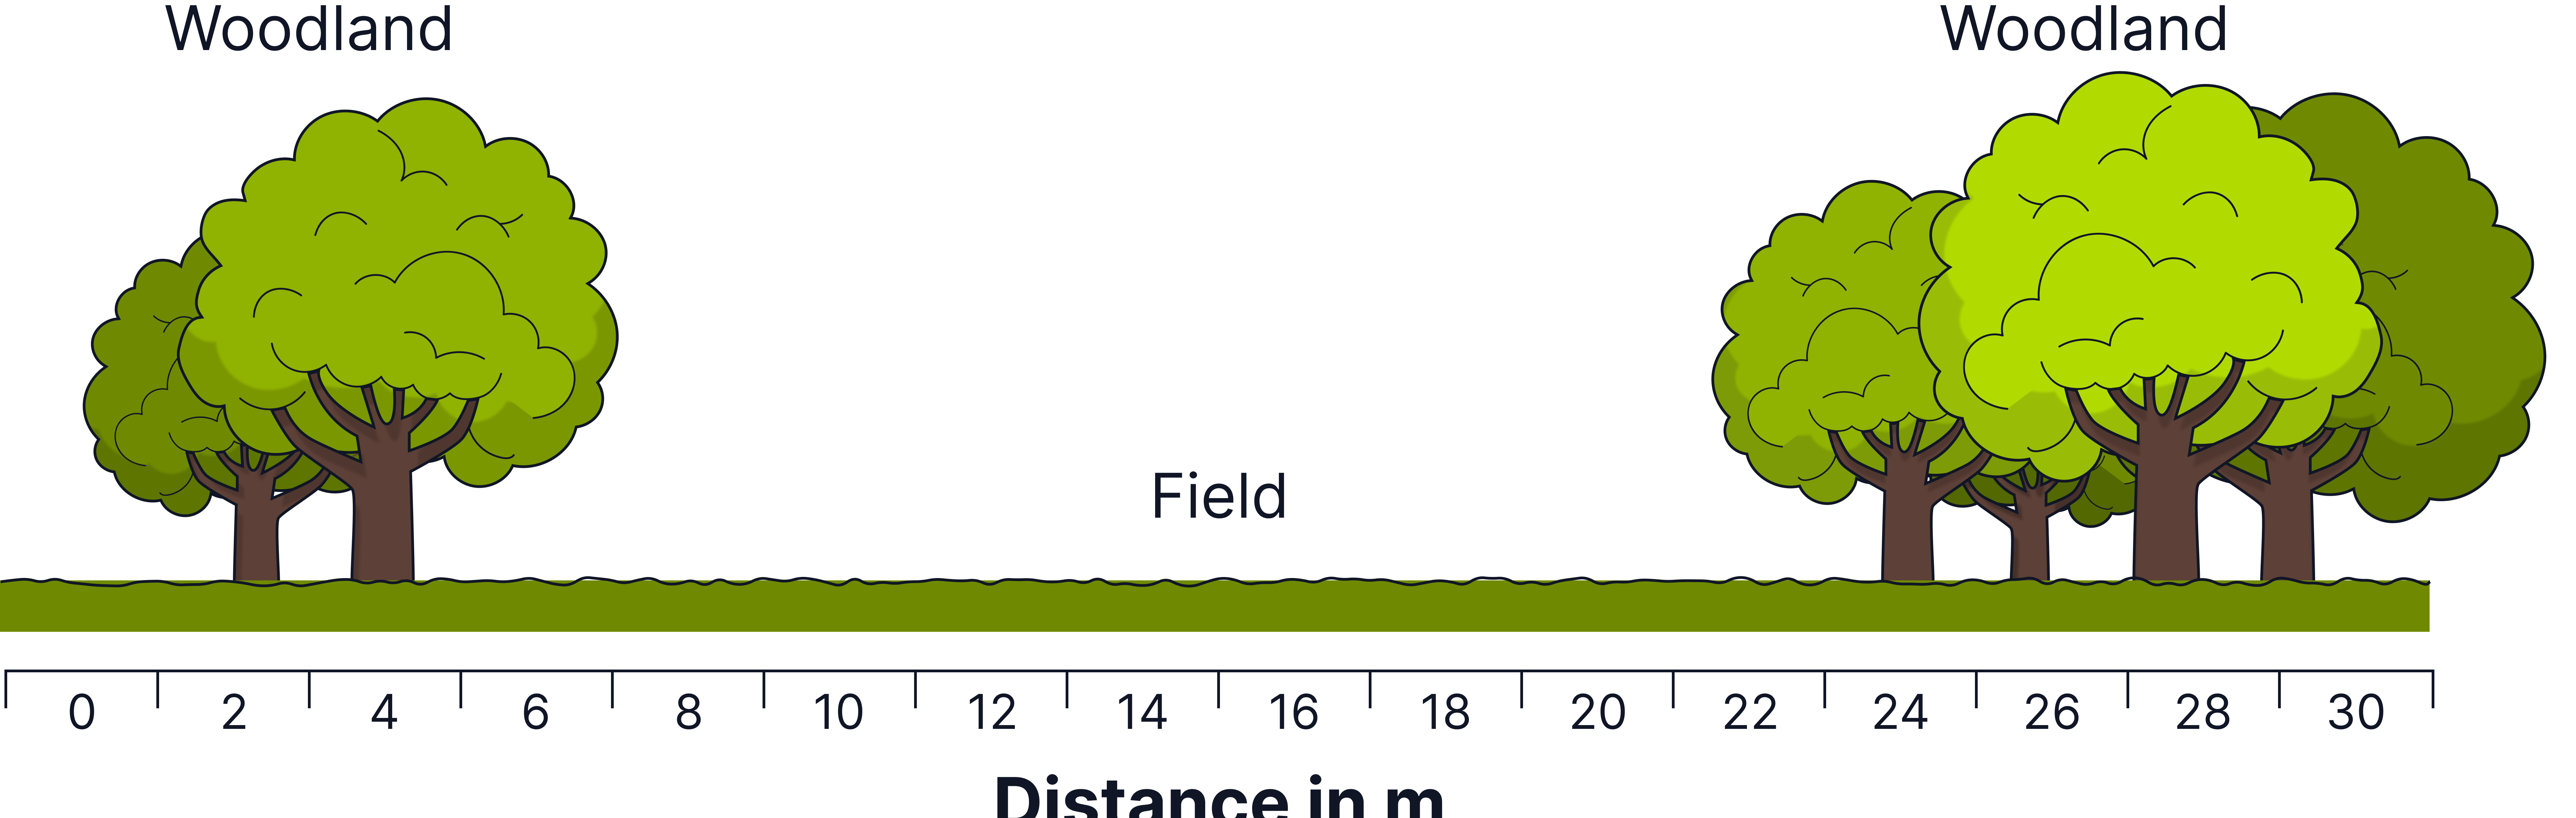
Image 3
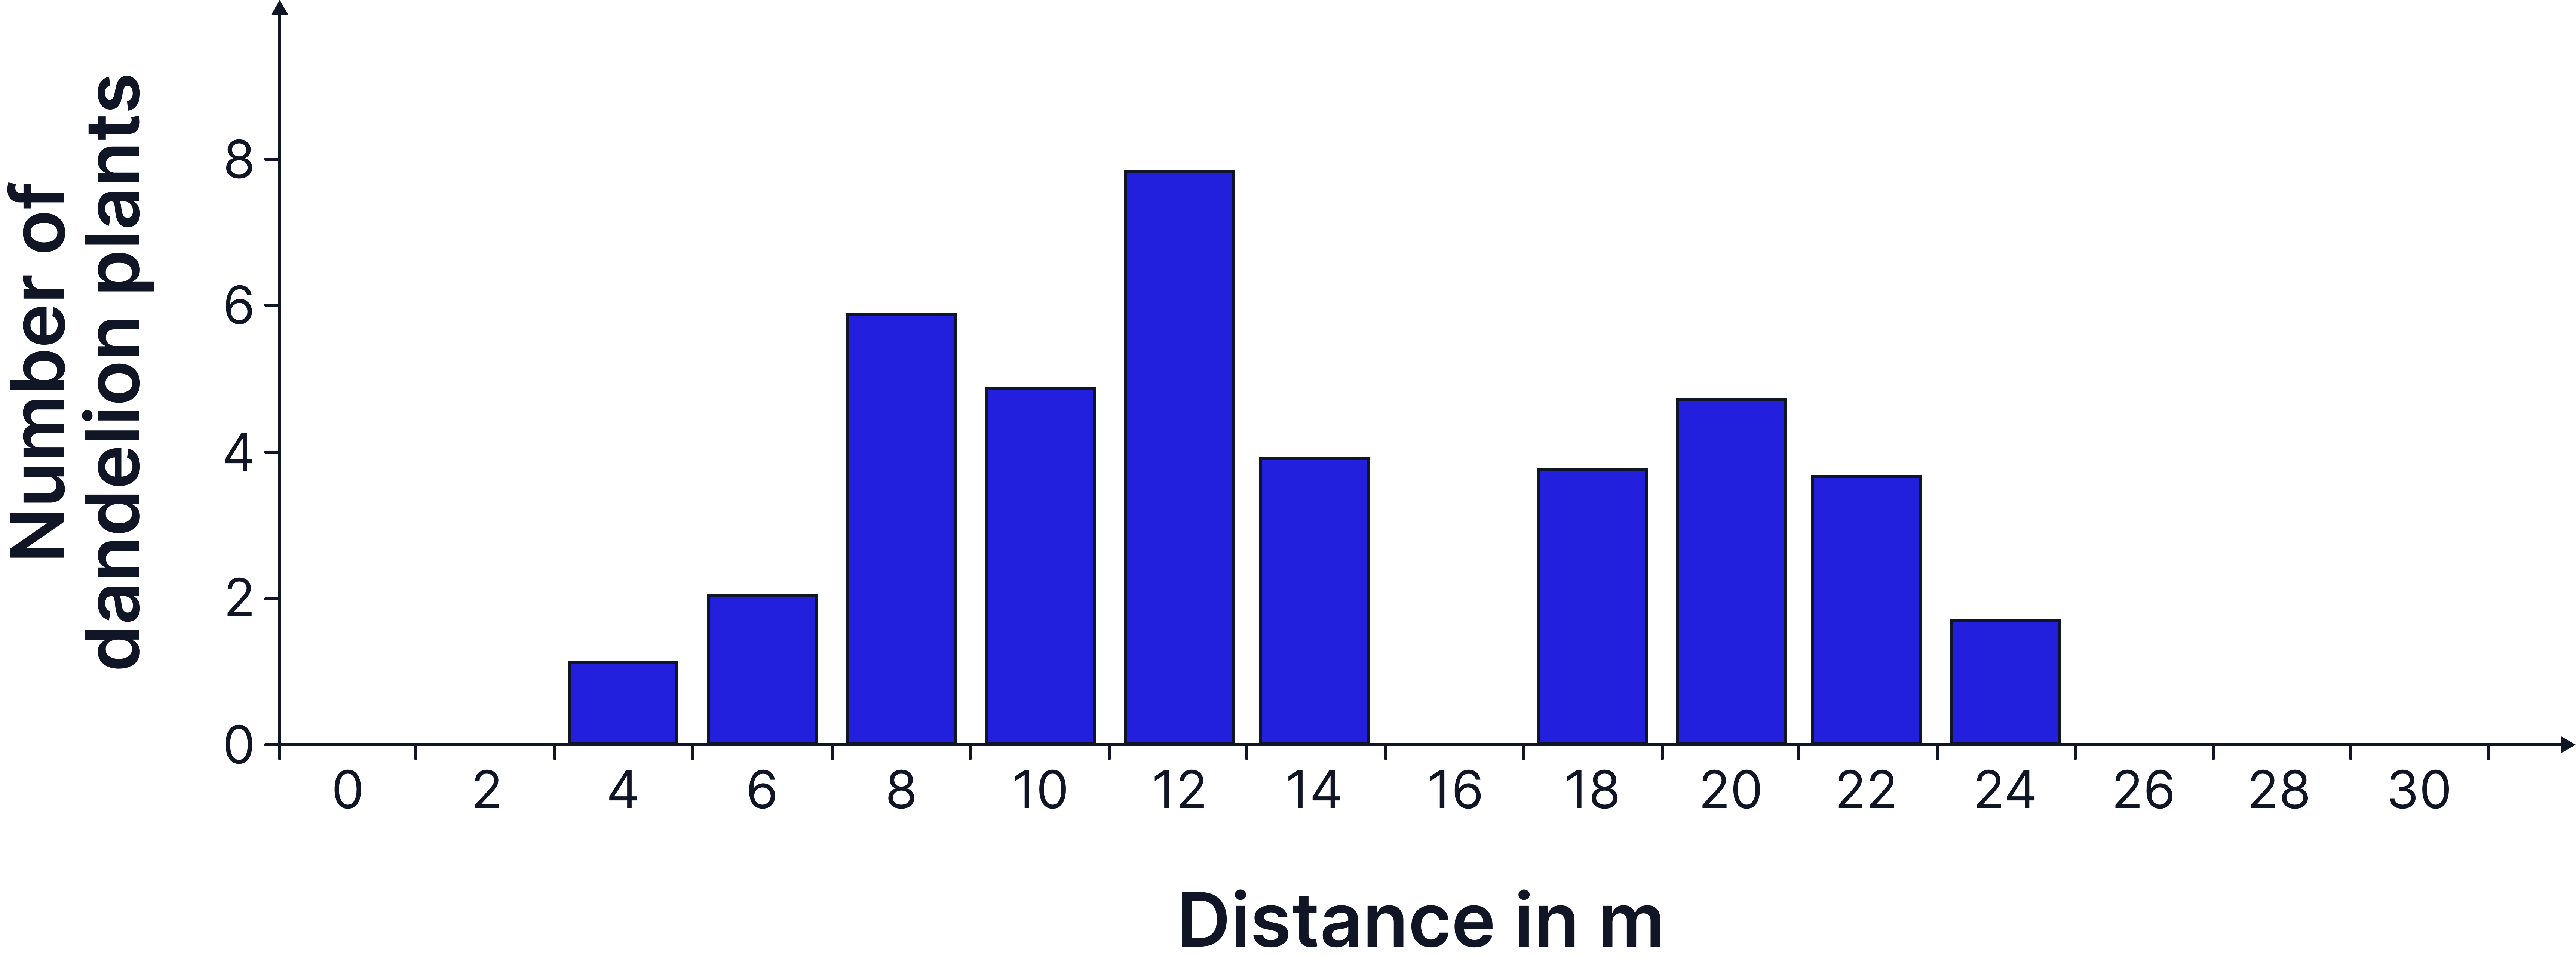
a) How did the students use the quadrat and the 30-metre tape measure to get the results in Image 3? Use information from Image 1. (3 marks)
b) Suggest one reason why the students found no dandelion plants under the trees. (1 mark)
c) Suggest one reason why the students found no dandelion plants at 16 metres. (1 mark)
Model Answers:
a) any three from:
• place 30-m tape measure across field / from one wood to the other.
• place quadrats next to the tape.
• count / record the number / amount of dandelions in the quadrat.
• repeat every 2 metres / every metre / at regular intervals.
b) low light / it is shady / no light.
or
not enough water / ions.
or
wrong pH of soil.
accept competition with trees for light / water / ions.
c) sensible suggestion for a small area, e.g., chance variation / anomaly / poisoned by animal waste / wrong pH of soil / eaten by animals / cut down / footpath / trampled on.
More Practice
Try to answer these practice questions from the TikTok videos on your own, then watch the videos to see how well you did!